Analysis Summary
Notes:
- 1) No attempt has been made to eliminate the non-significant decimal places.
- 2) This batgrbproduct analysis is done using the HEASARC data.
- 3) This batgrbproduct analysis is using the flight position for the mask-weighting calculation.
======================================================================
                  BAT GRB EVENT DATA PROCESSING REPORT
    Process Script Ver: batgrbproduct v2.46
    Process Start Time: Mon Mar  3 23:52:41 EST 2014
             Host Name: batevent1
   Current Working Dir: /local/data/batevent/batevent_reproc/trigger585149
======================================================================

  Trigger: 00585149      Segment: 000

  BAT Trigger Time: 412692681.024   [s; MET]
      Trigger Stop: 412692682.048   [s; MET]
               UTC: 2014-01-29T12:51:09.445000    [includes UTCF correction]
       Where From?: TDRSS position message

  BAT
    RA: 326.763234774959   Dec: 26.2066742011522  [deg; J2000]

     Catalogged Source?: NO
     Point Source?:      YES
     GRB Indicated?:     YES    [ by BAT flight software ]
     Image S/N Ratio:    7.65
     Image Trigger?:     NO
     Rate S/N Ratio:     12.7279220613579  [ if not an image trigger ]
     Image S/N Ratio:    7.65

  Analysis Position:   [ source = BAT ]
    RA: 326.763234774959   Dec: 26.2066742011522  [deg; J2000]

  Refined Position:   [ source = BAT pre-slew burst ]
    RA: 326.763998868589   Dec: 26.2147232524694  [deg; J2000]
        { 21h 47m 03.4s , +26d 12' 53.0" }
         +/- 2.05368689118794 [arcmin] (estimated 90% radius based on SNR)
         +/- 1.05093857522619 [arcmin] (formal 1-sigma fit error)
    SNR: 10.880300924924

  Angular difference between the analysis and refined position is 0.484691 arcmin

  Partial Coding Fraction: 1.015625    [ including projection effects ]

  Duration
     T90: 1.35999995470047 +/- 0.212941257677667
        Measured from: 0.171999990940094
                   to: 1.53199994564056     [s; relative to TRIGTIME]
     T50: 0.843999922275543 +/- 0.233649354794951
        Measured from: 0.340000033378601
                   to: 1.18399995565414     [s; relative to TRIGTIME]


  Fluence
     Peak Flux  (peak 1 second)
        Measured from: 0.171999990940094
                   to: 1.17199999094009     [s; relative to TRIGTIME]
     Total Fluence
        Measured from: 0.0760000348091125
                   to: 1.58799999952316     [s; relative to TRIGTIME]

             Band 1     Band 2     Band 3     Band 4
              15-25      25-50     50-100    100-350     keV
 Total     0.067576   0.050920   0.030677   0.005099
           0.008227   0.008206   0.006799   0.006021 [error]
 Peak      0.047543   0.037778   0.022526  -0.001837
           0.006614   0.006802   0.005548   0.004802 [error]

     [ fluence units of on-axis counts / fully illuminated detector ]

======================================================================


====== Table of the duration information =============================

        Value   tstart    tstop
T100    1.512    0.076    1.588
T90     1.360    0.172    1.532
T50     0.844    0.340    1.184
Peak    1.000    0.172    1.172


====== Spectral Analysis Summary =====================================

Model      : spectral model: simple power-law (PL) and cutoff power-law (CPL)
Ph_index   : photon index: E^{Ph_index}
Ph_90err   : 90% error of the photon index
Epeak      : Epeak in keV
Epeak_90err: 90% error of Epeak
Norm       : normalization at 50 keV in both the PL model and CPL model
Nomr_90err : 90% error of the normalization
chi2       : Chi-Squared
dof        : degree of freedo

=== Time-averaged spectral analysis ===
(Best model with acceptable fit: PL)

Model Ph_index Ph_90err_low Ph_90err_hi  Epeak  Epeak_90err_low  Epeak_90err_hi  Norm       Nomr_90err_low    Norm_90err_hi    chi2    dof
PL      -2.230    -0.350      0.313       -           -               -         4.96e-03     -1.19e-03          1.14e-03      49.330   57
CPL     -1.992     1.992      1.992        1.496      N/A           N/A         6.71e-03        N/A               N/A         49.790   56


=== 1-s peak spectral analysis ===
(Best model with acceptable fit: PL)

Model Ph_index Ph_90err_low Ph_90err_hi  Epeak  Epeak_90err_low  Epeak_90err_hi  Norm       Nomr_90err_low    Norm_90err_hi    chi2    dof
PL      -2.232     -0.381     0.336       -           -               -         5.39e-03     -1.43e-03          1.39e-03      66.210   57
CPL     -2.225     -0.653     0.336     9999.360      N/A           N/A         5.41e-03        N/A               N/A         66.210   56


=== Fluence/Peak Flux Summary ===

              Model    Band1     Band2     Band3     Band4     Band5     Total
                       15-25     25-50    50-100    100-350    15-150    15-350    keV
Fluence         PL   1.91e-08  2.26e-08  1.92e-08  2.78e-08  7.08e-08  8.87e-08   erg/cm2
      90%_error_low -3.79e-09 -3.77e-09 -6.03e-09 -1.39e-08 -1.38e-08 -2.25e-08   erg/cm2
      90%_error_hi   3.84e-09  3.67e-09  6.47e-09  2.13e-08  1.44e-08  2.83e-08   erg/cm2
Peak flux       PL   4.50e-01  2.95e-01  1.26e-01  7.32e-02  9.07e-01  9.44e-01   ph/cm2/s
      90%_error_low -9.89e-02 -5.39e-02 -4.20e-02 -3.74e-02 -1.54e-01 -1.64e-01   ph/cm2/s
      90%_error_hi   1.01e-01  5.28e-02  4.49e-02  5.67e-02  1.54e-01  1.65e-01   ph/cm2/s

Fluence        CPL    N/A      N/A      N/A      N/A      N/A      N/A      erg/cm2
      90%_error_low -3.79e-09 -3.77e-09 -6.03e-09 -1.39e-08 -1.38e-08 -2.25e-08   erg/cm2
      90%_error_hi   3.84e-09  3.67e-09  6.47e-09  2.13e-08  1.44e-08  2.83e-08   erg/cm2
Peak flux      CPL   4.42e-01  3.04e-01  1.24e-01  4.97e-02  8.97e-01  9.19e-01   ph/cm2/s
      90%_error_low -9.25e-02 -5.16e-02 -4.85e-02 -4.97e-02 -1.50e-01     N/A     ph/cm2/s
      90%_error_hi   9.73e-02  5.21e-02  4.66e-02  9.52e-02  1.58e-01     N/A     ph/cm2/s

======================================================================
Image
Pre-slew 15.0-350.0 keV image (Event data)
#   RAcent    DECcent   POSerr    Theta     Phi              Peak Cts       SNR   Name
  326.7640    26.2147   0.0177    13.7748  -167.8239         0.1590546     10.880 TRIG_00585149

Foreground time interval of the image:
  0.076   1.588 (delta_t =   1.512 [sec])
Background time interval of the image:
-239.024   0.076 (delta_t = 239.100 [sec])
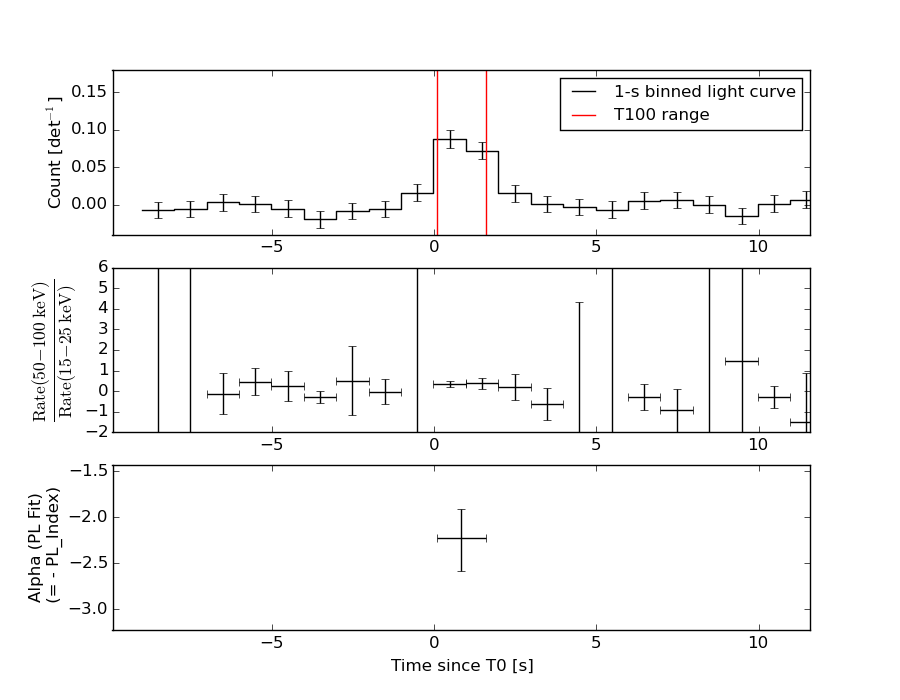
Light Curves
Note: The mask-weighted lightcurves have units of either count/det or counts/sec/det, where a det is 0.4 x 0.4 = 0.16 sq cm.
Full-time range; 1 s binning
Other quick-look light curves:
- 64 ms binning (zoomed)
- 16 ms binning (zoomed)
- 8 ms binning (zoomed)
- 2 ms binning (zoomed)
- SN=5 or 10 s binning (full-time range)
- Raw light curve
Spectra
- 64 ms binning (zoomed)
- 16 ms binning (zoomed)
- 8 ms binning (zoomed)
- 2 ms binning (zoomed)
- SN=5 or 10 s binning (full-time range)
- Raw light curve
Spectra
Notes:
- 1) The fitting includes the systematic errors.
- 2) When the burst includes telescope slew time periods, the fitting uses an average response file made from multiple 5-s response files through out the slew time plus single time preiod for the non-slew times, and weighted by the total counts in the corresponding time period using addrmf. An average response file is needed becuase a spectral fit using the pre-slew DRM will introduce some errors in both a spectral shape and a normalization if the PHA file contains a lot of the slew/post-slew time interval.
- 3) For fits to more complicated models (e.g. a power-law over a cutoff power-law), the BAT team has decided to require a chi-square improvement of more than 6 for each extra dof.
Time averaged spectrum fit using the average DRM
Power-law model
Time interval is from    0.076 sec. to    1.588 sec.

Spectral model in power-law:
------------------------------------------------------------
Parameters  : value       lower 90%   higher 90%
Photon index: -2.23046     ( -0.349509   0.313109 )
Norm@50keV  : 4.95524E-03    ( -0.00118635   0.0011448 )
------------------------------------------------------------
#Fit statistic : Chi-Squared =          49.33 using 59 PHA bins.
# Reduced chi-squared =         0.8655 for     57 degrees of freedom
# Null hypothesis probability =   7.548599e-01

Photon flux (15-150 keV)    in 1.512 sec: 0.833805 ( -0.126294  0.126305 ) ph/cm2/s
Energy fluence (15-150 keV)             : 7.07754e-08 ( -1.37863e-08  1.44192e-08 ) ergs/cm2
Cutoff power-law model

Time interval is from    0.076 sec. to    1.588 sec.
Spectral model in the cutoff power-law:
------------------------------------------------------------
Parameters  : value       lower 90%   higher 90%
Photon index: -2.42152     ( 1.99215   1.99215 )
Epeak [keV] : 166.688      (   )
Norm@50keV  : 3.88569E-03    (     )
------------------------------------------------------------
#Fit statistic : Chi-Squared =          49.15 using 59 PHA bins.
# Reduced chi-squared =         0.8777 for     56 degrees of freedom
# Null hypothesis probability =   7.297829e-01

Photon flux (15-150 keV)    in 1.512 sec: 0.786487 ( -0.247023  0.172706 ) ph/cm2/s
Energy fluence (15-150 keV)             : 0 ( 0  0 ) ergs/cm2
1-s peak spectrum fit
Power-law model
Time interval is from    0.172 sec. to    1.172 sec.

Spectral model in power-law:
------------------------------------------------------------
Parameters  : value       lower 90%   higher 90%
Photon index: -2.23226     ( -0.380537   0.336411 )
Norm@50keV  : 5.38541E-03    ( -0.00143247   0.00138874 )
------------------------------------------------------------
#Fit statistic : Chi-Squared =          66.21 using 59 PHA bins.
# Reduced chi-squared =          1.162 for     57 degrees of freedom
# Null hypothesis probability =   1.889799e-01

Photon flux (15-150 keV)    in 1 sec: 0.907061 ( -0.154377  0.154409 ) ph/cm2/s
Energy fluence (15-150 keV)             : 5.08862e-08 ( -1.10819e-08  1.16455e-08 ) ergs/cm2
Cutoff power-law model

Time interval is from    0.172 sec. to    1.172 sec.
Spectral model in the cutoff power-law:
------------------------------------------------------------
Parameters  : value       lower 90%   higher 90%
Photon index: -2.22547     ( -0.65062   0.337921 )
Epeak [keV] : 9999.36      (   )
Norm@50keV  : 5.41104E-03    (     )
------------------------------------------------------------
#Fit statistic : Chi-Squared =          66.21 using 59 PHA bins.
# Reduced chi-squared =          1.182 for     56 degrees of freedom
# Null hypothesis probability =   1.650829e-01

Photon flux (15-150 keV)    in 1 sec: 0.897300 ( -0.149957  0.15776 ) ph/cm2/s
Energy fluence (15-150 keV)             : 0 ( 0  0 ) ergs/cm2
Time-resolved spectra
Distribution
T90 vs. Hardness ratio plot
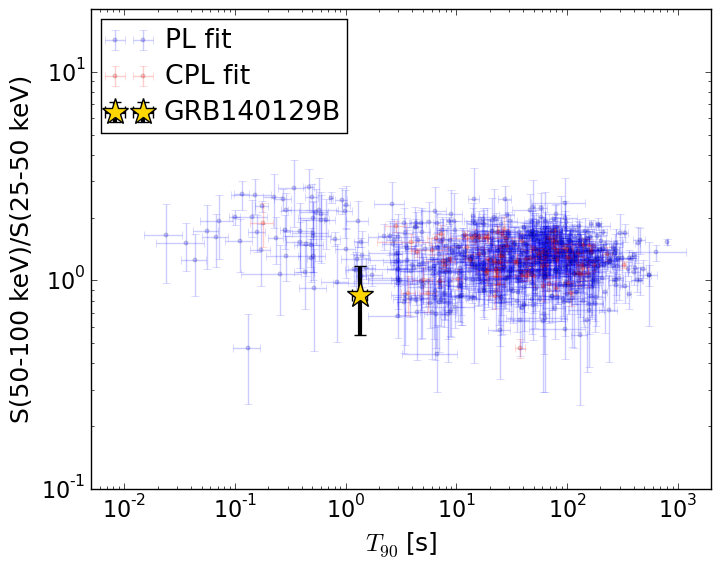
T90                                   = 1.36 sec.
Hardness ratio (energy fluence ratio) = 0.852413039729
S(15-50 keV) vs. S(50-150 keV) plot
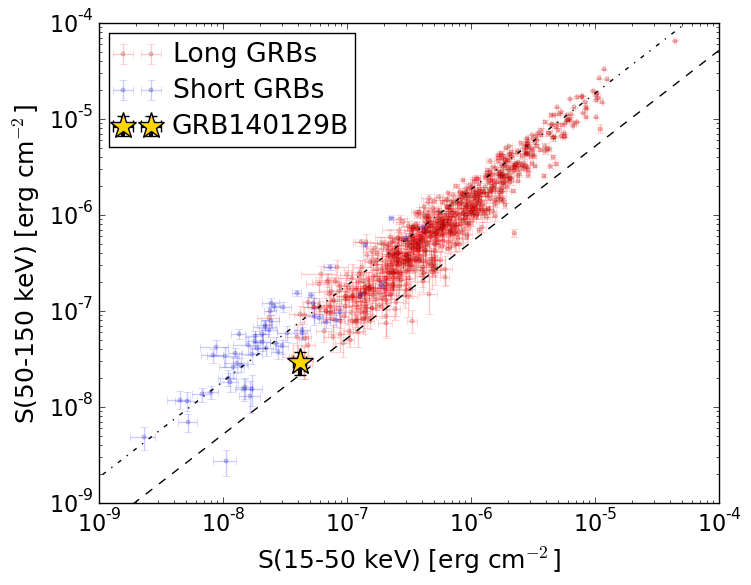
S(15-50 keV)  = 4.164537e-08
S(50-150 keV) = 2.9129223e-08
The dash-dotted line and the dashed line traces the fluences calculated from the Band function with Epeak = 15 and 150 keV, respectively. Both lines assume a canonical values of alpha = -1 and beta = -2.5.
Mask shadow pattern
IMX = -2.396429390421482E-01, IMY = 5.170811366039454E-02
Spacecraft aspect plot
Bright source in the pre-burst/pre-slew/post-slew images
Pre-burst image of 15-350 keV band
Time interval of the image:
-239.024000 0.076000

# RAcent  DECcent POSerr Theta    Phi  PeakCts   SNR AngSep     Name
#  [deg]    [deg]    ['] [deg]  [deg]                   [']
254.2823  35.3533  685.5  48.0   22.0   0.0114   0.0    8.6	Her X-1
268.3922  -1.4970   20.9  52.0  -29.6   0.3624   0.6    3.0	SW J1753.5-0127
288.8218  10.9649    0.9  28.6  -37.2   3.5000  13.2    1.8	GRS 1915+105
299.5899  35.2132    1.5  11.5   29.8   1.6244   7.6    0.7	Cyg X-1
308.0879  40.9509    1.1  11.3   75.6   2.2732  10.1    1.0	Cyg X-3
326.0071  38.3209    8.2  14.4  140.8   0.3163   1.4    7.7	Cyg X-2
323.9530  52.4656    2.3  24.2  108.1   1.5176   5.0 ------	UNKNOWN
258.9432  31.7826    2.8  44.9   16.1   1.8256   4.1 ------	UNKNOWN
255.0908  25.6421    2.6  49.8    9.3   2.7224   4.4 ------	UNKNOWN
261.4971  26.3331    2.5  44.1    7.8   1.8100   4.6 ------	UNKNOWN
Pre-slew background subtracted image of 15-350 keV band
Time interval of the image:
0.076000 1.588000

# RAcent  DECcent POSerr Theta    Phi  PeakCts   SNR AngSep     Name
#  [deg]    [deg]    ['] [deg]  [deg]                   [']
254.5009  35.4477    3.7  47.8   22.1   0.1348   3.1    6.7	Her X-1
268.5054  -1.4368    4.4  51.8  -29.7  -0.1138  -2.6    8.3	SW J1753.5-0127
288.8396  10.9682    6.6  28.6  -37.2   0.0316   1.7    2.8	GRS 1915+105
299.4027  35.2333   17.3  11.6   29.6   0.0096   0.7    9.4	Cyg X-1
308.0079  41.0996    6.3  11.5   75.5  -0.0287  -1.8   10.0	Cyg X-3
326.3828  38.4434    0.0  14.7  141.0  -0.0179  -1.1   12.3	Cyg X-2
267.3888  53.0590    1.8  39.5   48.4   0.2229   6.4 ------	UNKNOWN
313.2394  60.3281    2.1  30.3   91.2   0.1380   5.4 ------	UNKNOWN
326.7640  26.2147    1.1  13.8 -167.8   0.1590  10.9 ------	UNKNOWN
Post-slew image of 15-350 keV band
Time interval of the image:
50.876600 963.026200

# RAcent  DECcent POSerr Theta    Phi  PeakCts   SNR AngSep     Name
#  [deg]    [deg]    ['] [deg]  [deg]                   [']
288.7975  10.9371    0.9  38.9  -35.3  12.6364  13.3    0.5	GRS 1915+105
299.5972  35.1897    1.2  24.9    8.3   6.5042   9.7    0.8	Cyg X-1
308.1038  40.9674    0.8  21.3   29.0   9.3281  13.7    0.9	Cyg X-3
326.1380  38.2304    4.7  12.0   68.3  -1.4258  -2.4    5.7	Cyg X-2
279.5364  60.6471    4.9  46.9   41.1   6.7762   2.4 ------	UNKNOWN
272.0986  18.2604    3.1  50.9  -16.6   5.0836   3.7 ------	UNKNOWN
266.6173  15.3665    3.8  56.8  -17.7   7.6670   3.0 ------	UNKNOWN
319.0853 -14.2760    5.6  41.2  -98.1   8.4250   2.1 ------	UNKNOWN