Analysis Summary
Notes:
- 1) No attempt has been made to eliminate the non-significant decimal places.
- 2) This batgrbproduct analysis is done using the HEASARC data.
- 3) This batgrbproduct analysis is using the flight position for the mask-weighting calculation.
======================================================================
                  BAT GRB EVENT DATA PROCESSING REPORT
    Process Script Ver: batgrbproduct v2.46
    Process Start Time: Mon Mar  3 23:55:21 EST 2014
             Host Name: batevent1
   Current Working Dir: /local/data/batevent/batevent_reproc/trigger585834
======================================================================

  Trigger: 00585834      Segment: 000

  BAT Trigger Time: 413363851.776   [s; MET]
      Trigger Stop: 413363852.8   [s; MET]
               UTC: 2014-02-06T07:17:20.165420    [includes UTCF correction]
       Where From?: TDRSS position message

  BAT
    RA: 145.350247125002   Dec: 66.7503930303182  [deg; J2000]

     Catalogged Source?: NO
     Point Source?:      YES
     GRB Indicated?:     YES    [ by BAT flight software ]
     Image S/N Ratio:    18.35
     Image Trigger?:     NO
     Rate S/N Ratio:     52.820450584977  [ if not an image trigger ]
     Image S/N Ratio:    18.35

  Analysis Position:   [ source = BAT ]
    RA: 145.350247125002   Dec: 66.7503930303182  [deg; J2000]

  Refined Position:   [ source = BAT pre-slew burst ]
    RA: 145.321432651379   Dec: 66.7609958708438  [deg; J2000]
        { 09h 41m 17.1s , +66d 45' 39.6" }
         +/- 0.690661747345658 [arcmin] (estimated 90% radius based on SNR)
         +/- 0.198550636252018 [arcmin] (formal 1-sigma fit error)
    SNR: 51.6106385954751

  Angular difference between the analysis and refined position is 0.932871 arcmin

  Partial Coding Fraction: 1    [ including projection effects ]

  Duration
     T90: 94.1879999041557 +/- 18.3610798297631
        Measured from: 1.87999999523163
                   to: 96.0679998993874     [s; relative to TRIGTIME]
     T50: 11.3839999437332 +/- 19.6462154393177
        Measured from: 51.6839999556541
                   to: 63.0679998993874     [s; relative to TRIGTIME]


  Fluence
     Peak Flux  (peak 1 second)
        Measured from: 60.8039999604225
                   to: 61.8039999604225     [s; relative to TRIGTIME]
     Total Fluence
        Measured from: -38.3040000200272
                   to: 256.060000002384     [s; relative to TRIGTIME]

             Band 1     Band 2     Band 3     Band 4
              15-25      25-50     50-100    100-350     keV
 Total     7.484973  10.443103   7.999963   1.693059
           0.108077   0.114834   0.103035   0.087529 [error]
 Peak      0.569354   0.969866   0.902770   0.196029
           0.013324   0.017050   0.016707   0.009710 [error]

     [ fluence units of on-axis counts / fully illuminated detector ]

======================================================================


====== Table of the duration information =============================

        Value   tstart    tstop
T100  294.364  -38.304  256.060
T90    94.188    1.880   96.068
T50    11.384   51.684   63.068
Peak    1.000   60.804   61.804


====== Spectral Analysis Summary =====================================

Model      : spectral model: simple power-law (PL) and cutoff power-law (CPL)
Ph_index   : photon index: E^{Ph_index}
Ph_90err   : 90% error of the photon index
Epeak      : Epeak in keV
Epeak_90err: 90% error of Epeak
Norm       : normalization at 50 keV in both the PL model and CPL model
Nomr_90err : 90% error of the normalization
chi2       : Chi-Squared
dof        : degree of freedo

=== Time-averaged spectral analysis ===
(Best model with acceptable fit: CPL)

Model Ph_index Ph_90err_low Ph_90err_hi  Epeak  Epeak_90err_low  Epeak_90err_hi  Norm       Nomr_90err_low    Norm_90err_hi    chi2    dof
PL      -1.510    -0.033      0.033       -           -               -         6.02e-03     -1.04e-04          1.04e-04      64.040   57
CPL     -1.142    -0.141      0.145      133.610     -22.100        46.299      8.71e-03     -1.12e-03          1.33e-03      43.470   56


=== 1-s peak spectral analysis ===
(Best model with acceptable fit: CPL)

Model Ph_index Ph_90err_low Ph_90err_hi  Epeak  Epeak_90err_low  Epeak_90err_hi  Norm       Nomr_90err_low    Norm_90err_hi    chi2    dof
PL      -1.271     -0.038     0.038       -           -               -         1.74e-01     -3.90e-03          3.90e-03     100.760   57
CPL     -0.536     -0.174     0.181      115.633     -12.020        18.234      3.67e-01     -5.77e-02          7.12e-02      43.200   56


=== Fluence/Peak Flux Summary ===

              Model    Band1     Band2     Band3     Band4     Band5     Total
                       15-25     25-50    50-100    100-350    15-150    15-350    keV
Fluence         PL   2.29e-06  4.17e-06  5.86e-06  1.73e-05  1.68e-05  2.96e-05   erg/cm2
      90%_error_low -8.39e-08 -8.87e-08 -1.18e-07 -8.06e-07 -2.95e-07 -8.53e-07   erg/cm2
      90%_error_hi   8.52e-08  8.87e-08  1.18e-07  8.32e-07  2.95e-07  8.74e-07   erg/cm2
Peak flux       PL   1.73e-03  2.23e-02  2.39e-01  2.20e+01  5.39e-01  2.21e+01   ph/cm2/s
      90%_error_low     N/A       N/A       N/A       N/A       N/A       N/A     ph/cm2/s
      90%_error_hi      N/A       N/A       N/A       N/A       N/A       N/A     ph/cm2/s

Fluence        CPL   2.06e-06  4.23e-06  6.05e-06  1.12e-05  1.64e-05  2.35e-05   erg/cm2
      90%_error_low -1.13e-07 -9.32e-08 -1.38e-07 -1.59e-06 -3.30e-07 -1.62e-06   erg/cm2
      90%_error_hi   1.15e-07  9.35e-08  1.39e-07  1.92e-06  3.30e-07  1.94e-06   erg/cm2
Peak flux      CPL   4.71e+00  6.85e+00  6.01e+00  4.26e+00  1.99e+01  2.18e+01   ph/cm2/s
      90%_error_low -3.24e-01 -1.97e-01 -1.79e-01 -5.07e-01 -5.14e-01 -7.50e-01   ph/cm2/s
      90%_error_hi   3.32e-01  1.97e-01  1.80e-01  5.87e-01  5.16e-01  7.98e-01   ph/cm2/s

======================================================================
Image
Pre-slew 15.0-350.0 keV image (Event data)
#   RAcent    DECcent   POSerr    Theta     Phi              Peak Cts       SNR   Name
  145.3214    66.7610   0.0037     4.2264    40.2147         5.4223765     51.611 TRIG_00585834

Foreground time interval of the image:
-38.304  11.925 (delta_t =  50.229 [sec])
Background time interval of the image:
-239.776 -38.304 (delta_t = 201.472 [sec])
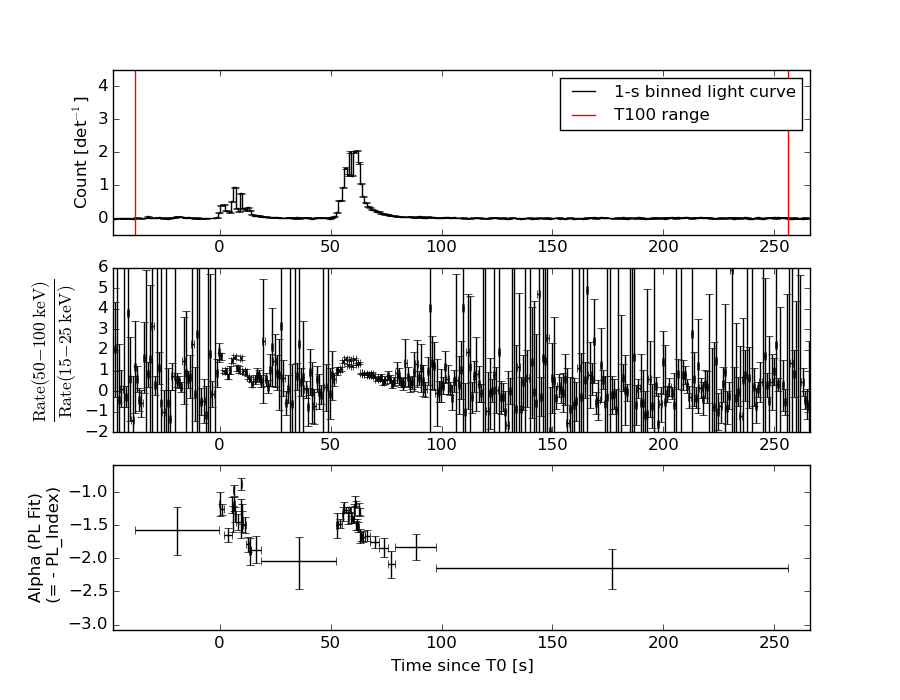
Light Curves
Note: The mask-weighted lightcurves have units of either count/det or counts/sec/det, where a det is 0.4 x 0.4 = 0.16 sq cm.
Full-time range; 1 s binning
Other quick-look light curves:
- 64 ms binning (zoomed)
- 16 ms binning (zoomed)
- 8 ms binning (zoomed)
- 2 ms binning (zoomed)
- SN=5 or 10 s binning (full-time range)
- Raw light curve
Spectra
- 64 ms binning (zoomed)
- 16 ms binning (zoomed)
- 8 ms binning (zoomed)
- 2 ms binning (zoomed)
- SN=5 or 10 s binning (full-time range)
- Raw light curve
Spectra
Notes:
- 1) The fitting includes the systematic errors.
- 2) When the burst includes telescope slew time periods, the fitting uses an average response file made from multiple 5-s response files through out the slew time plus single time preiod for the non-slew times, and weighted by the total counts in the corresponding time period using addrmf. An average response file is needed becuase a spectral fit using the pre-slew DRM will introduce some errors in both a spectral shape and a normalization if the PHA file contains a lot of the slew/post-slew time interval.
- 3) For fits to more complicated models (e.g. a power-law over a cutoff power-law), the BAT team has decided to require a chi-square improvement of more than 6 for each extra dof.
Time averaged spectrum fit using the average DRM
Power-law model
Time interval is from  -38.304 sec. to  256.060 sec.

Spectral model in power-law:
------------------------------------------------------------
Parameters  : value       lower 90%   higher 90%
Photon index: -1.50991     ( -0.0331718   0.0331952 )
Norm@50keV  : 6.02260E-03    ( -0.000103991   0.000103975 )
------------------------------------------------------------
#Fit statistic : Chi-Squared =          64.04 using 59 PHA bins.
# Reduced chi-squared =          1.123 for     57 degrees of freedom
# Null hypothesis probability =   2.432861e-01

Photon flux (15-150 keV)    in 294.4 sec: 0.753898 ( -0.01524  0.015294 ) ph/cm2/s
Energy fluence (15-150 keV)             : 1.67953e-05 ( -2.94789e-07  2.94912e-07 ) ergs/cm2
Cutoff power-law model
Time interval is from  -38.304 sec. to  256.060 sec.
Spectral model in the cutoff power-law:
------------------------------------------------------------
Parameters  : value       lower 90%   higher 90%
Photon index: -1.14172     ( -0.14124   0.145486 )
Epeak [keV] : 133.610      ( -22.1002 46.2994 )
Norm@50keV  : 8.70879E-03    ( -0.00112313   0.00132938 )
------------------------------------------------------------
#Fit statistic : Chi-Squared =          43.47 using 59 PHA bins.
# Reduced chi-squared =         0.7762 for     56 degrees of freedom
# Null hypothesis probability =   8.890975e-01

Photon flux (15-150 keV)    in 294.4 sec: 0.729611 ( -0.017378  0.017495 ) ph/cm2/s
Energy fluence (15-150 keV)             : 1.64047e-05 ( -3.30164e-07  3.29637e-07 ) ergs/cm2
1-s peak spectrum fit
Power-law model
Time interval is from   60.804 sec. to   61.804 sec.

Spectral model in power-law:
------------------------------------------------------------
Parameters  : value       lower 90%   higher 90%
Photon index: -1.27101     ( -0.0381467   0.0381589 )
Norm@50keV  : 0.174450    ( -0.0038987   0.00389813 )
------------------------------------------------------------
#Fit statistic : Chi-Squared =         100.76 using 59 PHA bins.
# Reduced chi-squared =         1.7677 for     57 degrees of freedom
# Null hypothesis probability =   3.143668e-04

Photon flux (15-150 keV)    in 1 sec: 0.539076 (    ) ph/cm2/s
Energy fluence (15-150 keV)             : 1.7366e-06 ( -4.09743e-08  4.10244e-08 ) ergs/cm2
Cutoff power-law model
Time interval is from   60.804 sec. to   61.804 sec.
Spectral model in the cutoff power-law:
------------------------------------------------------------
Parameters  : value       lower 90%   higher 90%
Photon index: -0.535721     ( -0.174347   0.180859 )
Epeak [keV] : 115.633      ( -12.0208 18.234 )
Norm@50keV  : 0.366541    ( -0.0577349   0.0711554 )
------------------------------------------------------------
#Fit statistic : Chi-Squared =          43.20 using 59 PHA bins.
# Reduced chi-squared =         0.7715 for     56 degrees of freedom
# Null hypothesis probability =   8.946276e-01

Photon flux (15-150 keV)    in 1 sec: 19.9472 ( -0.5142  0.5164 ) ph/cm2/s
Energy fluence (15-150 keV)             : 1.69029e-06 ( -4.32278e-08  4.31547e-08 ) ergs/cm2
Time-resolved spectra
Distribution
T90 vs. Hardness ratio plot
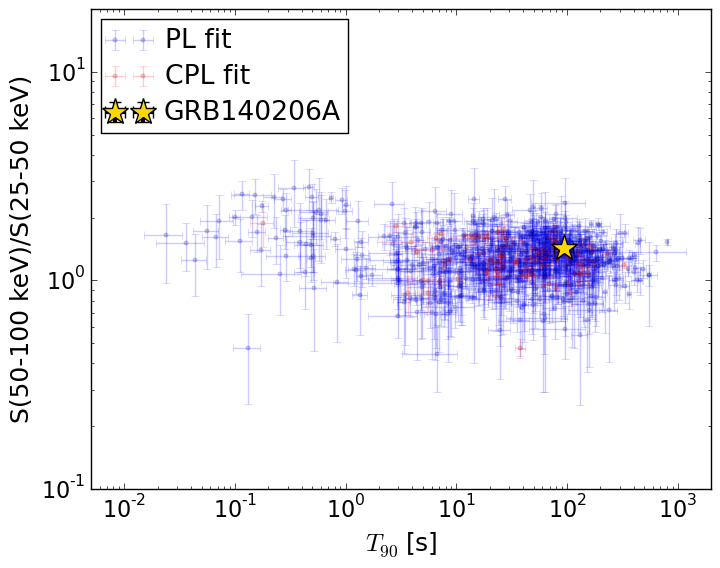
T90                                   = 94.188 sec.
Hardness ratio (energy fluence ratio) = 1.43126420724
S(15-50 keV) vs. S(50-150 keV) plot
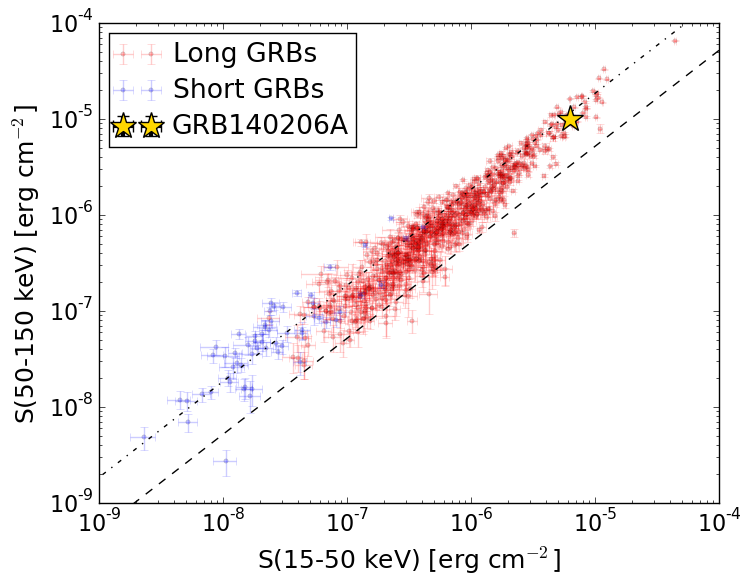
S(15-50 keV)  = 6.287703e-06
S(50-150 keV) = 1.0116982e-05
The dash-dotted line and the dashed line traces the fluences calculated from the Band function with Epeak = 15 and 150 keV, respectively. Both lines assume a canonical values of alpha = -1 and beta = -2.5.
Mask shadow pattern
IMX = 5.643112671702254E-02, IMY = -4.771279825754147E-02
Spacecraft aspect plot
Bright source in the pre-burst/pre-slew/post-slew images
Pre-burst image of 15-350 keV band
Time interval of the image:
-239.776000 -38.304000

# RAcent  DECcent POSerr Theta    Phi  PeakCts   SNR AngSep     Name
#  [deg]    [deg]    ['] [deg]  [deg]                   [']
139.9566  78.6544    3.2   9.2  -82.0   0.6840   3.6 ------	UNKNOWN
 31.5708  64.5379    2.3  36.2 -130.6   1.4812   5.0 ------	UNKNOWN
252.4609  51.3447    3.5  50.5  -39.2   2.6299   3.3 ------	UNKNOWN
Pre-slew background subtracted image of 15-350 keV band
Time interval of the image:
-38.304000 11.924600

# RAcent  DECcent POSerr Theta    Phi  PeakCts   SNR AngSep     Name
#  [deg]    [deg]    ['] [deg]  [deg]                   [']
 88.3776  32.9145    3.2  45.2  156.0   0.9394   3.6 ------	UNKNOWN
145.3215  66.7610    0.2   4.2   40.2   5.4218  51.6 ------	UNKNOWN
Post-slew image of 15-350 keV band
Time interval of the image:
32.524600 782.267900
840.224000 962.356400

# RAcent  DECcent POSerr Theta    Phi  PeakCts   SNR AngSep     Name
#  [deg]    [deg]    ['] [deg]  [deg]                   [']
170.9787  35.0961    2.5  35.0   45.3   5.5405   4.6 ------	UNKNOWN
145.3300  66.7543    0.4   0.0 -170.0  21.5634  32.5 ------	UNKNOWN
 44.5102  71.5639    2.9  32.0 -132.5   3.8499   4.0 ------	UNKNOWN
246.7766  48.5016    4.2  50.5  -39.2   7.5819   2.7 ------	UNKNOWN