Analysis Summary
Notes:
- 1) No attempt has been made to eliminate the non-significant decimal places.
- 2) This batgrbproduct analysis is done using the HEASARC data.
- 3) This batgrbproduct analysis is using the flight position for the mask-weighting calculation.
======================================================================
                  BAT GRB EVENT DATA PROCESSING REPORT
    Process Script Ver: batgrbproduct v2.46
    Process Start Time: Tue Mar  4 10:49:02 EST 2014
             Host Name: batevent1
   Current Working Dir: /local/data/batevent/batevent_reproc/trigger586289
======================================================================

  Trigger: 00586289      Segment: 000

  BAT Trigger Time: 413814195.456   [s; MET]
      Trigger Stop: 413814203.648   [s; MET]
               UTC: 2014-02-11T12:23:03.824220    [includes UTCF correction]
       Where From?: TDRSS position message

  BAT
    RA: 124.230447244537   Dec: 20.2436200277782  [deg; J2000]

     Catalogged Source?: NO
     Point Source?:      YES
     GRB Indicated?:     YES    [ by BAT flight software ]
     Image S/N Ratio:    10.26
     Image Trigger?:     NO
     Rate S/N Ratio:     13.228756555323  [ if not an image trigger ]
     Image S/N Ratio:    10.26

  Analysis Position:   [ source = BAT ]
    RA: 124.230447244537   Dec: 20.2436200277782  [deg; J2000]

  Refined Position:   [ source = BAT pre-slew burst ]
    RA: 124.232921756996   Dec: 20.235449467908  [deg; J2000]
        { 08h 16m 55.9s , +20d 14' 07.6" }
         +/- 1.39216314473229 [arcmin] (estimated 90% radius based on SNR)
         +/- 0.63613875310429 [arcmin] (formal 1-sigma fit error)
    SNR: 18.9603680045216

  Angular difference between the analysis and refined position is 0.509641 arcmin

  Partial Coding Fraction: 0.8125    [ including projection effects ]

  Duration
     T90: 109.531999945641 +/- 26.249381548809
        Measured from: -14.2759999632835
                   to: 95.255999982357     [s; relative to TRIGTIME]
     T50: 48.2399999499321 +/- 6.60201180093168
        Measured from: 1.04800003767014
                   to: 49.2879999876022     [s; relative to TRIGTIME]


  Fluence
     Peak Flux  (peak 1 second)
        Measured from: 0.904000043869019
                   to: 1.90400004386902     [s; relative to TRIGTIME]
     Total Fluence
        Measured from: -19.2399999499321
                   to: 121.808000028133     [s; relative to TRIGTIME]

             Band 1     Band 2     Band 3     Band 4
              15-25      25-50     50-100    100-350     keV
 Total     1.482067   1.372972   0.657660   0.117068
           0.082786   0.084315   0.073460   0.066047 [error]
 Peak      0.044365   0.028315   0.015222   0.005832
           0.007202   0.007511   0.006426   0.005673 [error]

     [ fluence units of on-axis counts / fully illuminated detector ]

======================================================================


====== Table of the duration information =============================

        Value   tstart    tstop
T100  141.048  -19.240  121.808
T90   109.532  -14.276   95.256
T50    48.240    1.048   49.288
Peak    1.000    0.904    1.904


====== Spectral Analysis Summary =====================================

Model      : spectral model: simple power-law (PL) and cutoff power-law (CPL)
Ph_index   : photon index: E^{Ph_index}
Ph_90err   : 90% error of the photon index
Epeak      : Epeak in keV
Epeak_90err: 90% error of Epeak
Norm       : normalization at 50 keV in both the PL model and CPL model
Nomr_90err : 90% error of the normalization
chi2       : Chi-Squared
dof        : degree of freedo

=== Time-averaged spectral analysis ===
(Best model with acceptable fit: PL)

Model Ph_index Ph_90err_low Ph_90err_hi  Epeak  Epeak_90err_low  Epeak_90err_hi  Norm       Nomr_90err_low    Norm_90err_hi    chi2    dof
PL      -2.071    -0.145      0.140       -           -               -         1.44e-03     -1.33e-04          1.30e-04      48.030   57
CPL     -1.676    -0.553      0.634       34.217     -28.549       -34.217      2.43e-03     -1.18e-03          3.15e-03      46.580   56


=== 1-s peak spectral analysis ===
(Best model with acceptable fit: PL)

Model Ph_index Ph_90err_low Ph_90err_hi  Epeak  Epeak_90err_low  Epeak_90err_hi  Norm       Nomr_90err_low    Norm_90err_hi    chi2    dof
PL      -2.321     -0.503     0.420       -           -               -         4.26e-03     -1.54e-03          1.54e-03      51.970   57
CPL     -0.851     -1.106     3.727       26.977      N/A           N/A         3.86e-02        N/A               N/A         50.140   56


=== Fluence/Peak Flux Summary ===

              Model    Band1     Band2     Band3     Band4     Band5     Total
                       15-25     25-50    50-100    100-350    15-150    15-350    keV
Fluence         PL   4.45e-07  5.78e-07  5.51e-07  9.30e-07  1.88e-06  2.50e-06   erg/cm2
      90%_error_low -4.59e-08 -4.10e-08 -6.98e-08 -2.16e-07 -1.57e-07 -2.96e-07   erg/cm2
      90%_error_hi   4.70e-08  4.10e-08  7.11e-08  2.58e-07  1.60e-07  3.28e-07   erg/cm2
Peak flux       PL   3.88e-01  2.42e-01  9.67e-02  5.22e-02  7.54e-01  7.79e-01   ph/cm2/s
      90%_error_low -1.05e-01 -6.17e-02 -4.25e-02 -3.27e-02 -1.73e-01 -1.83e-01   ph/cm2/s
      90%_error_hi   1.08e-01  6.00e-02  4.80e-02  5.64e-02  1.73e-01  1.85e-01   ph/cm2/s

Fluence        CPL   4.28e-07  6.04e-07  5.39e-07  4.58e-07  1.80e-06  2.03e-06   erg/cm2
      90%_error_low -5.24e-08 -5.35e-08 -7.96e-08 -2.75e-07 -1.87e-07 -3.46e-07   erg/cm2
      90%_error_hi   5.18e-08  5.50e-08  7.65e-08  7.51e-07  1.94e-07  7.85e-07   erg/cm2
Peak flux      CPL   3.74e-01  2.84e-01  7.62e-02  6.03e-03  7.39e-01  7.40e-01   ph/cm2/s
      90%_error_low -1.14e-01 -4.45e-02 -6.35e-02     N/A   -1.69e-01     N/A     ph/cm2/s
      90%_error_hi   1.14e-01  8.48e-02  6.00e-02     N/A    1.71e-01     N/A     ph/cm2/s

======================================================================
Image
Pre-slew 15.0-350.0 keV image (Event data)
#   RAcent    DECcent   POSerr    Theta     Phi              Peak Cts       SNR   Name
  124.2329    20.2354   0.0101    24.7213    20.0118         3.7022089     18.960 TRIG_00586289

Foreground time interval of the image:
-19.240 121.808 (delta_t = 141.048 [sec])
Background time interval of the image:
-439.255 -423.944 (delta_t =  15.311 [sec])
-239.456 -19.240 (delta_t = 220.216 [sec])
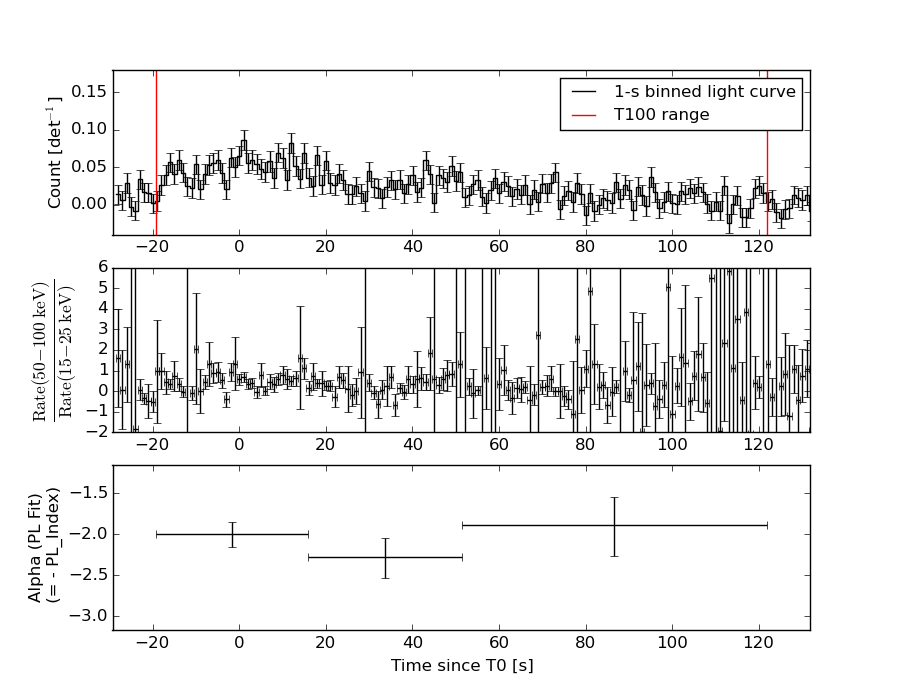
Light Curves
Note: The mask-weighted lightcurves have units of either count/det or counts/sec/det, where a det is 0.4 x 0.4 = 0.16 sq cm.
Full-time range; 1 s binning
Other quick-look light curves:
- 64 ms binning (zoomed)
- 16 ms binning (zoomed)
- 8 ms binning (zoomed)
- 2 ms binning (zoomed)
- SN=5 or 10 s binning (full-time range)
- Raw light curve
Spectra
- 64 ms binning (zoomed)
- 16 ms binning (zoomed)
- 8 ms binning (zoomed)
- 2 ms binning (zoomed)
- SN=5 or 10 s binning (full-time range)
- Raw light curve
Spectra
Notes:
- 1) The fitting includes the systematic errors.
- 2) When the burst includes telescope slew time periods, the fitting uses an average response file made from multiple 5-s response files through out the slew time plus single time preiod for the non-slew times, and weighted by the total counts in the corresponding time period using addrmf. An average response file is needed becuase a spectral fit using the pre-slew DRM will introduce some errors in both a spectral shape and a normalization if the PHA file contains a lot of the slew/post-slew time interval.
- 3) For fits to more complicated models (e.g. a power-law over a cutoff power-law), the BAT team has decided to require a chi-square improvement of more than 6 for each extra dof.
Time averaged spectrum fit using the average DRM
Power-law model
Time interval is from  -19.240 sec. to  121.808 sec.

Spectral model in power-law:
------------------------------------------------------------
Parameters  : value       lower 90%   higher 90%
Photon index: -2.07054     ( -0.145355   0.140061 )
Norm@50keV  : 1.44182E-03    ( -0.000132607   0.000130401 )
------------------------------------------------------------
#Fit statistic : Chi-Squared =          48.03 using 59 PHA bins.
# Reduced chi-squared =         0.8426 for     57 degrees of freedom
# Null hypothesis probability =   7.954841e-01

Photon flux (15-150 keV)    in 141 sec: 0.223612 ( -0.015925  0.015937 ) ph/cm2/s
Energy fluence (15-150 keV)             : 1.88417e-06 ( -1.57023e-07  1.59635e-07 ) ergs/cm2
Cutoff power-law model
Time interval is from  -19.240 sec. to  121.808 sec.
Spectral model in the cutoff power-law:
------------------------------------------------------------
Parameters  : value       lower 90%   higher 90%
Photon index: -1.67631     ( -0.552586   0.633827 )
Epeak [keV] : 34.2172      ( -28.549 -34.2173 )
Norm@50keV  : 2.42712E-03    ( -0.00118167   0.00314622 )
------------------------------------------------------------
#Fit statistic : Chi-Squared =          46.58 using 59 PHA bins.
# Reduced chi-squared =         0.8318 for     56 degrees of freedom
# Null hypothesis probability =   8.110583e-01

Photon flux (15-150 keV)    in 141 sec: 0.219201 ( -0.017047  0.017053 ) ph/cm2/s
Energy fluence (15-150 keV)             : 1.8029e-06 ( -1.86942e-07  1.94016e-07 ) ergs/cm2
1-s peak spectrum fit
Power-law model
Time interval is from    0.904 sec. to    1.904 sec.

Spectral model in power-law:
------------------------------------------------------------
Parameters  : value       lower 90%   higher 90%
Photon index: -2.3211     ( -0.503322   0.420349 )
Norm@50keV  : 4.26110E-03    ( -0.00154219   0.00153709 )
------------------------------------------------------------
#Fit statistic : Chi-Squared =          51.97 using 59 PHA bins.
# Reduced chi-squared =         0.9118 for     57 degrees of freedom
# Null hypothesis probability =   6.636302e-01

Photon flux (15-150 keV)    in 1 sec: 0.753583 ( -0.173075  0.173386 ) ph/cm2/s
Energy fluence (15-150 keV)             : 4.08893e-08 ( -1.18042e-08  1.27657e-08 ) ergs/cm2
Cutoff power-law model
Time interval is from    0.904 sec. to    1.904 sec.
Spectral model in the cutoff power-law:
------------------------------------------------------------
Parameters  : value       lower 90%   higher 90%
Photon index: -0.850757     ( -1.11012   3.72378 )
Epeak [keV] : 26.9773      (   )
Norm@50keV  : 3.85832E-02    (     )
------------------------------------------------------------
#Fit statistic : Chi-Squared =          50.14 using 59 PHA bins.
# Reduced chi-squared =         0.8954 for     56 degrees of freedom
# Null hypothesis probability =   6.951274e-01

Photon flux (15-150 keV)    in 1 sec: 0.738992 ( -0.168729  0.170893 ) ph/cm2/s
Energy fluence (15-150 keV)             : 0 ( 0  0 ) ergs/cm2
Time-resolved spectra
Distribution
T90 vs. Hardness ratio plot
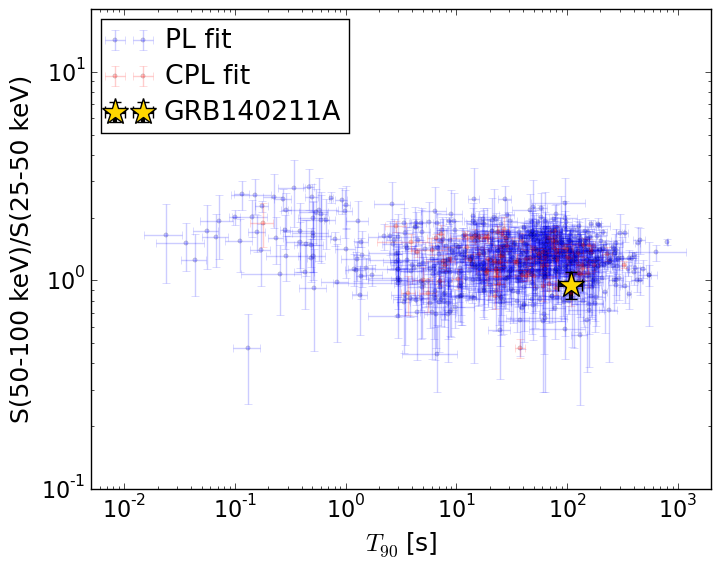
T90                                   = 109.532 sec.
Hardness ratio (energy fluence ratio) = 0.952313559132
S(15-50 keV) vs. S(50-150 keV) plot
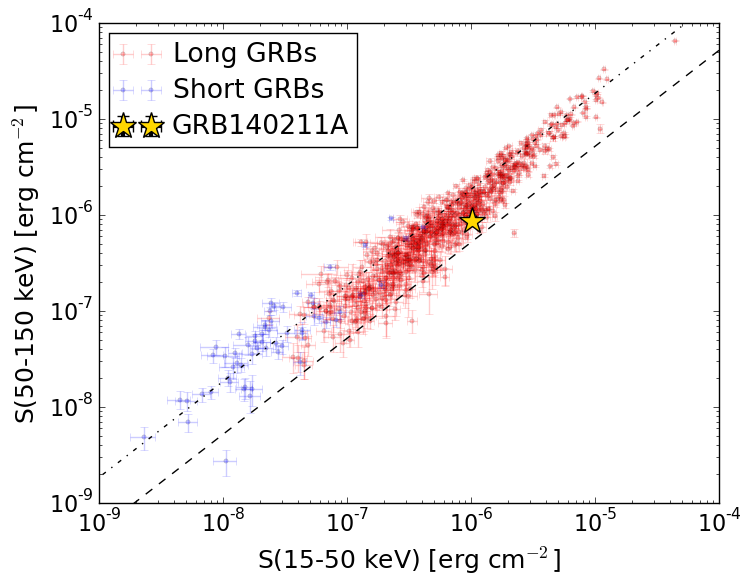
S(15-50 keV)  = 1.0233161e-06
S(50-150 keV) = 8.608721e-07
The dash-dotted line and the dashed line traces the fluences calculated from the Band function with Epeak = 15 and 150 keV, respectively. Both lines assume a canonical values of alpha = -1 and beta = -2.5.
Mask shadow pattern
IMX = 4.326020253788569E-01, IMY = -1.575552783659648E-01
Spacecraft aspect plot
Bright source in the pre-burst/pre-slew/post-slew images
Pre-burst image of 15-350 keV band
Time interval of the image:
-439.255400 -423.944400
-239.456000 -19.240000

# RAcent  DECcent POSerr Theta    Phi  PeakCts   SNR AngSep     Name
#  [deg]    [deg]    ['] [deg]  [deg]                   [']
 83.6136  22.0169    0.9  51.4  -27.0   6.4418  12.7    1.1	Crab
135.5305 -40.5557    0.9  37.0 -157.9   3.5211  13.4    0.1	Vela X-1
 97.1589 -34.8762    3.1  42.6 -109.9   2.9837   3.7 ------	UNKNOWN
 83.8420  -3.4463    2.4  44.9  -60.3   4.1175   4.8 ------	UNKNOWN
Pre-slew background subtracted image of 15-350 keV band
Time interval of the image:
-19.240000 121.808000

# RAcent  DECcent POSerr Theta    Phi  PeakCts   SNR AngSep     Name
#  [deg]    [deg]    ['] [deg]  [deg]                   [']
 83.6279  22.0512    5.4  51.4  -26.9   1.0678   2.1    2.2	Crab
135.4021 -40.5711    4.1  37.0 -157.8   0.6885   2.8    5.8	Vela X-1
124.2329  20.2355    0.6  24.7   20.0   3.7021  19.0 ------	UNKNOWN
 85.6352  -7.3368    2.7  43.1  -65.9   3.1271   4.3 ------	UNKNOWN
Post-slew image of 15-350 keV band
Time interval of the image:
605.744590 826.444600

# RAcent  DECcent POSerr Theta    Phi  PeakCts   SNR AngSep     Name
#  [deg]    [deg]    ['] [deg]  [deg]                   [']
245.0061 -15.6515    0.7  28.0   85.7   7.4330  16.8    1.7	Sco X-1
254.5389  35.4263   16.6  52.8  162.7  -0.8717  -0.7    6.4	Her X-1
256.0399 -37.7042    7.9  28.5   33.4  -0.4788  -1.5    8.8	4U 1700-377
256.5681 -36.5847    6.2  27.4   34.2   0.5927   1.9   11.6	GX 349+2
263.0388 -24.7369    1.7  14.8   45.0   1.7910   6.8    1.7	GX 1+4
264.9253 -44.5202    6.9  31.4   15.1   0.5092   1.7    8.9	4U 1735-44
268.4366  -1.5160    4.6  13.7  158.5   0.6248   2.5    5.6	SW J1753.5-0127
270.3180 -24.9290    5.5  11.4   19.8   0.5978   2.1    9.2	GX 5-1
270.3868 -25.6964    3.0  12.1   18.3   1.0852   3.8    5.3	GRS 1758-258
274.0428 -13.9290    2.8   0.2 -163.0   1.1019   4.2    6.8	GX 17+2
275.9527 -30.3822    3.5  16.4   -3.4   0.9074   3.3    1.7	H1820-303
284.8767 -24.9542   46.1  14.9  -39.0   0.0638   0.2    8.9	HT1900.1-2455
288.7793  10.9524    1.0  29.0 -146.3   3.1691  11.4    1.2	GRS 1915+105
299.6181  35.0962    7.2  54.8 -151.8   2.1818   1.6    6.5	Cyg X-1
263.0131 -33.7927    4.0  22.1   27.5   0.8264   2.9    2.8	GX 354-0
266.1372 -28.7580    1.6  16.4   27.8   1.7788   7.1 ------	UNKNOWN
267.1112   7.7646    2.5  22.9  164.8   1.1818   4.6 ------	UNKNOWN
266.9363  40.0509    2.9  54.5  176.0   4.4482   3.9 ------	UNKNOWN
274.1951  -0.1502    3.1  13.9 -176.6   0.9391   3.8 ------	UNKNOWN
281.8305 -58.6647    3.0  45.0   -3.1   1.7526   3.8 ------	UNKNOWN
290.8883  -2.5085    2.8  20.3 -120.6   1.1106   4.1 ------	UNKNOWN
	UNKNOWN