Analysis Summary
Notes:
- 1) No attempt has been made to eliminate the non-significant decimal places.
- 2) This batgrbproduct analysis is done using the HEASARC data.
- 3) This batgrbproduct analysis is using the flight position for the mask-weighting calculation.
======================================================================
                  BAT GRB EVENT DATA PROCESSING REPORT
    Process Script Ver: batgrbproduct v2.46
    Process Start Time: Tue Mar  4 17:03:09 EST 2014
             Host Name: batevent1
   Current Working Dir: /local/data/batevent/batevent_reproc/trigger586569
======================================================================

  Trigger: 00586569      Segment: 000

  BAT Trigger Time: 414012109.376   [s; MET]
      Trigger Stop: 414012110.4   [s; MET]
               UTC: 2014-02-13T19:21:37.734900    [includes UTCF correction]
       Where From?: TDRSS position message

  BAT
    RA: 105.21786344568   Dec: -73.1363397970065  [deg; J2000]

     Catalogged Source?: NO
     Point Source?:      YES
     GRB Indicated?:     YES    [ by BAT flight software ]
     Image S/N Ratio:    23.55
     Image Trigger?:     NO
     Rate S/N Ratio:     170.381923923872  [ if not an image trigger ]
     Image S/N Ratio:    23.55

  Analysis Position:   [ source = BAT ]
    RA: 105.21786344568   Dec: -73.1363397970065  [deg; J2000]

  Refined Position:   [ source = BAT pre-slew burst ]
    RA: 105.167478680074   Dec: -73.1360825101373  [deg; J2000]
        { 07h 00m 40.2s , -73d 08' 09.9" }
         +/- 0.656098267229017 [arcmin] (estimated 90% radius based on SNR)
         +/- 0.159212883108398 [arcmin] (formal 1-sigma fit error)
    SNR: 55.5381479597837

  Angular difference between the analysis and refined position is 0.877125 arcmin

  Partial Coding Fraction: 0.5    [ including projection effects ]

  Duration
     T90: 59.9319999217987 +/- 2.70702788769182
        Measured from: -4.47999995946884
                   to: 55.4519999623299     [s; relative to TRIGTIME]
     T50: 6.50399994850159 +/- 0.264967926877122
        Measured from: -1.93199998140335
                   to: 4.57199996709824     [s; relative to TRIGTIME]


  Fluence
     Peak Flux  (peak 1 second)
        Measured from: 0.555999994277954
                   to: 1.55599999427795     [s; relative to TRIGTIME]
     Total Fluence
        Measured from: -5.69999998807907
                   to: 82.0400000214577     [s; relative to TRIGTIME]

             Band 1     Band 2     Band 3     Band 4
              15-25      25-50     50-100    100-350     keV
 Total     6.587104   8.130835   4.926058   1.056461
           0.096895   0.102038   0.087214   0.067585 [error]
 Peak      0.818114   1.105866   0.691204   0.150200
           0.021365   0.024525   0.020731   0.011205 [error]

     [ fluence units of on-axis counts / fully illuminated detector ]

======================================================================


====== Table of the duration information =============================

        Value   tstart    tstop
T100   87.740   -5.700   82.040
T90    59.932   -4.480   55.452
T50     6.504   -1.932    4.572
Peak    1.000    0.556    1.556


====== Spectral Analysis Summary =====================================

Model      : spectral model: simple power-law (PL) and cutoff power-law (CPL)
Ph_index   : photon index: E^{Ph_index}
Ph_90err   : 90% error of the photon index
Epeak      : Epeak in keV
Epeak_90err: 90% error of Epeak
Norm       : normalization at 50 keV in both the PL model and CPL model
Nomr_90err : 90% error of the normalization
chi2       : Chi-Squared
dof        : degree of freedo

=== Time-averaged spectral analysis ===
(Best model with acceptable fit: PL)

Model Ph_index Ph_90err_low Ph_90err_hi  Epeak  Epeak_90err_low  Epeak_90err_hi  Norm       Nomr_90err_low    Norm_90err_hi    chi2    dof
PL      -1.797    -0.039      0.039       -           -               -         1.49e-02     -2.95e-04          2.95e-04      64.970   57
CPL     -1.616    -0.157      0.163      113.742     -29.899       317.466      1.80e-02     -2.71e-03          3.33e-03      61.100   56


=== 1-s peak spectral analysis ===
(Best model with acceptable fit: PL)

Model Ph_index Ph_90err_low Ph_90err_hi  Epeak  Epeak_90err_low  Epeak_90err_hi  Norm       Nomr_90err_low    Norm_90err_hi    chi2    dof
PL      -1.712     -0.053     0.052       -           -               -         1.77e-01     -5.19e-03          5.19e-03      61.170   57
CPL     -1.457     -0.204     0.213      111.323     -28.636       201.125      2.35e-01     -4.65e-02          6.14e-02      56.530   56


=== Fluence/Peak Flux Summary ===

              Model    Band1     Band2     Band3     Band4     Band5     Total
                       15-25     25-50    50-100    100-350    15-150    15-350    keV
Fluence         PL   2.20e-06  3.38e-06  3.88e-06  8.57e-06  1.20e-05  1.80e-05   erg/cm2
      90%_error_low -8.87e-08 -7.76e-08 -9.79e-08 -4.88e-07 -2.40e-07 -5.38e-07   erg/cm2
      90%_error_hi   9.03e-08  7.73e-08  9.78e-08  5.08e-07  2.40e-07  5.51e-07   erg/cm2
Peak flux       PL   8.91e+00  7.91e+00  4.83e+00  4.47e+00  2.36e+01  2.61e+01   ph/cm2/s
      90%_error_low -4.75e-01 -2.57e-01 -1.75e-01 -3.29e-01 -7.50e-01 -7.62e-01   ph/cm2/s
      90%_error_hi   4.85e-01  2.56e-01  1.75e-01  3.44e-01  7.52e-01  7.63e-01   ph/cm2/s

Fluence        CPL   2.11e-06  3.41e-06  3.93e-06  6.75e-06  1.18e-05  1.62e-05   erg/cm2
      90%_error_low -1.18e-07 -8.23e-08 -1.06e-07 -1.22e-06 -2.80e-07 -1.26e-06   erg/cm2
      90%_error_hi   1.20e-07  8.28e-08  1.07e-07  1.55e-06  2.79e-07  1.58e-06   erg/cm2
Peak flux      CPL   8.43e+00  8.05e+00  4.95e+00  3.43e+00  2.32e+01  2.49e+01   ph/cm2/s
      90%_error_low -5.94e-01 -2.82e-01 -1.99e-01 -6.45e-01 -8.02e-01 -1.09e+00   ph/cm2/s
      90%_error_hi   6.06e-01  2.84e-01  2.00e-01  8.17e-01  8.05e-01  1.19e+00   ph/cm2/s

======================================================================
Image
Pre-slew 15.0-350.0 keV image (Event data)
#   RAcent    DECcent   POSerr    Theta     Phi              Peak Cts       SNR   Name
  105.1675   -73.1361   0.0035    24.4015   104.8759        21.0133874     55.538 TRIG_00586569

Foreground time interval of the image:
 -5.700  82.040 (delta_t =  87.740 [sec])
Background time interval of the image:
-67.275  -5.700 (delta_t =  61.575 [sec])
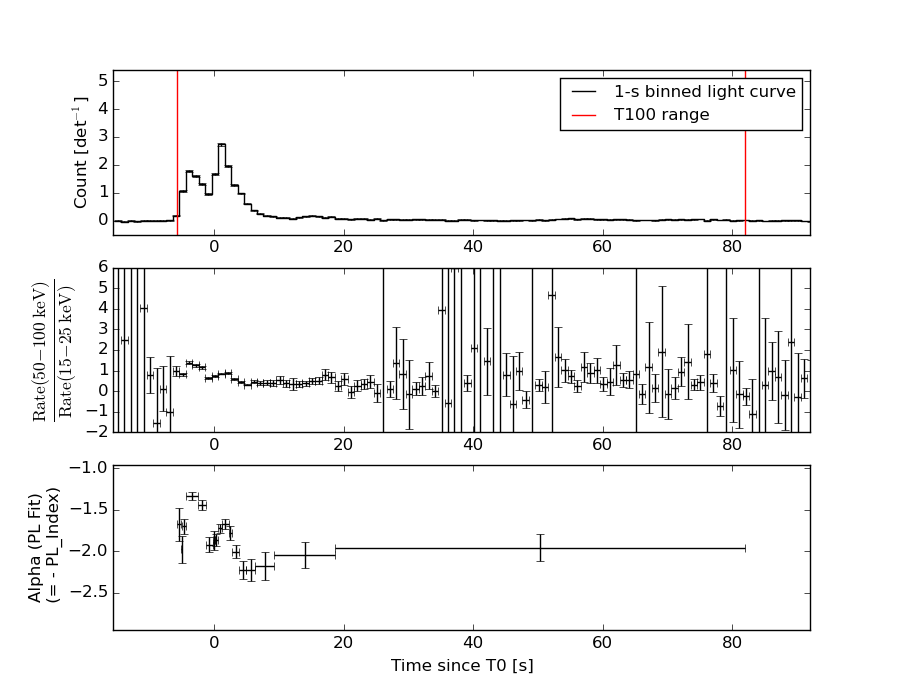
Light Curves
Note: The mask-weighted lightcurves have units of either count/det or counts/sec/det, where a det is 0.4 x 0.4 = 0.16 sq cm.
Full-time range; 1 s binning
Other quick-look light curves:
- 64 ms binning (zoomed)
- 16 ms binning (zoomed)
- 8 ms binning (zoomed)
- 2 ms binning (zoomed)
- SN=5 or 10 s binning (full-time range)
- Raw light curve
Spectra
- 64 ms binning (zoomed)
- 16 ms binning (zoomed)
- 8 ms binning (zoomed)
- 2 ms binning (zoomed)
- SN=5 or 10 s binning (full-time range)
- Raw light curve
Spectra
Notes:
- 1) The fitting includes the systematic errors.
- 2) When the burst includes telescope slew time periods, the fitting uses an average response file made from multiple 5-s response files through out the slew time plus single time preiod for the non-slew times, and weighted by the total counts in the corresponding time period using addrmf. An average response file is needed becuase a spectral fit using the pre-slew DRM will introduce some errors in both a spectral shape and a normalization if the PHA file contains a lot of the slew/post-slew time interval.
- 3) For fits to more complicated models (e.g. a power-law over a cutoff power-law), the BAT team has decided to require a chi-square improvement of more than 6 for each extra dof.
Time averaged spectrum fit using the average DRM
Power-law model
Time interval is from   -5.700 sec. to   82.040 sec.

Spectral model in power-law:
------------------------------------------------------------
Parameters  : value       lower 90%   higher 90%
Photon index: -1.79738     ( -0.0394351   0.0393692 )
Norm@50keV  : 1.48505E-02    ( -0.000294644   0.0002946 )
------------------------------------------------------------
#Fit statistic : Chi-Squared =          64.97 using 59 PHA bins.
# Reduced chi-squared =          1.140 for     57 degrees of freedom
# Null hypothesis probability =   2.188500e-01

Photon flux (15-150 keV)    in 87.74 sec: 2.04440 ( -0.04891  0.04916 ) ph/cm2/s
Energy fluence (15-150 keV)             : 1.19983e-05 ( -2.39886e-07  2.40215e-07 ) ergs/cm2
Cutoff power-law model
Time interval is from   -5.700 sec. to   82.040 sec.
Spectral model in the cutoff power-law:
------------------------------------------------------------
Parameters  : value       lower 90%   higher 90%
Photon index: -1.61639     ( -0.157101   0.162899 )
Epeak [keV] : 113.742      ( -29.8998 317.465 )
Norm@50keV  : 1.80099E-02    ( -0.00271027   0.00332512 )
------------------------------------------------------------
#Fit statistic : Chi-Squared =          61.10 using 59 PHA bins.
# Reduced chi-squared =          1.091 for     56 degrees of freedom
# Null hypothesis probability =   2.977420e-01

Photon flux (15-150 keV)    in 87.74 sec: 2.00907 ( -0.0568  0.05721 ) ph/cm2/s
Energy fluence (15-150 keV)             : 1.1829e-05 ( -2.80199e-07  2.79405e-07 ) ergs/cm2
1-s peak spectrum fit
Power-law model
Time interval is from    0.556 sec. to    1.556 sec.

Spectral model in power-law:
------------------------------------------------------------
Parameters  : value       lower 90%   higher 90%
Photon index: -1.71209     ( -0.0526716   0.0524164 )
Norm@50keV  : 0.176559    ( -0.0051899   0.00518523 )
------------------------------------------------------------
#Fit statistic : Chi-Squared =          61.17 using 59 PHA bins.
# Reduced chi-squared =          1.073 for     57 degrees of freedom
# Null hypothesis probability =   3.287060e-01

Photon flux (15-150 keV)    in 1 sec: 23.5500 ( -0.7503  0.7523 ) ph/cm2/s
Energy fluence (15-150 keV)             : 1.63347e-06 ( -4.94524e-08  4.9514e-08 ) ergs/cm2
Cutoff power-law model
Time interval is from    0.556 sec. to    1.556 sec.
Spectral model in the cutoff power-law:
------------------------------------------------------------
Parameters  : value       lower 90%   higher 90%
Photon index: -1.45679     ( -0.203607   0.213419 )
Epeak [keV] : 111.323      ( -28.638 201.123 )
Norm@50keV  : 0.234638    ( -0.0464723   0.0613897 )
------------------------------------------------------------
#Fit statistic : Chi-Squared =          56.53 using 59 PHA bins.
# Reduced chi-squared =          1.010 for     56 degrees of freedom
# Null hypothesis probability =   4.549127e-01

Photon flux (15-150 keV)    in 1 sec: 23.1706 ( -0.8022  0.805 ) ph/cm2/s
Energy fluence (15-150 keV)             : 1.60809e-06 ( -5.37716e-08  5.35235e-08 ) ergs/cm2
Time-resolved spectra
Distribution
T90 vs. Hardness ratio plot
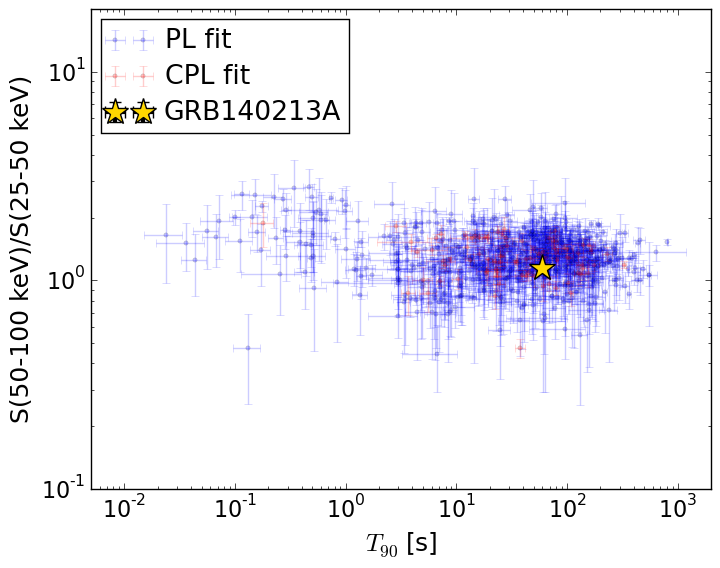
T90                                   = 59.932 sec.
Hardness ratio (energy fluence ratio) = 1.15080021143
S(15-50 keV) vs. S(50-150 keV) plot
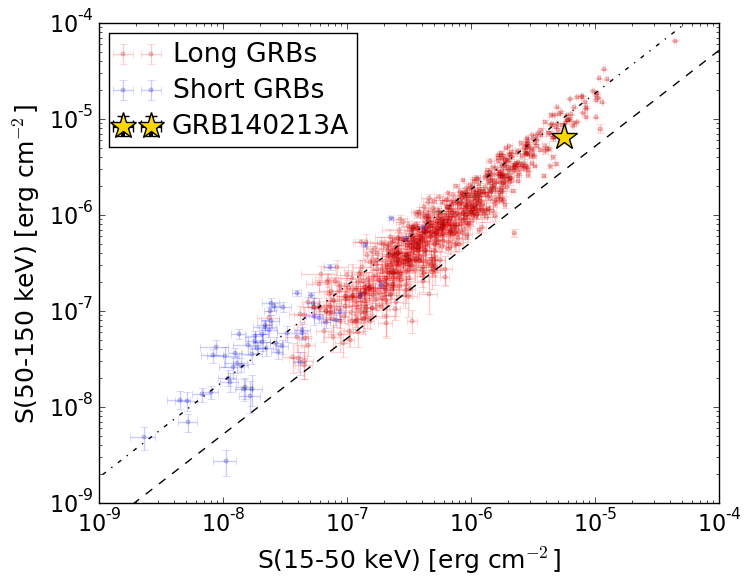
S(15-50 keV)  = 5.576147e-06
S(50-150 keV) = 6.422169e-06
The dash-dotted line and the dashed line traces the fluences calculated from the Band function with Epeak = 15 and 150 keV, respectively. Both lines assume a canonical values of alpha = -1 and beta = -2.5.
Mask shadow pattern
IMX = -1.164643576975149E-01, IMY = -4.384465034381541E-01
Spacecraft aspect plot
Bright source in the pre-burst/pre-slew/post-slew images
Pre-burst image of 15-350 keV band
Time interval of the image:
-67.275410 -5.700000

# RAcent  DECcent POSerr Theta    Phi  PeakCts   SNR AngSep     Name
#  [deg]    [deg]    ['] [deg]  [deg]                   [']
170.2920 -60.5724   43.1  46.0  133.4  -0.1200  -0.3    3.1	Cen X-3
187.0775 -62.7620    4.7  44.8  144.9   0.6957   2.4   11.6	GX 301-2
264.6981 -44.3630    4.1  53.5 -153.6   0.9115   2.8    5.6	4U 1735-44
101.2932 -53.6004    3.0  39.1   79.4   1.5036   3.9 ------	UNKNOWN
 44.1437 -64.2920    2.5  13.5   37.9   0.4294   4.6 ------	UNKNOWN
 34.8569 -34.1087    2.7  39.8   -3.3   0.5682   4.3 ------	UNKNOWN
Pre-slew background subtracted image of 15-350 keV band
Time interval of the image:
-5.700000 82.040000

# RAcent  DECcent POSerr Theta    Phi  PeakCts   SNR AngSep     Name
#  [deg]    [deg]    ['] [deg]  [deg]                   [']
169.8898 -60.5712    2.8  46.0  133.2  -5.9212  -4.1   12.9	Cen X-3
187.1001 -62.7527    4.0  44.8  144.9  -2.5718  -2.9   12.2	GX 301-2
264.7387 -44.4239    7.0  53.5 -153.6  -1.4305  -1.7    1.6	4U 1735-44
 65.4830 -40.2176    2.2  40.6   35.9   2.9792   5.3 ------	UNKNOWN
105.1675 -73.1361    0.2  24.4  104.9  21.0124  55.5 ------	UNKNOWN
 47.1374 -25.5373    2.8  50.2    9.2   2.7854   4.1 ------	UNKNOWN
341.0924 -51.4534    3.2  25.4  -83.0   1.0097   3.6 ------	UNKNOWN
Post-slew image of 15-350 keV band
Time interval of the image:
924.924600 962.620100

# RAcent  DECcent POSerr Theta    Phi  PeakCts   SNR AngSep     Name
#  [deg]    [deg]    ['] [deg]  [deg]                   [']
299.5115  35.2281    3.3  48.8  -39.5   0.7498   3.5    4.2	Cyg X-1
308.3125  40.9237    8.7  40.2  -43.2   0.1663   1.3    9.3	Cyg X-3
326.2731  38.3697   17.4  34.9  -64.6   0.0824   0.7    5.6	Cyg X-2
281.3119  32.6784    1.7  58.9  -25.2   2.9379   6.6 ------	UNKNOWN