Analysis Summary
Notes:
- 1) No attempt has been made to eliminate the non-significant decimal places.
- 2) This batgrbproduct analysis is done using the HEASARC data.
- 3) This batgrbproduct analysis is using the flight position for the mask-weighting calculation.
======================================================================
BAT GRB EVENT DATA PROCESSING REPORT
Process Script Ver: batgrbproduct v2.46
Process Start Time: Tue Mar 4 17:50:10 EST 2014
Host Name: batevent1
Current Working Dir: /local/data/batevent/batevent_reproc/trigger586680
======================================================================
Trigger: 00586680 Segment: 000
BAT Trigger Time: 414130041.92 [s; MET]
Trigger Stop: 414130042.944 [s; MET]
UTC: 2014-02-15T04:07:10.273340 [includes UTCF correction]
Where From?: TDRSS position message
BAT
RA: 104.135942727015 Dec: 41.7803604777544 [deg; J2000]
Catalogged Source?: NO
Point Source?: YES
GRB Indicated?: YES [ by BAT flight software ]
Image S/N Ratio: 12.63
Image Trigger?: NO
Rate S/N Ratio: 58.6344608570762 [ if not an image trigger ]
Image S/N Ratio: 12.63
Analysis Position: [ source = BAT ]
RA: 104.135942727015 Dec: 41.7803604777544 [deg; J2000]
Refined Position: [ source = BAT pre-slew burst ]
RA: 104.131035415408 Dec: 41.7870063941203 [deg; J2000]
{ 06h 56m 31.4s , +41d 47' 13.2" }
+/- 1.11504409092991 [arcmin] (estimated 90% radius based on SNR)
+/- 0.474871573306095 [arcmin] (formal 1-sigma fit error)
SNR: 26.0350443650305
Angular difference between the analysis and refined position is 0.455202 arcmin
Partial Coding Fraction: 0.1542969 [ including projection effects ]
Duration
T90: 25.6320000290871 +/- 5.64181532462767
Measured from: -0.304000020027161
to: 25.3280000090599 [s; relative to TRIGTIME]
T50: 8.78400003910065 +/- 0.840875777678445
Measured from: 1.74399995803833
to: 10.527999997139 [s; relative to TRIGTIME]
Fluence
Peak Flux (peak 1 second)
Measured from: -0.0120000243186951
to: 0.987999975681305 [s; relative to TRIGTIME]
Total Fluence
Measured from: -1.47200000286102
to: 35.8560000061989 [s; relative to TRIGTIME]
Band 1 Band 2 Band 3 Band 4
15-25 25-50 50-100 100-350 keV
Total 1.647878 3.072008 3.280514 1.500788
0.108582 0.122947 0.118974 0.099929 [error]
Peak 0.140164 0.302490 0.404192 0.142714
0.021060 0.027269 0.030847 0.023297 [error]
[ fluence units of on-axis counts / fully illuminated detector ]
======================================================================
====== Table of the duration information =============================
Value tstart tstop
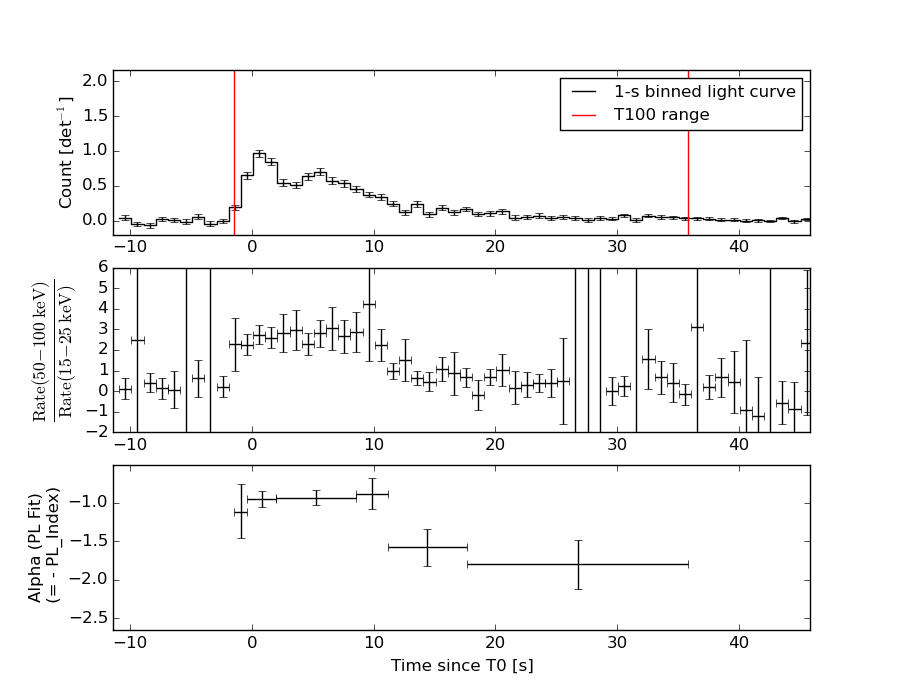
T100 37.328 -1.472 35.856
T90 25.632 -0.304 25.328
T50 8.784 1.744 10.528
Peak 1.000 -0.012 0.988
====== Spectral Analysis Summary =====================================
Model : spectral model: simple power-law (PL) and cutoff power-law (CPL)
Ph_index : photon index: E^{Ph_index}
Ph_90err : 90% error of the photon index
Epeak : Epeak in keV
Epeak_90err: 90% error of Epeak
Norm : normalization at 50 keV in both the PL model and CPL model
Nomr_90err : 90% error of the normalization
chi2 : Chi-Squared
dof : degree of freedo
=== Time-averaged spectral analysis ===
(Best model with acceptable fit: PL)
Model Ph_index Ph_90err_low Ph_90err_hi Epeak Epeak_90err_low Epeak_90err_hi Norm Nomr_90err_low Norm_90err_hi chi2 dof
PL -1.099 -0.072 0.073 - - - 1.86e-02 -7.65e-04 7.63e-04 53.370 57
CPL -1.098 -0.069 0.135 9999.360 -9999.360 -9999.360 1.86e-02 -7.44e-04 3.36e-03 53.440 56
=== 1-s peak spectral analysis ===
(Best model with acceptable fit: N/A)
Model Ph_index Ph_90err_low Ph_90err_hi Epeak Epeak_90err_low Epeak_90err_hi Norm Nomr_90err_low Norm_90err_hi chi2 dof
PL -0.928 -0.145 0.148 - - - 6.88e-02 -6.21e-03 6.18e-03 56.570 57
CPL -0.613 -0.384 0.610 268.666 -268.666 -268.666 9.38e-02 -2.95e-02 7.17e-02 55.600 56
=== Fluence/Peak Flux Summary ===
Model Band1 Band2 Band3 Band4 Band5 Total
15-25 25-50 50-100 100-350 15-150 15-350 keV
Fluence PL 6.08e-07 1.43e-06 2.67e-06 1.20e-05 7.24e-06 1.67e-05 erg/cm2
90%_error_low -5.28e-08 -7.48e-08 -1.15e-07 -1.18e-06 -3.00e-07 -1.22e-06 erg/cm2
90%_error_hi 5.46e-08 7.43e-08 1.14e-07 1.26e-06 3.00e-07 1.30e-06 erg/cm2
Peak flux PL 4.75e-04 5.86e-03 6.68e-02 5.81e+00 3.00e-01 5.81e+00 ph/cm2/s
90%_error_low -4.07e-05 -4.79e-04 -5.94e-03 -5.19e-01 -2.43e-02 -4.60e-01 ph/cm2/s
90%_error_hi 3.02e-04 3.26e-03 3.01e-02 1.79e+00 1.28e-01 1.92e+00 ph/cm2/s
Fluence CPL 6.22e-07 1.43e-06 2.64e-06 1.31e-05 7.27e-06 1.80e-05 erg/cm2
90%_error_low N/A -8.76e-08 N/A N/A -3.25e-07 N/A erg/cm2
90%_error_hi N/A 9.14e-08 N/A N/A 2.75e-07 N/A erg/cm2
Peak flux CPL 1.50e+00 2.36e+00 2.56e+00 3.58e+00 7.85e+00 1.00e+01 ph/cm2/s
90%_error_low -3.63e-01 -2.77e-01 -3.00e-01 -1.34e+00 -7.21e-01 -1.53e+00 ph/cm2/s
90%_error_hi 3.64e-01 2.80e-01 3.10e-01 1.50e+00 7.21e-01 1.74e+00 ph/cm2/s
======================================================================
Image
Pre-slew 15.0-350.0 keV image (Event data)
#   RAcent    DECcent   POSerr    Theta     Phi              Peak Cts       SNR   Name
  104.1310    41.7870   0.0074    46.6078   155.6688         8.1692408     26.035 TRIG_00586680

Foreground time interval of the image:
 -1.472  14.981 (delta_t =  16.453 [sec])
Background time interval of the image:
-239.920  -1.472 (delta_t = 238.448 [sec])
Light Curves
Note: The mask-weighted lightcurves have units of either count/det or counts/sec/det, where a det is 0.4 x 0.4 = 0.16 sq cm.
Full-time range; 1 s binning
Other quick-look light curves:
- 64 ms binning (zoomed)
- 16 ms binning (zoomed)
- 8 ms binning (zoomed)
- 2 ms binning (zoomed)
- SN=5 or 10 s binning (full-time range)
- Raw light curve
Spectra
- 64 ms binning (zoomed)
- 16 ms binning (zoomed)
- 8 ms binning (zoomed)
- 2 ms binning (zoomed)
- SN=5 or 10 s binning (full-time range)
- Raw light curve
Spectra
Notes:
- 1) The fitting includes the systematic errors.
- 2) When the burst includes telescope slew time periods, the fitting uses an average response file made from multiple 5-s response files through out the slew time plus single time preiod for the non-slew times, and weighted by the total counts in the corresponding time period using addrmf. An average response file is needed becuase a spectral fit using the pre-slew DRM will introduce some errors in both a spectral shape and a normalization if the PHA file contains a lot of the slew/post-slew time interval.
- 3) For fits to more complicated models (e.g. a power-law over a cutoff power-law), the BAT team has decided to require a chi-square improvement of more than 6 for each extra dof.
Time averaged spectrum fit using the average DRM
Power-law model

Time interval is from   -1.472 sec. to   35.856 sec.

Spectral model in power-law:
------------------------------------------------------------
Parameters  : value       lower 90%   higher 90%
Photon index: -1.09874     ( -0.0724535   0.0733605 )
Norm@50keV  : 1.85515E-02    ( -0.000765325   0.000762752 )
------------------------------------------------------------
#Fit statistic : Chi-Squared =          53.37 using 59 PHA bins.
# Reduced chi-squared =         0.9363 for     57 degrees of freedom
# Null hypothesis probability =   6.120264e-01

Photon flux (15-150 keV)    in 37.33 sec: 2.15158 ( -0.09374  0.09409 ) ph/cm2/s
Energy fluence (15-150 keV)             : 7.24415e-06 ( -2.99536e-07  2.99962e-07 ) ergs/cm2
Cutoff power-law model
Time interval is from   -1.472 sec. to   35.856 sec.
Spectral model in the cutoff power-law:
------------------------------------------------------------
Parameters  : value       lower 90%   higher 90%
Photon index: -1.09762     ( -0.0700096   0.134159 )
Epeak [keV] : 9999.36      ( -9999.36 -9999.36 )
Norm@50keV  : 1.86361E-02    ( -0.000766376   0.00333993 )
------------------------------------------------------------
#Fit statistic : Chi-Squared =          53.44 using 59 PHA bins.
# Reduced chi-squared =         0.9542 for     56 degrees of freedom
# Null hypothesis probability =   5.724894e-01

Photon flux (15-150 keV)    in 37.33 sec: 2.16302 (    ) ph/cm2/s
Energy fluence (15-150 keV)             : 7.26789e-06 ( -3.24557e-07  2.74831e-07 ) ergs/cm2
1-s peak spectrum fit
Power-law model
Time interval is from   -0.012 sec. to    0.988 sec.

Spectral model in power-law:
------------------------------------------------------------
Parameters  : value       lower 90%   higher 90%
Photon index: -0.927833     ( -0.144951   0.147941 )
Norm@50keV  : 6.87777E-02    ( -0.00620998   0.00618281 )
------------------------------------------------------------
#Fit statistic : Chi-Squared =          56.57 using 59 PHA bins.
# Reduced chi-squared =         0.9924 for     57 degrees of freedom
# Null hypothesis probability =   4.912277e-01

Photon flux (15-150 keV)    in 1 sec: 0.299959 0.224172 4.01286E-02 (    ) ph/cm2/s
Energy fluence (15-150 keV)             : 7.63748e-07 ( -7.21559e-08  7.23939e-08 ) ergs/cm2
Cutoff power-law model
Time interval is from   -0.012 sec. to    0.988 sec.
Spectral model in the cutoff power-law:
------------------------------------------------------------
Parameters  : value       lower 90%   higher 90%
Photon index: -0.612723     ( -0.384724   0.609685 )
Epeak [keV] : 268.666      ( -268.456 -268.456 )
Norm@50keV  : 9.38383E-02    ( -0.0295047   0.071717 )
------------------------------------------------------------
#Fit statistic : Chi-Squared =          55.60 using 59 PHA bins.
# Reduced chi-squared =         0.9928 for     56 degrees of freedom
# Null hypothesis probability =   4.901357e-01

Photon flux (15-150 keV)    in 1 sec: 7.85098 ( -0.72062  0.72144 ) ph/cm2/s
Energy fluence (15-150 keV)             : 7.61798e-07 ( -7.33994e-08  7.3228e-08 ) ergs/cm2
Time-resolved spectra
Distribution
T90 vs. Hardness ratio plot
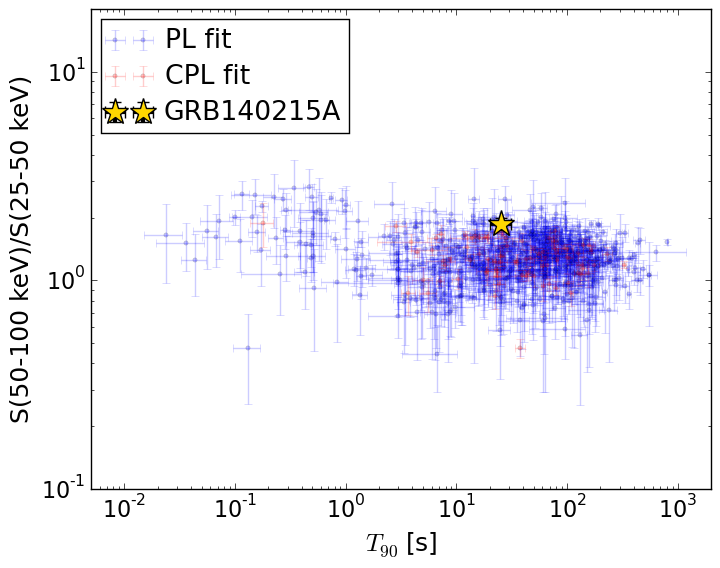
T90                                   = 25.632 sec.
Hardness ratio (energy fluence ratio) = 1.86771221261
S(15-50 keV) vs. S(50-150 keV) plot
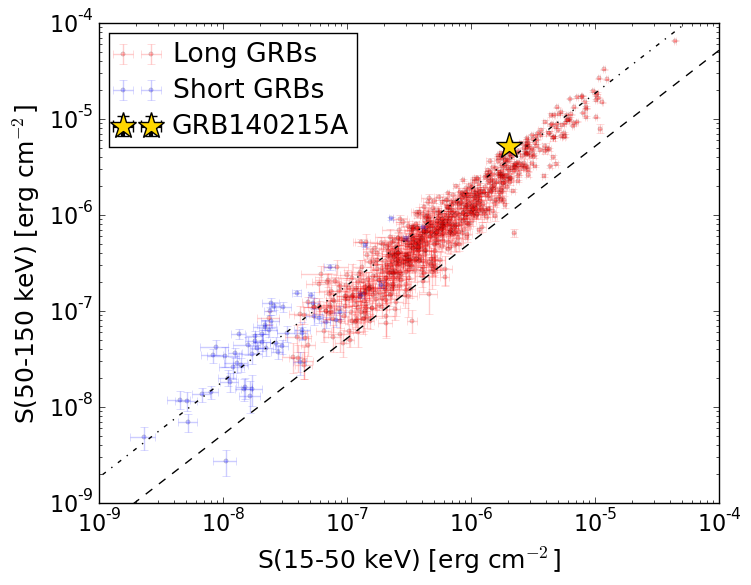
S(15-50 keV)  = 2.037909e-06
S(50-150 keV) = 5.206354e-06
The dash-dotted line and the dashed line traces the fluences calculated from the Band function with Epeak = 15 and 150 keV, respectively. Both lines assume a canonical values of alpha = -1 and beta = -2.5.
Mask shadow pattern
IMX = -9.638086568856981E-01, IMY = -4.358076949019931E-01
Spacecraft aspect plot
Bright source in the pre-burst/pre-slew/post-slew images
Pre-burst image of 15-350 keV band
Time interval of the image:
-239.920000 -1.472000

# RAcent  DECcent POSerr Theta    Phi  PeakCts   SNR AngSep     Name
#  [deg]    [deg]    ['] [deg]  [deg]                   [']
109.7571  30.5394    2.8  46.5  138.9   4.2201   4.1 ------	UNKNOWN
161.1466  15.7843    3.4  22.8   53.1   0.8800   3.4 ------	UNKNOWN
194.8764  -7.4623    2.3  52.9    3.9   3.3668   5.0 ------	UNKNOWN
223.8811  84.9261    3.0  49.2 -133.7   4.2546   3.9 ------	UNKNOWN
223.5093  71.1299    2.5  43.8 -116.2   5.1476   4.7 ------	UNKNOWN
227.0921  79.6737    2.7  47.4 -127.1   4.5142   4.2 ------	UNKNOWN
Pre-slew background subtracted image of 15-350 keV band
Time interval of the image:
-1.472000 14.980600

# RAcent  DECcent POSerr Theta    Phi  PeakCts   SNR AngSep     Name
#  [deg]    [deg]    ['] [deg]  [deg]                   [']
182.0660 -13.4622    3.2  53.8   21.3   1.2487   3.6 ------	UNKNOWN
104.1310  41.7870    0.4  46.6  155.7   8.1688  26.0 ------	UNKNOWN
198.9244  31.1300    2.7  27.7  -44.6   0.3223   4.3 ------	UNKNOWN
222.3708  52.2314    2.4  40.9  -88.3   1.0883   4.8 ------	UNKNOWN
Post-slew image of 15-350 keV band
Time interval of the image:
105.380610 962.150000

# RAcent  DECcent POSerr Theta    Phi  PeakCts   SNR AngSep     Name
#  [deg]    [deg]    ['] [deg]  [deg]                   [']
 83.6251  22.0158    0.2  26.2 -156.1  21.0297  46.5    0.5	Crab
136.1658  12.7169    3.9  40.2  103.4   5.0623   3.0 ------	UNKNOWN
 95.5681  -2.9443    2.7  45.4  168.6   3.9109   4.2 ------	UNKNOWN
 43.1048  55.0778    2.6  41.1  -73.1   7.2845   4.4 ------	UNKNOWN
 51.8114  31.1664    3.4  42.7 -110.3   5.8578   3.4 ------	UNKNOWN