Analysis Summary
Notes:
- 1) No attempt has been made to eliminate the non-significant decimal places.
- 2) This batgrbproduct analysis is done using the HEASARC data.
- 3) This batgrbproduct analysis is using the flight position for the mask-weighting calculation.
======================================================================
                  BAT GRB EVENT DATA PROCESSING REPORT
    Process Script Ver: batgrbproduct v2.46
    Process Start Time: Sun Oct  5 00:42:23 EDT 2014
             Host Name: batevent1
   Current Working Dir: /local/data/batevent/batevent_reproc/trigger589590
======================================================================

  Trigger: 00589590      Segment: 000

  BAT Trigger Time: 415380301.184   [s; MET]
      Trigger Stop: 415380303.232   [s; MET]
               UTC: 2014-03-01T15:24:49.478320    [includes UTCF correction]
       Where From?: TDRSS position message

  BAT
    RA: 69.5477390229074   Dec: -34.2830325341323  [deg; J2000]

     Catalogged Source?: NO
     Point Source?:      YES
     GRB Indicated?:     YES    [ by BAT flight software ]
     Image S/N Ratio:    7.65
     Image Trigger?:     NO
     Rate S/N Ratio:     10.3923048454133  [ if not an image trigger ]
     Image S/N Ratio:    7.65

  Analysis Position:   [ source = BAT ]
    RA: 69.5477390229074   Dec: -34.2830325341323  [deg; J2000]

  Refined Position:   [ source = BAT pre-slew burst ]
    RA: 69.5267468553023   Dec: -34.2365775751088  [deg; J2000]
        { 04h 38m 06.4s , -34d 14' 11.7" }
         +/- 1.90843045212268 [arcmin] (estimated 90% radius based on SNR)
         +/- 0.877800840558079 [arcmin] (formal 1-sigma fit error)
    SNR: 12.0823714480052

  Angular difference between the analysis and refined position is 2.975348 arcmin

  Partial Coding Fraction: 0.6640625    [ including projection effects ]

  Duration
     T90: 27.8039999008179 +/- 8.38857342278462
        Measured from: -7.7039999961853
                   to: 20.0999999046326     [s; relative to TRIGTIME]
     T50: 16.6399999260902 +/- 6.69979853960238
        Measured from: -4.24000000953674
                   to: 12.3999999165535     [s; relative to TRIGTIME]


  Fluence
     Peak Flux  (peak 1 second)
        Measured from: 0.107999980449677
                   to: 1.10799998044968     [s; relative to TRIGTIME]
     Total Fluence
        Measured from: -19.2200000286102
                   to: 21.5799999833107     [s; relative to TRIGTIME]

             Band 1     Band 2     Band 3     Band 4
              15-25      25-50     50-100    100-350     keV
 Total     0.321096   0.341028   0.169276   0.079474
           0.040278   0.041764   0.036117   0.030574 [error]
 Peak      0.032470   0.030294   0.028857   0.015491
           0.006649   0.007117   0.006044   0.004975 [error]

     [ fluence units of on-axis counts / fully illuminated detector ]

======================================================================


====== Table of the duration information =============================

        Value   tstart    tstop
T100   40.800  -19.220   21.580
T90    27.804   -7.704   20.100
T50    16.640   -4.240   12.400
Peak    1.000    0.108    1.108


====== Spectral Analysis Summary =====================================

Model      : spectral model: simple power-law (PL) and cutoff power-law (CPL)
Ph_index   : photon index: E^{Ph_index}
Ph_90err   : 90% error of the photon index
Epeak      : Epeak in keV
Epeak_90err: 90% error of Epeak
Norm       : normalization at 50 keV in both the PL model and CPL model
Nomr_90err : 90% error of the normalization
chi2       : Chi-Squared
dof        : degree of freedo

=== Time-averaged spectral analysis ===
(Best model with acceptable fit: PL)

Model Ph_index Ph_90err_low Ph_90err_hi  Epeak  Epeak_90err_low  Epeak_90err_hi  Norm       Nomr_90err_low    Norm_90err_hi    chi2    dof
PL      -1.963    -0.286      0.266       -           -               -         1.21e-03     -2.25e-04          2.17e-04      62.000   57
CPL     -2.027    -0.339      0.762       14.883      N/A           N/A         1.10e-03        N/A               N/A         61.850   56


=== 1-s peak spectral analysis ===
(Best model with acceptable fit: PL)

Model Ph_index Ph_90err_low Ph_90err_hi  Epeak  Epeak_90err_low  Epeak_90err_hi  Norm       Nomr_90err_low    Norm_90err_hi    chi2    dof
PL      -1.444     -0.367     0.365       -           -               -         6.59e-03     -1.34e-03          1.32e-03      68.620   57
CPL     -1.448     -0.362     0.918     9999.350    -9999.350      -9999.350      6.61e-03     -1.34e-03          9.20e-03      68.620   56


=== Fluence/Peak Flux Summary ===

              Model    Band1     Band2     Band3     Band4     Band5     Total
                       15-25     25-50    50-100    100-350    15-150    15-350    keV
Fluence         PL   9.77e-08  1.36e-07  1.39e-07  2.60e-07  4.55e-07  6.33e-07   erg/cm2
      90%_error_low -1.90e-08 -1.91e-08 -3.46e-08 -1.09e-07 -7.86e-08 -1.52e-07   erg/cm2
      90%_error_hi   1.94e-08  1.90e-08  3.57e-08  1.54e-07  8.11e-08  1.87e-07   erg/cm2
Peak flux       PL   2.57e-01  2.68e-01  1.97e-01  2.33e-01  8.12e-01  9.55e-01   ph/cm2/s
      90%_error_low -8.73e-02 -5.84e-02 -5.10e-02 -1.05e-01 -1.63e-01 -1.92e-01   ph/cm2/s
      90%_error_hi   9.51e-02  5.67e-02  4.95e-02  1.48e-01  1.63e-01  1.95e-01   ph/cm2/s

Fluence        CPL   9.57e-08  1.26e-07  1.22e-07  2.93e-07  4.25e-07  6.21e-07   erg/cm2
      90%_error_low    N/A    -5.36e-08 -8.63e-08    N/A       N/A    -9.47e-08   erg/cm2
      90%_error_hi     N/A     2.91e-08  3.51e-08    N/A       N/A     9.21e-08   erg/cm2
Peak flux      CPL   2.65e-01  2.68e-01  1.93e-01  2.59e-01  8.18e-01  9.91e-01   ph/cm2/s
      90%_error_low     N/A       N/A   -1.93e-01     N/A       N/A   -3.15e-01   ph/cm2/s
      90%_error_hi      N/A       N/A    -1.03e-03     N/A       N/A    2.00e-01   ph/cm2/s

======================================================================
Image
Pre-slew 15.0-350.0 keV image (Event data)
#   RAcent    DECcent   POSerr    Theta     Phi              Peak Cts       SNR   Name
   69.5267   -34.2366   0.0159    25.0445  -111.0085         0.9745536     12.082 TRIG_00589590

Foreground time interval of the image:
-19.220  21.580 (delta_t =  40.800 [sec])
Background time interval of the image:
-239.184 -19.220 (delta_t = 219.964 [sec])
Light Curves
Note: The mask-weighted lightcurves have units of either count/det or counts/sec/det, where a det is 0.4 x 0.4 = 0.16 sq cm.
Full-time range; 1 s binning
Other quick-look light curves:
- 64 ms binning (zoomed)
- 16 ms binning (zoomed)
- 8 ms binning (zoomed)
- 2 ms binning (zoomed)
- SN=5 or 10 s binning (full-time range)
- Raw light curve
Spectra
- 64 ms binning (zoomed)
- 16 ms binning (zoomed)
- 8 ms binning (zoomed)
- 2 ms binning (zoomed)
- SN=5 or 10 s binning (full-time range)
- Raw light curve
Spectra
Notes:
- 1) The fitting includes the systematic errors.
- 2) When the burst includes telescope slew time periods, the fitting uses an average response file made from multiple 5-s response files through out the slew time plus single time preiod for the non-slew times, and weighted by the total counts in the corresponding time period using addrmf. An average response file is needed becuase a spectral fit using the pre-slew DRM will introduce some errors in both a spectral shape and a normalization if the PHA file contains a lot of the slew/post-slew time interval.
- 3) For fits to more complicated models (e.g. a power-law over a cutoff power-law), the BAT team has decided to require a chi-square improvement of more than 6 for each extra dof.
Time averaged spectrum fit using the average DRM
Power-law model
Time interval is from  -19.220 sec. to   21.580 sec.

Spectral model in power-law:
------------------------------------------------------------
Parameters  : value       lower 90%   higher 90%
Photon index: -1.96338     ( -0.28568   0.266457 )
Norm@50keV  : 1.21152E-03    ( -0.000225034   0.000216574 )
------------------------------------------------------------
#Fit statistic : Chi-Squared =          62.00 using 59 PHA bins.
# Reduced chi-squared =          1.088 for     57 degrees of freedom
# Null hypothesis probability =   3.023788e-01

Photon flux (15-150 keV)    in 40.8 sec: 0.178748 ( -0.024734  0.024735 ) ph/cm2/s
Energy fluence (15-150 keV)             : 4.55165e-07 ( -7.85996e-08  8.1101e-08 ) ergs/cm2
Cutoff power-law model
Time interval is from  -19.220 sec. to   21.580 sec.
Spectral model in the cutoff power-law:
------------------------------------------------------------
Parameters  : value       lower 90%   higher 90%
Photon index: -2.24563     ( -0.120181   0.980594 )
Epeak [keV] : 97.3658      (   )
Norm@50keV  : 8.53519E-04    (     )
------------------------------------------------------------
#Fit statistic : Chi-Squared =          61.60 using 59 PHA bins.
# Reduced chi-squared =          1.100 for     56 degrees of freedom
# Null hypothesis probability =   2.827235e-01

Photon flux (15-150 keV)    in 40.8 sec: 0.155598 ( -0.037856  0.036987 ) ph/cm2/s
Energy fluence (15-150 keV)             : 4.25058e-07 ( 0  0 ) ergs/cm2
1-s peak spectrum fit
Power-law model
Time interval is from    0.108 sec. to    1.108 sec.

Spectral model in power-law:
------------------------------------------------------------
Parameters  : value       lower 90%   higher 90%
Photon index: -1.44393     ( -0.367229   0.364911 )
Norm@50keV  : 6.59497E-03    ( -0.00134221   0.00132437 )
------------------------------------------------------------
#Fit statistic : Chi-Squared =          68.62 using 59 PHA bins.
# Reduced chi-squared =          1.204 for     57 degrees of freedom
# Null hypothesis probability =   1.393263e-01

Photon flux (15-150 keV)    in 1 sec: 0.811538 ( -0.162885  0.163318 ) ph/cm2/s
Energy fluence (15-150 keV)             : 6.31888e-08 ( -1.41748e-08  1.43698e-08 ) ergs/cm2
Cutoff power-law model
Time interval is from    0.108 sec. to    1.108 sec.
Spectral model in the cutoff power-law:
------------------------------------------------------------
Parameters  : value       lower 90%   higher 90%
Photon index: -1.4484     ( -0.362964   0.917966 )
Epeak [keV] : 9999.35      ( -9999.36 -9999.36 )
Norm@50keV  : 6.60936E-03    ( -0.00134184   0.00919874 )
------------------------------------------------------------
#Fit statistic : Chi-Squared =          68.62 using 59 PHA bins.
# Reduced chi-squared =          1.225 for     56 degrees of freedom
# Null hypothesis probability =   1.199264e-01

Photon flux (15-150 keV)    in 1 sec: 0.817631 (    ) ph/cm2/s
Energy fluence (15-150 keV)             : 3.46131e-08 ( -1.71601e-08  1.14826e-08 ) ergs/cm2
Time-resolved spectra
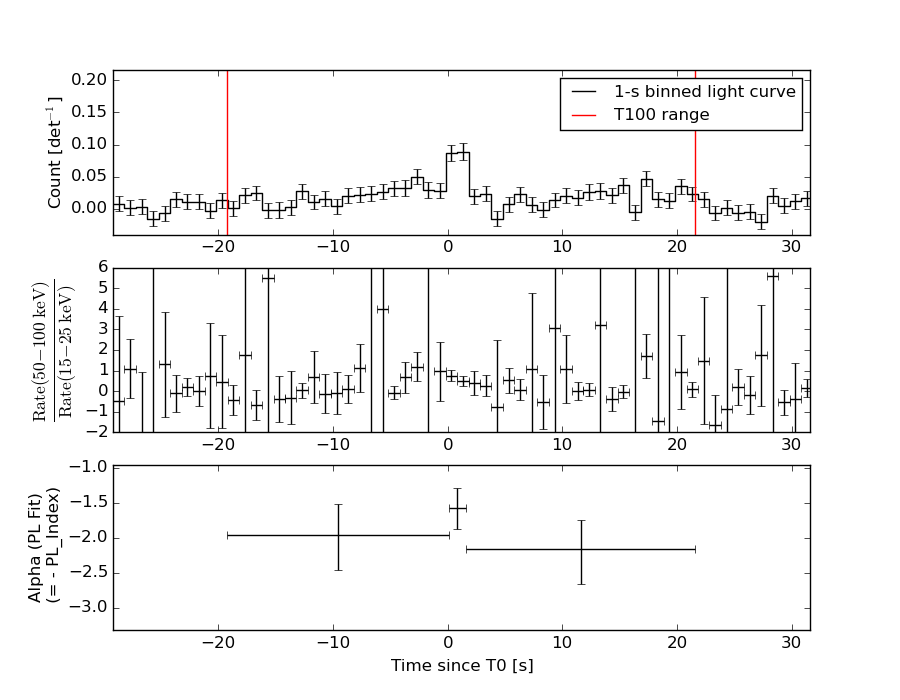
Distribution
T90 vs. Hardness ratio plot
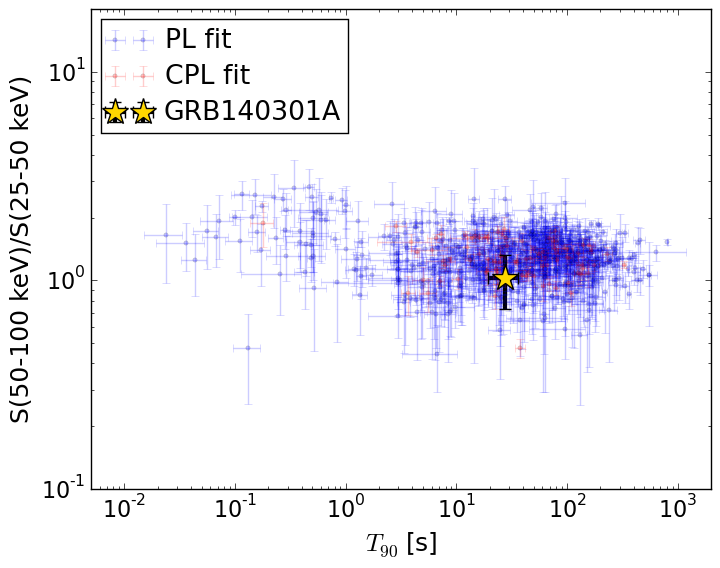
T90                                   = 27.804 sec.
Hardness ratio (energy fluence ratio) = 1.0257459074
S(15-50 keV) vs. S(50-150 keV) plot
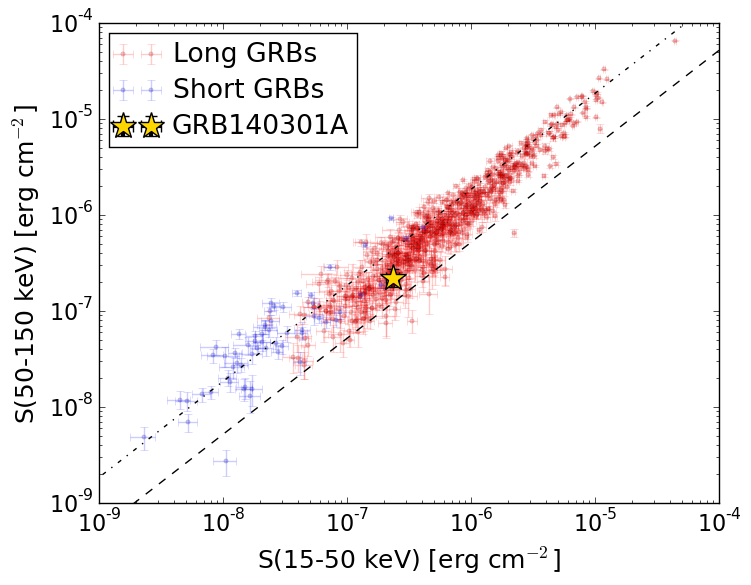
S(15-50 keV)  = 2.3321183e-07
S(50-150 keV) = 2.2195814e-07
The dash-dotted line and the dashed line traces the fluences calculated from the Band function with Epeak = 15 and 150 keV, respectively. Both lines assume a canonical values of alpha = -1 and beta = -2.5.
Mask shadow pattern
IMX = -1.675136405898341E-01, IMY = 4.361939605809910E-01
Spacecraft aspect plot
Bright source in the pre-burst/pre-slew/post-slew images
Pre-burst image of 15-350 keV band
Time interval of the image:
-239.184000 -19.220000

# RAcent  DECcent POSerr Theta    Phi  PeakCts   SNR AngSep     Name
#  [deg]    [deg]    ['] [deg]  [deg]                   [']
 83.6372  22.0162    0.5  45.0    0.2   8.6418  24.8    0.2	Crab
135.5754 -40.5428    1.8  39.5  142.2   2.4046   6.3    2.3	Vela X-1
100.0901 -24.4641    2.5   6.0  132.0   0.7327   4.6 ------	UNKNOWN
124.7709 -78.5532    2.8  58.5 -172.6   4.3775   4.1 ------	UNKNOWN
 47.1385 -47.0177    2.2  45.4 -121.2   4.0206   5.1 ------	UNKNOWN
Pre-slew background subtracted image of 15-350 keV band
Time interval of the image:
-19.220000 21.580000

# RAcent  DECcent POSerr Theta    Phi  PeakCts   SNR AngSep     Name
#  [deg]    [deg]    ['] [deg]  [deg]                   [']
 83.6368  22.0211    8.7  45.0    0.2   0.1785   1.3    0.4	Crab
135.5171 -40.7534   11.6  39.6  142.5   0.1427   1.0   11.9	Vela X-1
115.0971 -34.9275    2.3  22.5  144.5   0.3641   5.0 ------	UNKNOWN
 84.3850  30.2170    2.6  52.8    3.5   1.1409   4.4 ------	UNKNOWN
 69.5267 -34.2365    1.0  25.0 -111.0   0.9747  12.1 ------	UNKNOWN
Post-slew image of 15-350 keV band
Time interval of the image:
75.516590 907.016600

# RAcent  DECcent POSerr Theta    Phi  PeakCts   SNR AngSep     Name
#  [deg]    [deg]    ['] [deg]  [deg]                   [']
 98.1158 -18.6702    3.3  29.8   70.5   2.7736   3.4 ------	UNKNOWN
 67.5008  20.9457    2.7  55.2    2.4  11.1527   4.3 ------	UNKNOWN
141.7608 -89.5769    3.1  55.6 -175.7   6.6870   3.8 ------	UNKNOWN
 43.0195 -52.4468    2.7  26.2 -137.1   2.2158   4.3 ------	UNKNOWN
318.6112 -81.7235    4.0  59.0 -166.2   9.6763   2.9 ------	UNKNOWN
 10.5235 -47.8633    2.7  45.4 -121.2   9.8477   4.3 ------	UNKNOWN