Analysis Summary
Notes:
- 1) No attempt has been made to eliminate the non-significant decimal places.
- 2) This batgrbproduct analysis is done using the HEASARC data.
- 3) This batgrbproduct analysis is using the flight position for the mask-weighting calculation.
======================================================================
                  BAT GRB EVENT DATA PROCESSING REPORT
    Process Script Ver: batgrbproduct v2.46
    Process Start Time: Sun Oct  5 00:32:23 EDT 2014
             Host Name: batevent1
   Current Working Dir: /local/data/batevent/batevent_reproc/trigger590206
======================================================================

  Trigger: 00590206      Segment: 000

  BAT Trigger Time: 415632162.816   [s; MET]
      Trigger Stop: 415632163.84   [s; MET]
               UTC: 2014-03-04T13:22:31.098380    [includes UTCF correction]
       Where From?: TDRSS position message

  BAT
    RA: 30.668351779433   Dec: 33.4854421100489  [deg; J2000]

     Catalogged Source?: NO
     Point Source?:      YES
     GRB Indicated?:     YES    [ by BAT flight software ]
     Image S/N Ratio:    11.82
     Image Trigger?:     NO
     Rate S/N Ratio:     25.6124969497314  [ if not an image trigger ]
     Image S/N Ratio:    11.82

  Analysis Position:   [ source = BAT ]
    RA: 30.668351779433   Dec: 33.4854421100489  [deg; J2000]

  Refined Position:   [ source = BAT pre-slew burst ]
    RA: 30.6491075134771   Dec: 33.4730437755863  [deg; J2000]
        { 02h 02m 35.8s , +33d 28' 23.0" }
         +/- 0.937426353573178 [arcmin] (estimated 90% radius based on SNR)
         +/- 0.251066162817423 [arcmin] (formal 1-sigma fit error)
    SNR: 33.3586259394506

  Angular difference between the analysis and refined position is 1.216928 arcmin

  Partial Coding Fraction: 0.7421875    [ including projection effects ]

  Duration
     T90: 14.7839999198914 +/- 1.40137072052854
        Measured from: -2.19199997186661
                   to: 12.5919999480247     [s; relative to TRIGTIME]
     T50: 9.17599999904633 +/- 0.885889390557535
        Measured from: 1.05199998617172
                   to: 10.227999985218     [s; relative to TRIGTIME]


  Fluence
     Peak Flux  (peak 1 second)
        Measured from: 10.2240000367165
                   to: 11.2240000367165     [s; relative to TRIGTIME]
     Total Fluence
        Measured from: -3.81999999284744
                   to: 13.4920000433922     [s; relative to TRIGTIME]

             Band 1     Band 2     Band 3     Band 4
              15-25      25-50     50-100    100-350     keV
 Total     0.392416   0.594232   0.546225   0.125853
           0.024927   0.026358   0.023220   0.018628 [error]
 Peak      0.043113   0.081142   0.067755   0.019520
           0.006310   0.007061   0.006326   0.004764 [error]

     [ fluence units of on-axis counts / fully illuminated detector ]

======================================================================


====== Table of the duration information =============================

        Value   tstart    tstop
T100   17.312   -3.820   13.492
T90    14.784   -2.192   12.592
T50     9.176    1.052   10.228
Peak    1.000   10.224   11.224


====== Spectral Analysis Summary =====================================

Model      : spectral model: simple power-law (PL) and cutoff power-law (CPL)
Ph_index   : photon index: E^{Ph_index}
Ph_90err   : 90% error of the photon index
Epeak      : Epeak in keV
Epeak_90err: 90% error of Epeak
Norm       : normalization at 50 keV in both the PL model and CPL model
Nomr_90err : 90% error of the normalization
chi2       : Chi-Squared
dof        : degree of freedo

=== Time-averaged spectral analysis ===
(Best model with acceptable fit: CPL)

Model Ph_index Ph_90err_low Ph_90err_hi  Epeak  Epeak_90err_low  Epeak_90err_hi  Norm       Nomr_90err_low    Norm_90err_hi    chi2    dof
PL      -1.299    -0.081      0.081       -           -               -         6.59e-03     -3.04e-04          3.04e-04      60.750   57
CPL     -0.847    -0.319      0.345      136.898     -37.365       180.945      1.08e-02     -3.10e-03          4.74e-03      54.700   56


=== 1-s peak spectral analysis ===
(Best model with acceptable fit: PL)

Model Ph_index Ph_90err_low Ph_90err_hi  Epeak  Epeak_90err_low  Epeak_90err_hi  Norm       Nomr_90err_low    Norm_90err_hi    chi2    dof
PL      -1.246     -0.158     0.160       -           -               -         1.41e-02     -1.35e-03          1.35e-03      49.050   57
CPL     -0.791     -0.523     0.668      139.663     -55.582      -139.663      2.35e-02     -1.01e-02          2.53e-02      47.270   56


=== Fluence/Peak Flux Summary ===

              Model    Band1     Band2     Band3     Band4     Band5     Total
                       15-25     25-50    50-100    100-350    15-150    15-350    keV
Fluence         PL   1.21e-07  2.51e-07  4.08e-07  1.49e-06  1.13e-06  2.27e-06   erg/cm2
      90%_error_low -1.05e-08 -1.33e-08 -2.26e-08 -1.76e-07 -5.66e-08 -1.91e-07   erg/cm2
      90%_error_hi   1.08e-08  1.32e-08  2.25e-08  1.91e-07  5.68e-08  2.04e-07   erg/cm2
Peak flux       PL   4.54e-01  5.31e-01  4.48e-01  6.39e-01  1.66e+00  2.07e+00   ph/cm2/s
      90%_error_low -7.69e-02 -5.80e-02 -5.06e-02 -1.37e-01 -1.62e-01 -2.08e-01   ph/cm2/s
      90%_error_hi   8.08e-02  5.73e-02  5.02e-02  1.58e-01  1.63e-01  2.11e-01   ph/cm2/s

Fluence        CPL   1.10e-07  2.60e-07  4.24e-07  8.14e-07  1.10e-06  1.61e-06   erg/cm2
      90%_error_low -1.28e-08 -1.51e-08 -2.56e-08 -2.62e-07 -6.16e-08 -2.65e-07   erg/cm2
      90%_error_hi   1.30e-08  1.53e-08  2.59e-08  4.18e-07  6.14e-08  4.14e-07   erg/cm2
Peak flux      CPL   4.15e-01  5.54e-01  4.70e-01  3.93e-01  1.64e+00  1.83e+00   ph/cm2/s
      90%_error_low -9.03e-02 -6.59e-02 -5.84e-02 -1.80e-01 -1.65e-01 -2.48e-01   ph/cm2/s
      90%_error_hi   9.35e-02  6.79e-02  5.98e-02  3.05e-01  1.65e-01  3.53e-01   ph/cm2/s

======================================================================
Image
Pre-slew 15.0-350.0 keV image (Event data)
#   RAcent    DECcent   POSerr    Theta     Phi              Peak Cts       SNR   Name
   30.6491    33.4730   0.0058    25.1962   152.4356         1.6941248     33.359 TRIG_00590206

Foreground time interval of the image:
 -3.820  13.492 (delta_t =  17.312 [sec])
Background time interval of the image:
-119.816  -3.820 (delta_t = 115.996 [sec])
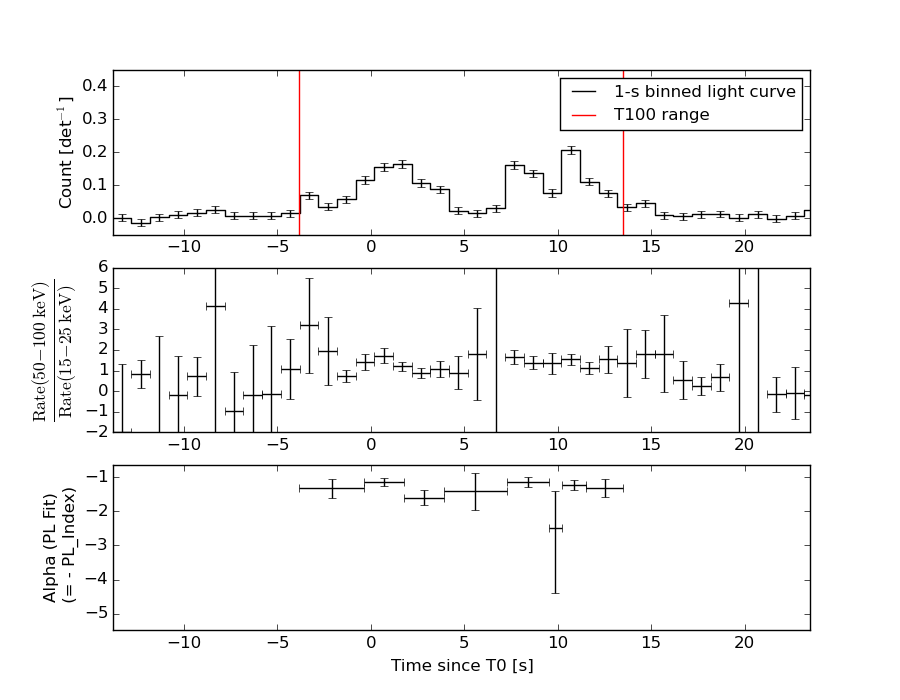
Light Curves
Note: The mask-weighted lightcurves have units of either count/det or counts/sec/det, where a det is 0.4 x 0.4 = 0.16 sq cm.
Full-time range; 1 s binning
Other quick-look light curves:
- 64 ms binning (zoomed)
- 16 ms binning (zoomed)
- 8 ms binning (zoomed)
- 2 ms binning (zoomed)
- SN=5 or 10 s binning (full-time range)
- Raw light curve
Spectra
- 64 ms binning (zoomed)
- 16 ms binning (zoomed)
- 8 ms binning (zoomed)
- 2 ms binning (zoomed)
- SN=5 or 10 s binning (full-time range)
- Raw light curve
Spectra
Notes:
- 1) The fitting includes the systematic errors.
- 2) When the burst includes telescope slew time periods, the fitting uses an average response file made from multiple 5-s response files through out the slew time plus single time preiod for the non-slew times, and weighted by the total counts in the corresponding time period using addrmf. An average response file is needed becuase a spectral fit using the pre-slew DRM will introduce some errors in both a spectral shape and a normalization if the PHA file contains a lot of the slew/post-slew time interval.
- 3) For fits to more complicated models (e.g. a power-law over a cutoff power-law), the BAT team has decided to require a chi-square improvement of more than 6 for each extra dof.
Time averaged spectrum fit using the average DRM
Power-law model
Time interval is from   -3.820 sec. to   13.492 sec.

Spectral model in power-law:
------------------------------------------------------------
Parameters  : value       lower 90%   higher 90%
Photon index: -1.29945     ( -0.0806595   0.0811009 )
Norm@50keV  : 6.59113E-03    ( -0.000304275   0.000304275 )
------------------------------------------------------------
#Fit statistic : Chi-Squared =          60.75 using 59 PHA bins.
# Reduced chi-squared =          1.066 for     57 degrees of freedom
# Null hypothesis probability =   3.422755e-01

Photon flux (15-150 keV)    in 17.31 sec: 0.786268 ( -0.038042  0.038105 ) ph/cm2/s
Energy fluence (15-150 keV)             : 1.12773e-06 ( -5.6617e-08  5.67984e-08 ) ergs/cm2
Cutoff power-law model
Time interval is from   -3.820 sec. to   13.492 sec.
Spectral model in the cutoff power-law:
------------------------------------------------------------
Parameters  : value       lower 90%   higher 90%
Photon index: -0.846809     ( -0.319228   0.344956 )
Epeak [keV] : 136.898      ( -37.3648 180.946 )
Norm@50keV  : 1.07937E-02    ( -0.00309845   0.00474308 )
------------------------------------------------------------
#Fit statistic : Chi-Squared =          54.70 using 59 PHA bins.
# Reduced chi-squared =         0.9767 for     56 degrees of freedom
# Null hypothesis probability =   5.243072e-01

Photon flux (15-150 keV)    in 17.31 sec: 0.769056 ( -0.039865  0.039887 ) ph/cm2/s
Energy fluence (15-150 keV)             : 1.09574e-06 ( -6.15802e-08  6.13778e-08 ) ergs/cm2
1-s peak spectrum fit
Power-law model
Time interval is from   10.224 sec. to   11.224 sec.

Spectral model in power-law:
------------------------------------------------------------
Parameters  : value       lower 90%   higher 90%
Photon index: -1.24562     ( -0.158425   0.159683 )
Norm@50keV  : 1.40582E-02    ( -0.00135001   0.00134911 )
------------------------------------------------------------
#Fit statistic : Chi-Squared =          49.05 using 59 PHA bins.
# Reduced chi-squared =         0.8605 for     57 degrees of freedom
# Null hypothesis probability =   7.640455e-01

Photon flux (15-150 keV)    in 1 sec: 1.66154 ( -0.16247  0.16265 ) ph/cm2/s
Energy fluence (15-150 keV)             : 1.40874e-07 ( -1.50191e-08  1.51136e-08 ) ergs/cm2
Cutoff power-law model
Time interval is from   10.224 sec. to   11.224 sec.
Spectral model in the cutoff power-law:
------------------------------------------------------------
Parameters  : value       lower 90%   higher 90%
Photon index: -0.791392     ( -0.523307   0.668279 )
Epeak [keV] : 139.663      ( -55.5806 -139.662 )
Norm@50keV  : 2.34852E-02    ( -0.0101381   0.0252811 )
------------------------------------------------------------
#Fit statistic : Chi-Squared =          47.27 using 59 PHA bins.
# Reduced chi-squared =         0.8442 for     56 degrees of freedom
# Null hypothesis probability =   7.903997e-01

Photon flux (15-150 keV)    in 1 sec: 1.63839 ( -0.16544  0.16542 ) ph/cm2/s
Energy fluence (15-150 keV)             : 1.37151e-07 ( -1.61218e-08  1.5993e-08 ) ergs/cm2
Time-resolved spectra
Distribution
T90 vs. Hardness ratio plot
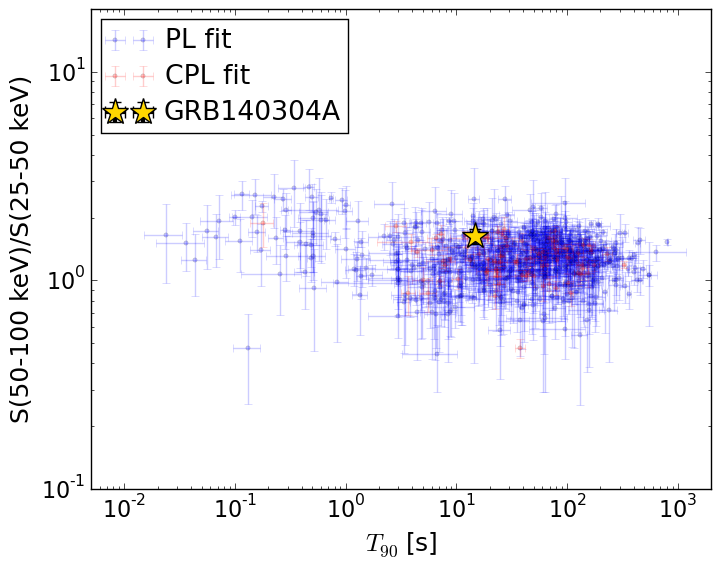
T90                                   = 14.784 sec.
Hardness ratio (energy fluence ratio) = 1.62764673084
S(15-50 keV) vs. S(50-150 keV) plot
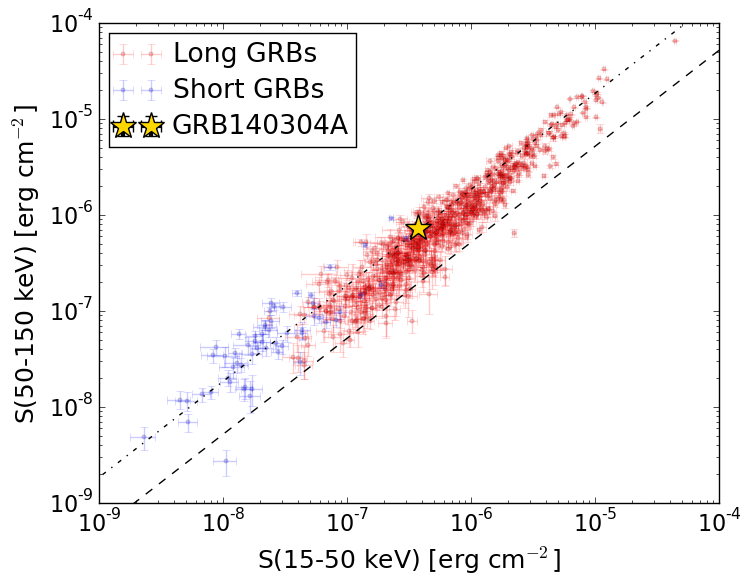
S(15-50 keV)  = 3.701435e-07
S(50-150 keV) = 7.255937e-07
The dash-dotted line and the dashed line traces the fluences calculated from the Band function with Epeak = 15 and 150 keV, respectively. Both lines assume a canonical values of alpha = -1 and beta = -2.5.
Mask shadow pattern
IMX = -4.170783172532118E-01, IMY = -2.177135988342982E-01
Spacecraft aspect plot
Bright source in the pre-burst/pre-slew/post-slew images
Pre-burst image of 15-350 keV band
Time interval of the image:
-119.816000 -3.820000

# RAcent  DECcent POSerr Theta    Phi  PeakCts   SNR AngSep     Name
#  [deg]    [deg]    ['] [deg]  [deg]                   [']
299.5864  35.2025    1.3  47.3  -17.1   1.8870   9.0    0.2	Cyg X-1
308.1225  40.9790    1.6  39.1  -12.5   1.1014   7.2    1.7	Cyg X-3
326.3378  38.1911   10.6  26.1  -24.1  -0.1163  -1.1   11.1	Cyg X-2
 55.2040  23.2542    2.7  49.0  150.4   1.8952   4.3 ------	UNKNOWN
318.5668  46.3530    2.8  30.7   -5.4   0.4913   4.1 ------	UNKNOWN
 41.6895  -2.8697    3.2  57.1 -174.1   1.9427   3.6 ------	UNKNOWN
 37.3055  -8.3893    2.6  59.1 -166.2   3.3871   4.4 ------	UNKNOWN
 32.0074 -11.1343    2.8  58.8 -159.3   3.3998   4.1 ------	UNKNOWN
Pre-slew background subtracted image of 15-350 keV band
Time interval of the image:
-3.820000 13.492000

# RAcent  DECcent POSerr Theta    Phi  PeakCts   SNR AngSep     Name
#  [deg]    [deg]    ['] [deg]  [deg]                   [']
299.5114  35.0953   15.9  47.4  -17.2   0.0648   0.7    7.5	Cyg X-1
308.2926  41.0696    9.2  38.9  -12.5  -0.0778  -1.3   10.8	Cyg X-3
326.0115  38.4900    0.0  26.3  -23.3   0.0406   0.8   12.6	Cyg X-2
 30.6498  33.4736    0.3  25.2  152.4   1.7066  33.6 ------	UNKNOWN
323.1658  29.1119    1.9  31.9  -39.5   0.3153   5.9 ------	UNKNOWN
333.3550  10.2330    2.1  37.7  -75.6   0.5732   5.6 ------	UNKNOWN
Post-slew image of 15-350 keV band
Time interval of the image:
61.684590 302.271600
420.184000 962.258400
978.184000 1468.239900

# RAcent  DECcent POSerr Theta    Phi  PeakCts   SNR AngSep     Name
#  [deg]    [deg]    ['] [deg]  [deg]                   [']
326.1274  38.4296 2700.0  51.4  -30.7  -0.0048  -0.0    6.8	Cyg X-2
 73.4175   2.6121    3.4  50.5  152.5   9.4296   3.4 ------	UNKNOWN
310.6781  58.6469    3.9  56.8   -3.6   9.5237   3.0 ------	UNKNOWN
 49.4268 -22.7812    3.8  59.1 -166.1  13.2254   3.0 ------	UNKNOWN
 17.8493 -12.8961    2.3  48.0 -129.0  14.9175   4.9 ------	UNKNOWN