Analysis Summary
Notes:
- 1) No attempt has been made to eliminate the non-significant decimal places.
- 2) This batgrbproduct analysis is done using the HEASARC data.
- 3) This batgrbproduct analysis is using the flight position for the mask-weighting calculation.
======================================================================
BAT GRB EVENT DATA PROCESSING REPORT
Process Script Ver: batgrbproduct v2.46
Process Start Time: Sun Oct 5 00:22:36 EDT 2014
Host Name: batevent1
Current Working Dir: /local/data/batevent/batevent_reproc/trigger591390
======================================================================
Trigger: 00591390 Segment: 000
BAT Trigger Time: 416264728 [s; MET]
Trigger Stop: 416264792 [s; MET]
UTC: 2014-03-11T21:05:16.252360 [includes UTCF correction]
Where From?: TDRSS position message
BAT
RA: 209.300638813478 Dec: 0.611516972213103 [deg; J2000]
Catalogged Source?: NO
Point Source?: YES
GRB Indicated?: YES [ by BAT flight software ]
Image S/N Ratio: 7.81
Image Trigger?: YES
Rate S/N Ratio: 0 [ if not an image trigger ]
Image S/N Ratio: 7.81
Analysis Position: [ source = BAT ]
RA: 209.300638813478 Dec: 0.611516972213103 [deg; J2000]
Refined Position: [ source = BAT pre-slew burst ]
RA: 209.301 Dec: 0.611518 [deg; J2000]
{ 13h 57m 12.2s , 00d 36' 41.5" }
+/- 2.56447397761 [arcmin] (estimated 90% radius based on SNR)
SNR: 7.9230412483
Angular difference between the analysis and refined position is 0.021670 arcmin
Partial Coding Fraction: 0.1083984 [ including projection effects ]
Duration
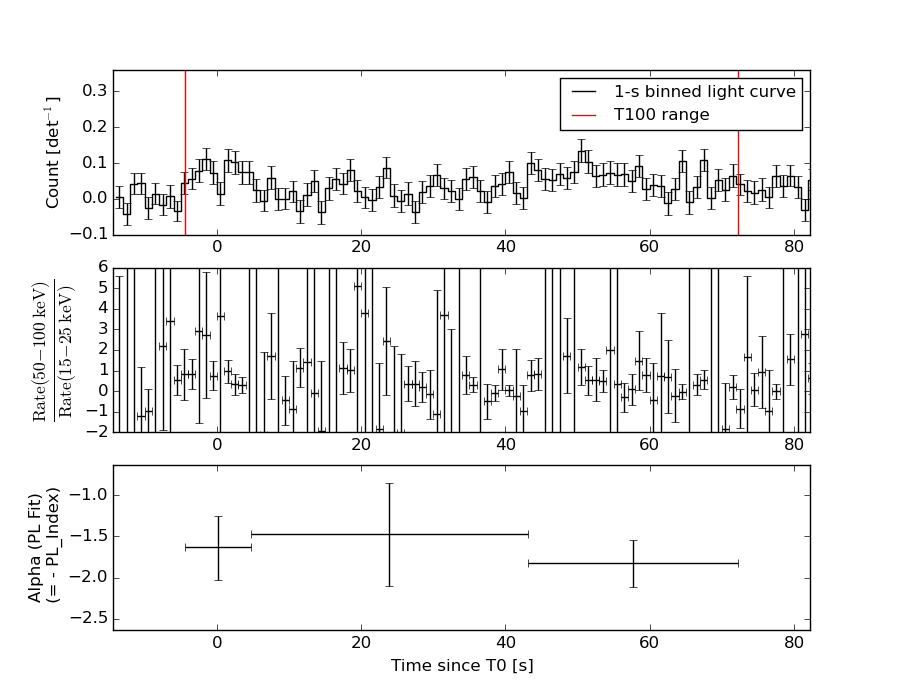
T90: 70.4800000190735 +/- 7.58769950271438
Measured from: -2.19999998807907
to: 68.2800000309944 [s; relative to TRIGTIME]
T50: 41.1040000319481 +/- 10.9853371161529
Measured from: 13.160000026226
to: 54.2640000581741 [s; relative to TRIGTIME]
Fluence
Peak Flux (peak 1 second)
Measured from: -2.40399998426437
to: -1.40399998426437 [s; relative to TRIGTIME]
Total Fluence
Measured from: -4.4559999704361
to: 72.216000020504 [s; relative to TRIGTIME]
Band 1 Band 2 Band 3 Band 4
15-25 25-50 50-100 100-350 keV
Total 0.941197 1.228742 0.909888 0.291949
0.149606 0.144547 0.128412 0.118788 [error]
Peak 0.042913 0.050338 0.036702 0.013560
0.017621 0.017423 0.015373 0.014003 [error]
[ fluence units of on-axis counts / fully illuminated detector ]
======================================================================
====== Table of the duration information =============================
Value tstart tstop
T100 76.672 -4.456 72.216
T90 70.480 -2.200 68.280
T50 41.104 13.160 54.264
Peak 1.000 -2.404 -1.404
====== Spectral Analysis Summary =====================================
Model : spectral model: simple power-law (PL) and cutoff power-law (CPL)
Ph_index : photon index: E^{Ph_index}
Ph_90err : 90% error of the photon index
Epeak : Epeak in keV
Epeak_90err: 90% error of Epeak
Norm : normalization at 50 keV in both the PL model and CPL model
Nomr_90err : 90% error of the normalization
chi2 : Chi-Squared
dof : degree of freedo
=== Time-averaged spectral analysis ===
(Best model with acceptable fit: PL)
Model Ph_index Ph_90err_low Ph_90err_hi Epeak Epeak_90err_low Epeak_90err_hi Norm Nomr_90err_low Norm_90err_hi chi2 dof
PL -1.697 -0.239 0.232 - - - 2.95e-03 -4.10e-04 4.03e-04 57.400 57
CPL -1.484 -0.443 1.063 116.353 -116.353 -116.353 3.81e-03 N/A N/A 57.240 56
=== 1-s peak spectral analysis ===
(Best model with acceptable fit: PL)
Model Ph_index Ph_90err_low Ph_90err_hi Epeak Epeak_90err_low Epeak_90err_hi Norm Nomr_90err_low Norm_90err_hi chi2 dof
PL -1.728 -0.663 0.598 - - - 9.56e-03 -3.63e-03 3.45e-03 48.610 57
CPL -1.242 -0.901 4.197 75.559 -75.559 -75.559 1.72e-02 -1.72e-02 1.84e+00 48.520 56
=== Fluence/Peak Flux Summary ===
Model Band1 Band2 Band3 Band4 Band5 Total
15-25 25-50 50-100 100-350 15-150 15-350 keV
Fluence PL 3.48e-07 5.67e-07 6.99e-07 1.70e-06 2.10e-06 3.32e-06 erg/cm2
90%_error_low -7.20e-08 -7.46e-08 -1.30e-07 -5.82e-07 -3.02e-07 -7.09e-07 erg/cm2
90%_error_hi 7.58e-08 7.42e-08 1.29e-07 7.56e-07 3.07e-07 8.45e-07 erg/cm2
Peak flux PL 4.90e-01 4.31e-01 2.60e-01 2.37e-01 1.28e+00 1.42e+00 ph/cm2/s
90%_error_low -2.49e-01 -1.54e-01 -1.22e-01 -1.64e-01 -4.48e-01 -4.85e-01 ph/cm2/s
90%_error_hi 2.88e-01 1.51e-01 1.19e-01 2.85e-01 4.51e-01 4.86e-01 ph/cm2/s
Fluence CPL 3.37e-07 5.80e-07 7.06e-07 1.21e-06 2.06e-06 2.83e-06 erg/cm2
90%_error_low -8.60e-08 -8.55e-08 -1.34e-07 -8.88e-07 -3.43e-07 -9.74e-07 erg/cm2
90%_error_hi 7.94e-08 9.58e-08 1.37e-07 6.49e-07 3.33e-07 7.50e-07 erg/cm2
Peak flux CPL 4.54e-01 4.53e-01 2.70e-01 1.39e-01 1.26e+00 1.32e+00 ph/cm2/s
90%_error_low N/A -4.53e-01 -6.77e-02 -1.39e-01 -4.76e-01 -5.29e-01 ph/cm2/s
90%_error_hi N/A 2.05e-01 7.56e-02 1.74e-01 4.57e-01 5.47e-01 ph/cm2/s
======================================================================
Image
Pre-slew 15.0-50.0 keV image (Event data)
#RAcent DECcent POSerr Theta  Phi  Peak_Cts  SNR Name
209.301 0.612 0.000 40.828 56.049 1.630 7.923 TRIG_00591390

Image time interval: 0.000 to 64.000 [sec]
Light Curves
Note: The mask-weighted lightcurves have units of either count/det or counts/sec/det, where a det is 0.4 x 0.4 = 0.16 sq cm.
Full-time range; 1 s binning
Other quick-look light curves:
- 64 ms binning (zoomed)
- 16 ms binning (zoomed)
- 8 ms binning (zoomed)
- 2 ms binning (zoomed)
- SN=5 or 10 s binning (full-time range)
- Raw light curve
Spectra
- 64 ms binning (zoomed)
- 16 ms binning (zoomed)
- 8 ms binning (zoomed)
- 2 ms binning (zoomed)
- SN=5 or 10 s binning (full-time range)
- Raw light curve
Spectra
Notes:
- 1) The fitting includes the systematic errors.
- 2) When the burst includes telescope slew time periods, the fitting uses an average response file made from multiple 5-s response files through out the slew time plus single time preiod for the non-slew times, and weighted by the total counts in the corresponding time period using addrmf. An average response file is needed becuase a spectral fit using the pre-slew DRM will introduce some errors in both a spectral shape and a normalization if the PHA file contains a lot of the slew/post-slew time interval.
- 3) For fits to more complicated models (e.g. a power-law over a cutoff power-law), the BAT team has decided to require a chi-square improvement of more than 6 for each extra dof.
Time averaged spectrum fit using the average DRM
Power-law model
Time interval is from   -4.456 sec. to   72.216 sec.

Spectral model in power-law:
------------------------------------------------------------
Parameters  : value       lower 90%   higher 90%
Photon index: -1.69699     ( -0.238552   0.232181 )
Norm@50keV  : 2.95234E-03    ( -0.000409829   0.00040336 )
------------------------------------------------------------
#Fit statistic : Chi-Squared =          57.40 using 59 PHA bins.
# Reduced chi-squared =          1.007 for     57 degrees of freedom
# Null hypothesis probability =   4.601691e-01

Photon flux (15-150 keV)    in 76.67 sec: 0.391708 ( -0.051586  0.05177 ) ph/cm2/s
Energy fluence (15-150 keV)             : 2.0966e-06 ( -3.02466e-07  3.06628e-07 ) ergs/cm2
Cutoff power-law model
Time interval is from   -4.456 sec. to   72.216 sec.
Spectral model in the cutoff power-law:
------------------------------------------------------------
Parameters  : value       lower 90%   higher 90%
Photon index: -1.48441     ( -0.443377   1.06342 )
Epeak [keV] : 116.353      ( -116.356 -116.356 )
Norm@50keV  : 3.81404E-03    (     )
------------------------------------------------------------
#Fit statistic : Chi-Squared =          57.24 using 59 PHA bins.
# Reduced chi-squared =          1.022 for     56 degrees of freedom
# Null hypothesis probability =   4.287148e-01

Photon flux (15-150 keV)    in 76.67 sec: 0.387709 ( -0.054508  0.053306 ) ph/cm2/s
Energy fluence (15-150 keV)             : 2.05933e-06 ( -3.42779e-07  3.33359e-07 ) ergs/cm2
1-s peak spectrum fit
Power-law model
Time interval is from   -2.404 sec. to   -1.404 sec.

Spectral model in power-law:
------------------------------------------------------------
Parameters  : value       lower 90%   higher 90%
Photon index: -1.72763     ( -0.663056   0.59838 )
Norm@50keV  : 9.55920E-03    ( -0.00362942   0.00345212 )
------------------------------------------------------------
#Fit statistic : Chi-Squared =          48.61 using 59 PHA bins.
# Reduced chi-squared =         0.8528 for     57 degrees of freedom
# Null hypothesis probability =   7.777975e-01

Photon flux (15-150 keV)    in 1 sec: 1.28213 ( -0.448326  0.45131 ) ph/cm2/s
Energy fluence (15-150 keV)             : 8.83426e-08 ( -3.31666e-08  3.40316e-08 ) ergs/cm2
Cutoff power-law model
Time interval is from   -2.404 sec. to   -1.404 sec.
Spectral model in the cutoff power-law:
------------------------------------------------------------
Parameters  : value       lower 90%   higher 90%
Photon index: -1.24157     ( -0.900459   4.19795 )
Epeak [keV] : 75.5593      ( -75.6247 -75.6247 )
Norm@50keV  : 1.71515E-02    ( -0.0171261   1.83895 )
------------------------------------------------------------
#Fit statistic : Chi-Squared =          48.52 using 59 PHA bins.
# Reduced chi-squared =         0.8664 for     56 degrees of freedom
# Null hypothesis probability =   7.509897e-01

Photon flux (15-150 keV)    in 1 sec: 1.25919 ( -0.476078  0.45729 ) ph/cm2/s
Energy fluence (15-150 keV)             : 6.58688e-08 ( -1.50435e-08  5.58226e-08 ) ergs/cm2
Time-resolved spectra
Distribution
T90 vs. Hardness ratio plot
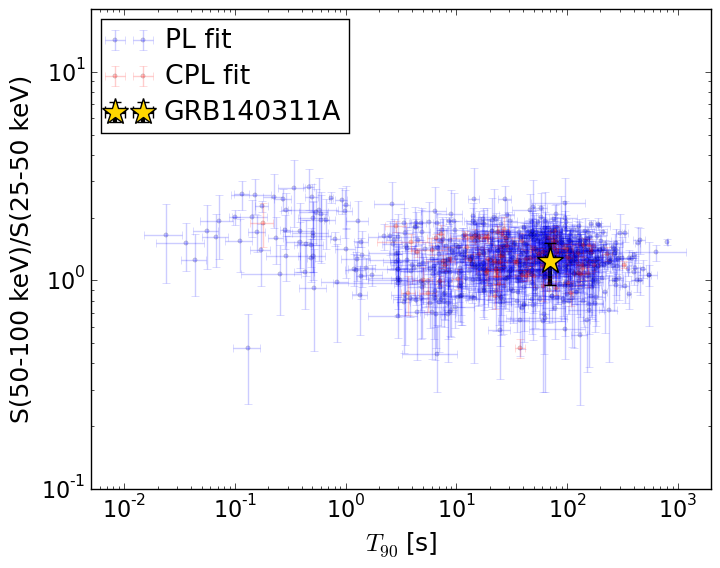
T90                                   = 70.48 sec.
Hardness ratio (energy fluence ratio) = 1.23375799268
S(15-50 keV) vs. S(50-150 keV) plot
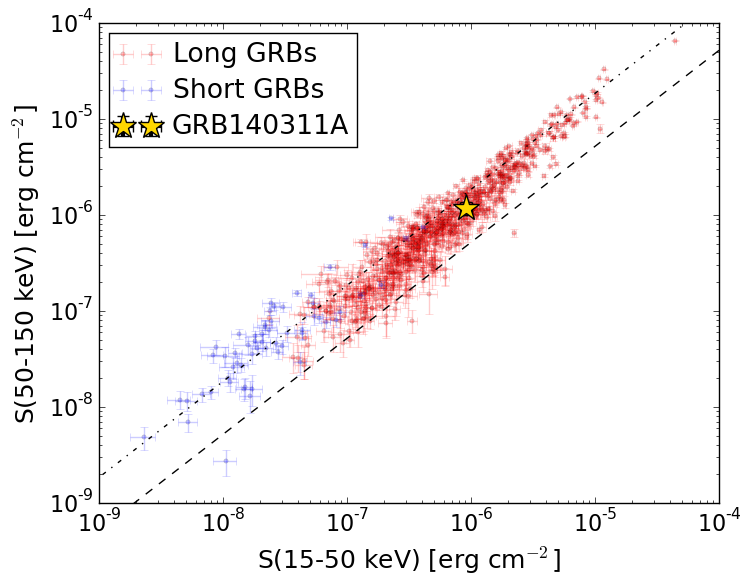
S(15-50 keV)  = 9.146752e-07
S(50-150 keV) = 1.1819271e-06
The dash-dotted line and the dashed line traces the fluences calculated from the Band function with Epeak = 15 and 150 keV, respectively. Both lines assume a canonical values of alpha = -1 and beta = -2.5.
Mask shadow pattern
IMX = 0.482544112951, IMY = -0.716713783314
Spacecraft aspect plot
Bright source in the pre-burst/pre-slew/post-slew images
Pre-burst image of 15-350 keV band
Time interval of the image:
-15.699400 -4.456000

# RAcent  DECcent POSerr Theta    Phi  PeakCts   SNR AngSep     Name
#  [deg]    [deg]    ['] [deg]  [deg]                   [']
244.9351 -15.6474    1.3  48.0    0.3   0.5889   8.8    2.6	Sco X-1
254.6386  35.4886    0.0  15.0  -98.6   0.0432   1.3   12.5	Her X-1
268.2622  -1.4466   13.2  44.4  -37.1   0.0580   0.9    6.4	SW J1753.5-0127
Pre-slew background subtracted image of 15-350 keV band
Time interval of the image:
-4.456000 72.216000

# RAcent  DECcent POSerr Theta    Phi  PeakCts   SNR AngSep     Name
#  [deg]    [deg]    ['] [deg]  [deg]                   [']
245.0838 -15.6334    4.7  48.1    0.1   1.1505   2.4    6.0	Sco X-1
254.6385  35.4886    0.0  15.0  -98.6  -0.2796  -1.2   12.5	Her X-1
268.3792  -1.4459    7.3  44.5  -37.3  -0.7389  -1.6    0.8	SW J1753.5-0127
212.5762  -8.4142    1.7  46.6   44.9   6.7447   6.7 ------	UNKNOWN
287.9903  64.1218    2.4  44.9 -141.0   2.3880   4.8 ------	UNKNOWN
Post-slew image of 15-350 keV band
Time interval of the image:
-239.000000 422.998900

# RAcent  DECcent POSerr Theta    Phi  PeakCts   SNR AngSep     Name
#  [deg]    [deg]    ['] [deg]  [deg]                   [']
244.9824 -15.6402    0.4  48.0    0.3  26.0241  29.9    0.2	Sco X-1
254.5036  35.1977   10.4  14.8  -97.5  -0.4496  -1.1    9.0	Her X-1
268.4084  -1.3274   10.4  44.4  -37.4  -0.8748  -1.1    7.9	SW J1753.5-0127
183.2516  39.3644    2.7  43.8  126.0   7.5978   4.3 ------	UNKNOWN
226.3399  17.8856    3.2  17.0   48.1   1.4208   3.6 ------	UNKNOWN
157.7450  80.5137    4.0  56.9  179.2   8.7155   2.9 ------	UNKNOWN
244.5215 -15.6377    0.7  48.0    0.9  14.0946  16.9 ------	UNKNOWN
248.6741 -20.2972    2.2  53.3   -3.1   5.4568   5.2 ------	UNKNOWN