Analysis Summary
Notes:
- 1) No attempt has been made to eliminate the non-significant decimal places.
- 2) This batgrbproduct analysis is done using the HEASARC data.
- 3) This batgrbproduct analysis is using the flight position for the mask-weighting calculation.
==========================================================================
           BAT GRB EVENT DATA PROCESSING REPORT
    Process Script Ver: batgrbproduct v2.46
    Process Start Time: Sun Oct  5 00:21:43 EDT 2014
             Host Name: batevent1
   Current Working Dir: /local/data/batevent/batevent_reproc/trigger591392
======================================================================

  Trigger: 00591392      Segment: 000

  BAT Trigger Time: 416265281.472   [s; MET]
      Trigger Stop: 416265282.496   [s; MET]
               UTC: 2014-03-11T21:14:29.724340    [includes UTCF correction]
       Where From?: TDRSS position message

  Analysis Position:   [ source = BAT ]
    RA: 252.2912709546   Dec: 52.7471555799562  [deg; J2000]

  Refined Position:   [ source = BAT pre-slew burst ]
    RA: 252.283294729076   Dec: 52.7249327111224  [deg; J2000]
        { 16h 49m 08.0s , +52d 43' 29.8" }
         +/- 2.18527479535286 [arcmin] (estimated 90% radius based on SNR)
         +/- 1.03567619567285 [arcmin] (formal 1-sigma fit error)
    SNR: 9.9565694536129

  Angular difference between the analysis and refined position is 1.364496 arcmin

  Partial Coding Fraction: 0.8984375    [ including projection effects ]

  Duration
     T90: 129.600000023842 +/- 1.6
        Measured from: 6.4
                   to: 136     [s; relative to TRIGTIME]
     T50: 70.4000000357628 +/- 1.6
        Measured from: 33.6
                   to: 104     [s; relative to TRIGTIME]


====== Table of the duration information =============================

        Value   tstart    tstop
T100  142.400  -15.872  126.528
T90   129.600   -9.472  120.128
T50    70.400   17.728   88.128
Peak    1.000   13.228   14.228


====== Spectral Analysis Summary =====================================

Model      : spectral model: simple power-law (PL) and cutoff power-law (CPL)
Ph_index   : photon index: E^{Ph_index}
Ph_90err   : 90% error of the photon index
Epeak      : Epeak in keV
Epeak_90err: 90% error of Epeak
Norm       : normalization at 50 keV in both the PL model and CPL model
Nomr_90err : 90% error of the normalization
chi2       : Chi-Squared
dof        : degree of freedo

=== Time-averaged spectral analysis ===
(Best model with acceptable fit: PL)

Model Ph_index Ph_90err_low Ph_90err_hi  Epeak  Epeak_90err_low  Epeak_90err_hi  Norm       Nomr_90err_low    Norm_90err_hi    chi2    dof
PL      -1.272    -0.152      0.153       -           -               -         7.26e-03     -6.46e-04          6.46e-04      56.420   57
CPL     -0.764    -0.563      0.668      124.450     -44.824      -124.450      1.30e-02     -5.96e-03          1.41e-02      54.210   56


=== 1-s peak spectral analysis ===
(Best model with acceptable fit: N/A)

Model Ph_index Ph_90err_low Ph_90err_hi  Epeak  Epeak_90err_low  Epeak_90err_hi  Norm       Nomr_90err_low    Norm_90err_hi    chi2    dof
PL      N/A         N/A       N/A          -           -               -           N/A           N/A               N/A         N/A        N/A
CPL     N/A         N/A       N/A          N/A         N/A           N/A           N/A           N/A               N/A         N/A        N/A


=== Fluence/Peak Flux Summary ===

              Model    Band1     Band2     Band3     Band4     Band5     Total
                       15-25     25-50    50-100    100-350    15-150    15-350    keV
Fluence         PL   2.30e-08  4.85e-08  8.03e-08  3.02e-07  2.21e-07  4.53e-07   erg/cm2
      90%_error_low -3.64e-09 -4.79e-09 -8.78e-09 -6.60e-08 -2.19e-08 -7.30e-08   erg/cm2
      90%_error_hi   3.80e-09  4.75e-09  8.73e-09  7.82e-08  2.21e-08  8.32e-08   erg/cm2
Peak flux       PL     N/A      N/A      N/A      N/A      N/A      N/A     ph/cm2/s
Image
Pre-slew 15.0-350.0 keV image (Event data)
#   RAcent    DECcent   POSerr    Theta     Phi              Peak Cts       SNR   Name
  252.2833    52.7249   0.0193    23.5981  -146.4034         0.1066251      9.957 TRIG_00591392

Foreground time interval of the image:
  0.000   1.024 (delta_t =   1.024 [sec])
Background time interval of the image:
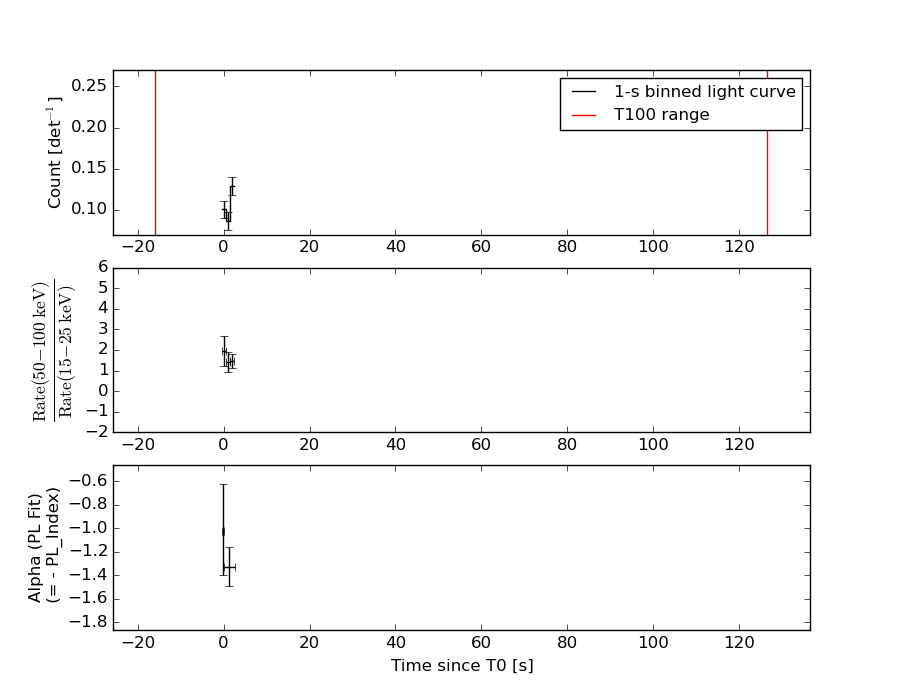
Light Curves
Note: The mask-weighted lightcurves have units of either count/det or counts/sec/det, where a det is 0.4 x 0.4 = 0.16 sq cm.
Full-time range; 1 s binning
Other quick-look light curves:
- 64 ms binning (zoomed)
- 16 ms binning (zoomed)
- 8 ms binning (zoomed)
- 2 ms binning (zoomed)
- SN=5 or 10 s binning (full-time range)
- Raw light curve
Spectra
- 64 ms binning (zoomed)
- 16 ms binning (zoomed)
- 8 ms binning (zoomed)
- 2 ms binning (zoomed)
- SN=5 or 10 s binning (full-time range)
- Raw light curve
Spectra
Notes:
- 1) The fitting includes the systematic errors.
- 2) When the burst includes telescope slew time periods, the fitting uses an average response file made from multiple 5-s response files through out the slew time plus single time preiod for the non-slew times, and weighted by the total counts in the corresponding time period using addrmf. An average response file is needed becuase a spectral fit using the pre-slew DRM will introduce some errors in both a spectral shape and a normalization if the PHA file contains a lot of the slew/post-slew time interval.
- 3) For fits to more complicated models (e.g. a power-law over a cutoff power-law), the BAT team has decided to require a chi-square improvement of more than 6 for each extra dof.
Time averaged spectrum fit using the average DRM
Power-law model

Time interval is from   -0.472 sec. to    2.593 sec.

Spectral model in power-law:
------------------------------------------------------------
Parameters  : value       lower 90%   higher 90%
Photon index: -1.27231     ( -0.151807   0.153406 )
Norm@50keV  : 7.25603E-03    ( -0.000646427   0.000646162 )
------------------------------------------------------------
#Fit statistic : Chi-Squared =          56.42 using 59 PHA bins.
# Reduced chi-squared =         0.9898 for     57 degrees of freedom
# Null hypothesis probability =   4.968274e-01

Photon flux (15-150 keV)    in 3.065 sec: 0.861410 ( -0.078392  0.07851 ) ph/cm2/s
Energy fluence (15-150 keV)             : 2.2132e-07 ( -2.18991e-08  2.2108e-08 ) ergs/cm2
Cutoff power-law model

Time interval is from   -0.472 sec. to    2.593 sec.
Spectral model in the cutoff power-law:
------------------------------------------------------------
Parameters  : value       lower 90%   higher 90%
Photon index: -0.763803     ( -0.562836   0.668288 )
Epeak [keV] : 124.450      ( -44.8248 -124.45 )
Norm@50keV  : 1.29732E-02    ( -0.00596355   0.0141461 )
------------------------------------------------------------
#Fit statistic : Chi-Squared =          54.21 using 59 PHA bins.
# Reduced chi-squared =         0.9680 for     56 degrees of freedom
# Null hypothesis probability =   5.429880e-01

Photon flux (15-150 keV)    in 3.065 sec: 0.843164 ( -0.081272  0.081244 ) ph/cm2/s
Energy fluence (15-150 keV)             : 2.12662e-07 ( -2.43839e-08  2.43225e-08 ) ergs/cm2
1-s peak spectrum fit
1-s peak spectrum unavailable, likely because there are no event data in the 1-s peak range.
Time-resolved spectra
Distribution
T90 vs. Hardness ratio plot
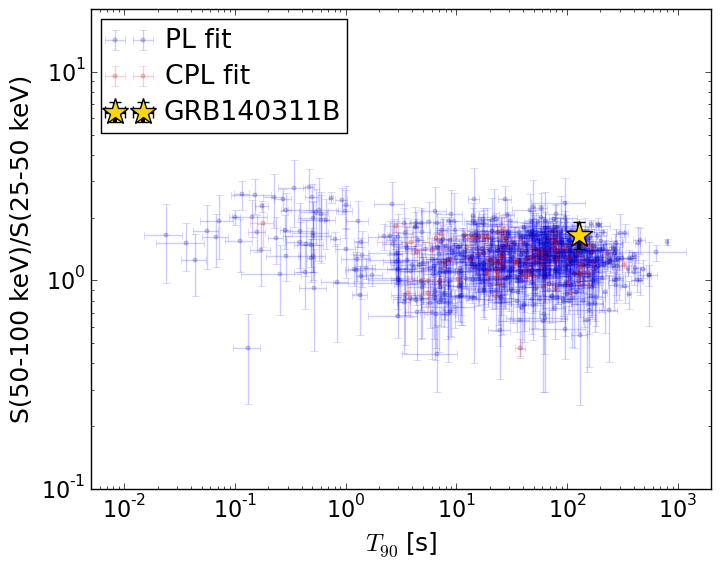
T90                                   = 129.6 sec.
Hardness ratio (energy fluence ratio) = 1.65603715579
S(15-50 keV) vs. S(50-150 keV) plot
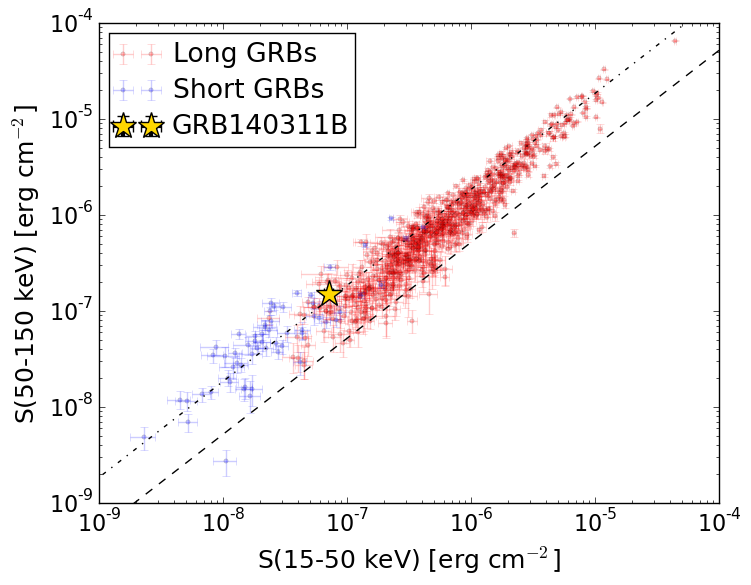
S(15-50 keV)  = 7.144298e-08
S(50-150 keV) = 1.4987758e-07
The dash-dotted line and the dashed line traces the fluences calculated from the Band function with Epeak = 15 and 150 keV, respectively. Both lines assume a canonical values of alpha = -1 and beta = -2.5.
Mask shadow pattern
IMX = -3.638750795471890E-01, IMY = 2.417269354991673E-01
Spacecraft aspect plot
Bright source in the pre-burst/pre-slew/post-slew images
Pre-burst image of 15-350 keV band
Time interval of the image:
Pre-slew background subtracted image of 15-350 keV band
Time interval of the image:
0.000000 1.024000

# RAcent  DECcent POSerr Theta    Phi  PeakCts   SNR AngSep     Name
#  [deg]    [deg]    ['] [deg]  [deg]                   [']
244.8766 -15.6321    2.5  48.0    0.4   0.0972   4.6    6.0	Sco X-1
254.4691  35.3366   70.6  14.8  -98.1  -0.0016  -0.2    0.7	Her X-1
268.2753  -1.5922    4.2  44.5  -37.0  -0.0587  -2.7   10.1	SW J1753.5-0127
182.9248  52.0473    2.5  43.9  144.3   0.1197   4.6 ------	UNKNOWN
208.8994  34.6085    3.3  23.7  114.8   0.0450   3.5 ------	UNKNOWN
252.2833  52.7249    1.2  23.6 -146.4   0.1066  10.0 ------	UNKNOWN
Post-slew image of 15-350 keV band
Time interval of the image: