Analysis Summary
Notes:
- 1) No attempt has been made to eliminate the non-significant decimal places.
- 2) This batgrbproduct analysis is done using the HEASARC data.
- 3) This batgrbproduct analysis is using the flight position for the mask-weighting calculation.
======================================================================
BAT GRB EVENT DATA PROCESSING REPORT
Process Script Ver: batgrbproduct v2.46
Process Start Time: Sun Oct 5 00:14:21 EDT 2014
Host Name: batevent1
Current Working Dir: /local/data/batevent/batevent_reproc/trigger592204
======================================================================
Trigger: 00592204 Segment: 000
BAT Trigger Time: 416794159.744 [s; MET]
Trigger Stop: 416794171.904 [s; MET]
UTC: 2014-03-18T00:09:07.971300 [includes UTCF correction]
Where From?: TDRSS position message
BAT
RA: 184.052783456915 Dec: 20.2074317487921 [deg; J2000]
Catalogged Source?: NO
Point Source?: YES
GRB Indicated?: YES [ by BAT flight software ]
Image S/N Ratio: 8.5
Image Trigger?: NO
Rate S/N Ratio: 12.2474487139159 [ if not an image trigger ]
Image S/N Ratio: 8.5
Analysis Position: [ source = BAT ]
RA: 184.052783456915 Dec: 20.2074317487921 [deg; J2000]
Refined Position: [ source = BAT pre-slew burst ]
RA: 184.050018980769 Dec: 20.22515773557 [deg; J2000]
{ 12h 16m 12.0s , +20d 13' 30.6" }
+/- 2.11435441791349 [arcmin] (estimated 90% radius based on SNR)
+/- 0.673116130558229 [arcmin] (formal 1-sigma fit error)
SNR: 10.4370720975466
Angular difference between the analysis and refined position is 1.074888 arcmin
Partial Coding Fraction: 0.4921875 [ including projection effects ]
Duration
T90: 7.6039999127388 +/- 1.27603289493624
Measured from: 3.52799999713898
to: 11.1319999098778 [s; relative to TRIGTIME]
T50: 4.75599992275238 +/- 1.66540924222543
Measured from: 4.31599998474121
to: 9.07199990749359 [s; relative to TRIGTIME]
Fluence
Peak Flux (peak 1 second)
Measured from: 5.47999995946884
to: 6.47999995946884 [s; relative to TRIGTIME]
Total Fluence
Measured from: 2.24399995803833
to: 11.6759999990463 [s; relative to TRIGTIME]
Band 1 Band 2 Band 3 Band 4
15-25 25-50 50-100 100-350 keV
Total 0.095076 0.164878 0.127145 0.059662
0.023456 0.022982 0.020265 0.017444 [error]
Peak 0.007259 0.037596 0.016701 0.012189
0.007720 0.007383 0.006556 0.005666 [error]
[ fluence units of on-axis counts / fully illuminated detector ]
======================================================================
====== Table of the duration information =============================
Value tstart tstop
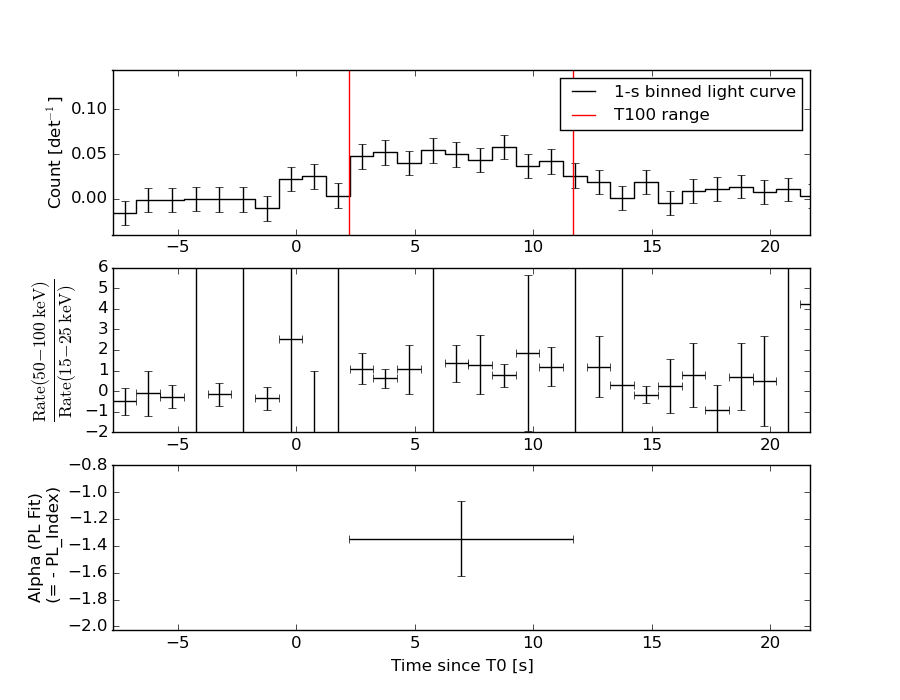
T100 9.432 2.244 11.676
T90 7.604 3.528 11.132
T50 4.756 4.316 9.072
Peak 1.000 5.480 6.480
====== Spectral Analysis Summary =====================================
Model : spectral model: simple power-law (PL) and cutoff power-law (CPL)
Ph_index : photon index: E^{Ph_index}
Ph_90err : 90% error of the photon index
Epeak : Epeak in keV
Epeak_90err: 90% error of Epeak
Norm : normalization at 50 keV in both the PL model and CPL model
Nomr_90err : 90% error of the normalization
chi2 : Chi-Squared
dof : degree of freedo
=== Time-averaged spectral analysis ===
(Best model with acceptable fit: PL)
Model Ph_index Ph_90err_low Ph_90err_hi Epeak Epeak_90err_low Epeak_90err_hi Norm Nomr_90err_low Norm_90err_hi chi2 dof
PL -1.346 -0.276 0.280 - - - 3.09e-03 -4.83e-04 4.83e-04 54.960 57
CPL -1.086 -1.576 1.240 180.845 -180.845 -180.845 4.16e-03 -1.52e-03 1.22e-02 54.780 56
=== 1-s peak spectral analysis ===
(Best model with acceptable fit: N/A)
Model Ph_index Ph_90err_low Ph_90err_hi Epeak Epeak_90err_low Epeak_90err_hi Norm Nomr_90err_low Norm_90err_hi chi2 dof
PL -1.009 -0.514 0.605 - - - 4.66e-03 -1.51e-03 1.47e-03 87.560 57
CPL -0.560 0.560 2.616 159.367 -159.367 -159.367 7.79e-03 -4.56e-03 1.61e-01 87.470 56
=== Fluence/Peak Flux Summary ===
Model Band1 Band2 Band3 Band4 Band5 Total
15-25 25-50 50-100 100-350 15-150 15-350 keV
Fluence PL 3.23e-08 6.52e-08 1.03e-07 3.57e-07 2.85e-07 5.57e-07 erg/cm2
90%_error_low -8.89e-09 -1.13e-08 -2.00e-08 -1.32e-07 -4.90e-08 -1.49e-07 erg/cm2
90%_error_hi 9.62e-09 1.11e-08 1.97e-08 1.79e-07 4.96e-08 1.87e-07 erg/cm2
Peak flux PL 1.20e-01 1.62e-01 1.61e-01 2.88e-01 5.37e-01 7.31e-01 ph/cm2/s
90%_error_low -6.99e-02 -6.77e-02 -5.13e-02 -1.55e-01 -1.74e-01 -2.24e-01 ph/cm2/s
90%_error_hi 8.87e-02 6.55e-02 5.07e-02 2.58e-01 1.77e-01 2.43e-01 ph/cm2/s
Fluence CPL 3.08e-08 6.68e-08 1.04e-07 2.40e-07 2.80e-07 4.42e-07 erg/cm2
90%_error_low -1.06e-08 -1.26e-08 -2.12e-08 -1.82e-07 -5.49e-08 -1.92e-07 erg/cm2
90%_error_hi 1.07e-08 1.36e-08 2.22e-08 3.32e-07 5.36e-08 1.69e-07 erg/cm2
Peak flux CPL 1.12e-01 1.68e-01 1.68e-01 1.88e-01 5.31e-01 6.36e-01 ph/cm2/s
90%_error_low -7.53e-02 -7.20e-02 -5.68e-02 -1.88e-01 -1.74e-01 -2.57e-01 ph/cm2/s
90%_error_hi 9.45e-02 7.97e-02 6.22e-02 1.59e-01 1.79e-01 3.24e-01 ph/cm2/s
======================================================================
Image
Pre-slew 15.0-350.0 keV image (Event data)
#   RAcent    DECcent   POSerr    Theta     Phi              Peak Cts       SNR   Name
  184.0500    20.2252   0.0184    28.4810   125.5736         0.4459840     10.437 TRIG_00592204

Foreground time interval of the image:
  2.244  11.676 (delta_t =   9.432 [sec])
Background time interval of the image:
-239.744   2.244 (delta_t = 241.988 [sec])
Light Curves
Note: The mask-weighted lightcurves have units of either count/det or counts/sec/det, where a det is 0.4 x 0.4 = 0.16 sq cm.
Full-time range; 1 s binning
Other quick-look light curves:
- 64 ms binning (zoomed)
- 16 ms binning (zoomed)
- 8 ms binning (zoomed)
- 2 ms binning (zoomed)
- SN=5 or 10 s binning (full-time range)
- Raw light curve
Spectra
- 64 ms binning (zoomed)
- 16 ms binning (zoomed)
- 8 ms binning (zoomed)
- 2 ms binning (zoomed)
- SN=5 or 10 s binning (full-time range)
- Raw light curve
Spectra
Notes:
- 1) The fitting includes the systematic errors.
- 2) When the burst includes telescope slew time periods, the fitting uses an average response file made from multiple 5-s response files through out the slew time plus single time preiod for the non-slew times, and weighted by the total counts in the corresponding time period using addrmf. An average response file is needed becuase a spectral fit using the pre-slew DRM will introduce some errors in both a spectral shape and a normalization if the PHA file contains a lot of the slew/post-slew time interval.
- 3) For fits to more complicated models (e.g. a power-law over a cutoff power-law), the BAT team has decided to require a chi-square improvement of more than 6 for each extra dof.
Time averaged spectrum fit using the average DRM
Power-law model
Time interval is from    2.244 sec. to   11.676 sec.

Spectral model in power-law:
------------------------------------------------------------
Parameters  : value       lower 90%   higher 90%
Photon index: -1.34592     ( -0.275889   0.279583 )
Norm@50keV  : 3.09471E-03    ( -0.00048326   0.000482605 )
------------------------------------------------------------
#Fit statistic : Chi-Squared =          54.96 using 59 PHA bins.
# Reduced chi-squared =         0.9642 for     57 degrees of freedom
# Null hypothesis probability =   5.519712e-01

Photon flux (15-150 keV)    in 9.432 sec: 0.372517 ( -0.059844  0.060072 ) ph/cm2/s
Energy fluence (15-150 keV)             : 2.8538e-07 ( -4.89877e-08  4.96267e-08 ) ergs/cm2
Cutoff power-law model

Time interval is from    2.244 sec. to   11.676 sec.
Spectral model in the cutoff power-law:
------------------------------------------------------------
Parameters  : value       lower 90%   higher 90%
Photon index: -1.08585     ( -1.57593   1.23954 )
Epeak [keV] : 180.845      ( -180.868 -180.868 )
Norm@50keV  : 4.16062E-03    ( -0.00151764   0.0122224 )
------------------------------------------------------------
#Fit statistic : Chi-Squared =          54.78 using 59 PHA bins.
# Reduced chi-squared =         0.9782 for     56 degrees of freedom
# Null hypothesis probability =   5.211698e-01

Photon flux (15-150 keV)    in 9.432 sec: 0.368027 ( -0.062609  0.062476 ) ph/cm2/s
Energy fluence (15-150 keV)             : 2.79668e-07 ( -5.49472e-08  5.36153e-08 ) ergs/cm2
1-s peak spectrum fit
Power-law model
Time interval is from    5.480 sec. to    6.480 sec.

Spectral model in power-law:
------------------------------------------------------------
Parameters  : value       lower 90%   higher 90%
Photon index: -1.00886     ( -0.514144   0.604807 )
Norm@50keV  : 4.65914E-03    ( -0.0015134   0.00146615 )
------------------------------------------------------------
#Fit statistic : Chi-Squared =          87.56 using 59 PHA bins.
# Reduced chi-squared =          1.536 for     57 degrees of freedom
# Null hypothesis probability =   5.733856e-03

Photon flux (15-150 keV)    in 1 sec: 0.536666 ( -0.173582  0.176983 ) ph/cm2/s
Energy fluence (15-150 keV)             : 5.02296e-08 ( -1.58073e-08  1.59936e-08 ) ergs/cm2
Cutoff power-law model
Time interval is from    5.480 sec. to    6.480 sec.
Spectral model in the cutoff power-law:
------------------------------------------------------------
Parameters  : value       lower 90%   higher 90%
Photon index: -0.560037     ( 0.608762   2.66428 )
Epeak [keV] : 159.367      ( -187.223 -187.223 )
Norm@50keV  : 7.79070E-03    ( -0.00386919   0.161256 )
------------------------------------------------------------
#Fit statistic : Chi-Squared =          87.47 using 59 PHA bins.
# Reduced chi-squared =          1.562 for     56 degrees of freedom
# Null hypothesis probability =   4.534824e-03

Photon flux (15-150 keV)    in 1 sec: 0.530573 ( -0.173509  0.179068 ) ph/cm2/s
Energy fluence (15-150 keV)             : 4.89497e-08 ( -1.82708e-08  1.69009e-08 ) ergs/cm2
Time-resolved spectra
Distribution
T90 vs. Hardness ratio plot
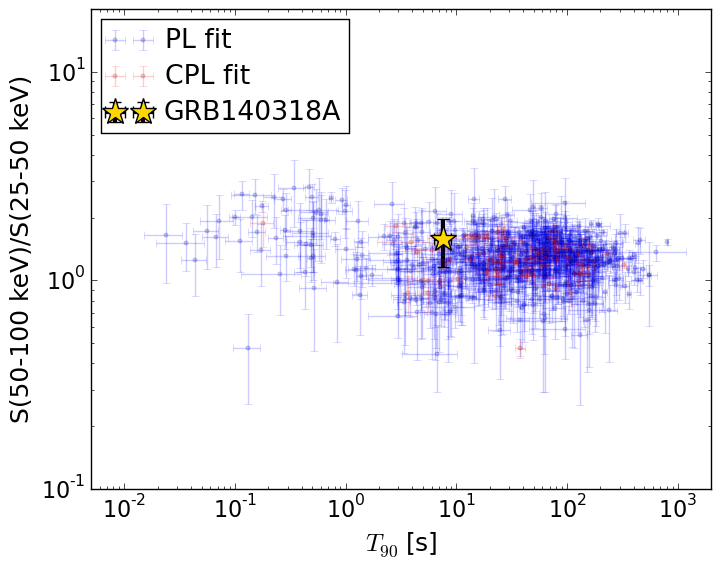
T90                                   = 7.604 sec.
Hardness ratio (energy fluence ratio) = 1.57365677979
S(15-50 keV) vs. S(50-150 keV) plot

S(15-50 keV)  = 9.742331e-08
S(50-150 keV) = 1.8796017e-07
The dash-dotted line and the dashed line traces the fluences calculated from the Band function with Epeak = 15 and 150 keV, respectively. Both lines assume a canonical values of alpha = -1 and beta = -2.5.
Mask shadow pattern
IMX = -3.156132590397236E-01, IMY = -4.412741659074138E-01
Spacecraft aspect plot

Bright source in the pre-burst/pre-slew/post-slew images
Pre-burst image of 15-350 keV band
Time interval of the image:
-239.744000 2.244000

# RAcent  DECcent POSerr Theta    Phi  PeakCts   SNR AngSep     Name
#  [deg]    [deg]    ['] [deg]  [deg]                   [']
244.9761 -15.6424    0.3  50.4   -0.1  19.1982  38.7    0.2	Sco X-1
254.6136  35.4387   21.7  35.9  -77.2   0.3152   0.5    9.6	Her X-1
168.5806  15.7407    2.5  43.9  126.0   3.5909   4.5 ------	UNKNOWN
Pre-slew background subtracted image of 15-350 keV band
Time interval of the image:
2.244000 11.676000

# RAcent  DECcent POSerr Theta    Phi  PeakCts   SNR AngSep     Name
#  [deg]    [deg]    ['] [deg]  [deg]                   [']
245.0505 -15.5720    7.4  50.4   -0.2  -0.1150  -1.6    5.8	Sco X-1
254.3658  35.2148    6.8  35.6  -76.8   0.1058   1.7    8.9	Her X-1
214.5084 -15.0494    2.1  40.2   39.3   0.3433   5.5 ------	UNKNOWN
184.0500  20.2252    1.1  28.5  125.6   0.4460  10.4 ------	UNKNOWN
148.8855  65.8535    2.3  57.3 -167.1   0.6685   5.1 ------	UNKNOWN
Post-slew image of 15-350 keV band
Time interval of the image:
113.356600 303.756630

# RAcent  DECcent POSerr Theta    Phi  PeakCts   SNR AngSep     Name
#  [deg]    [deg]    ['] [deg]  [deg]                   [']
149.1948  -7.0848    2.7  43.8  126.0   2.7197   4.3 ------	UNKNOWN
177.0434  17.8846    2.6   7.0  142.8   0.5963   4.4 ------	UNKNOWN
203.7684  10.1449    2.8  21.5    6.1   0.5617   4.2 ------	UNKNOWN
122.0316  25.7163    3.7  56.9  179.2   3.0381   3.2 ------	UNKNOWN
119.7489  30.1534    4.1  58.3 -175.3   2.7915   2.8 ------	UNKNOWN
119.2978  32.6269    2.7  58.5 -172.4   4.1924   4.3 ------	UNKNOWN