Analysis Summary
Notes:
- 1) No attempt has been made to eliminate the non-significant decimal places.
- 2) This batgrbproduct analysis is done using the HEASARC data.
- 3) This batgrbproduct analysis is using the flight position for the mask-weighting calculation.
======================================================================
BAT GRB EVENT DATA PROCESSING REPORT
Process Script Ver: batgrbproduct v2.46
Process Start Time: Sun Oct 5 00:04:55 EDT 2014
Host Name: batevent1
Current Working Dir: /local/data/batevent/batevent_reproc/trigger592544
======================================================================
Trigger: 00592544 Segment: 000
BAT Trigger Time: 416974377.728 [s; MET]
Trigger Stop: 416974377.984 [s; MET]
UTC: 2014-03-20T02:12:45.946760 [includes UTCF correction]
Where From?: TDRSS position message
BAT
RA: 281.856830560698 Dec: -11.172835071369 [deg; J2000]
Catalogged Source?: NO
Point Source?: YES
GRB Indicated?: YES [ by BAT flight software ]
Image S/N Ratio: 6.8
Image Trigger?: NO
Rate S/N Ratio: 19.5959179422654 [ if not an image trigger ]
Image S/N Ratio: 6.8
Analysis Position: [ source = BAT ]
RA: 281.856830560698 Dec: -11.172835071369 [deg; J2000]
Refined Position: [ source = BAT pre-slew burst ]
RA: 281.835811194701 Dec: -11.1919832729318 [deg; J2000]
{ 18h 47m 20.6s , -11d 11' 31.1" }
+/- 2.52255943837659 [arcmin] (estimated 90% radius based on SNR)
+/- 1.46543651473528 [arcmin] (formal 1-sigma fit error)
SNR: 8.11071657441207
Angular difference between the analysis and refined position is 1.688391 arcmin
Partial Coding Fraction: 0.8828125 [ including projection effects ]
Duration
T90: 0.512000024318695 +/- 0.230755269859374
Measured from: -0.175999999046326
to: 0.336000025272369 [s; relative to TRIGTIME]
T50: 0.191999971866608 +/- 0.143108374017273
Measured from: 0.0160000324249268
to: 0.208000004291534 [s; relative to TRIGTIME]
Fluence
Peak Flux (peak 1 second)
Measured from: -0.356000006198883
to: 0.643999993801117 [s; relative to TRIGTIME]
Total Fluence
Measured from: -0.175999999046326
to: 0.46399998664856 [s; relative to TRIGTIME]
Band 1 Band 2 Band 3 Band 4
15-25 25-50 50-100 100-350 keV
Total 0.019969 0.024756 0.030828 0.007074
0.005268 0.005210 0.004757 0.003948 [error]
Peak 0.021430 0.020716 0.031635 0.006902
0.006544 0.006356 0.005606 0.004725 [error]
[ fluence units of on-axis counts / fully illuminated detector ]
======================================================================
====== Table of the duration information =============================
Value tstart tstop
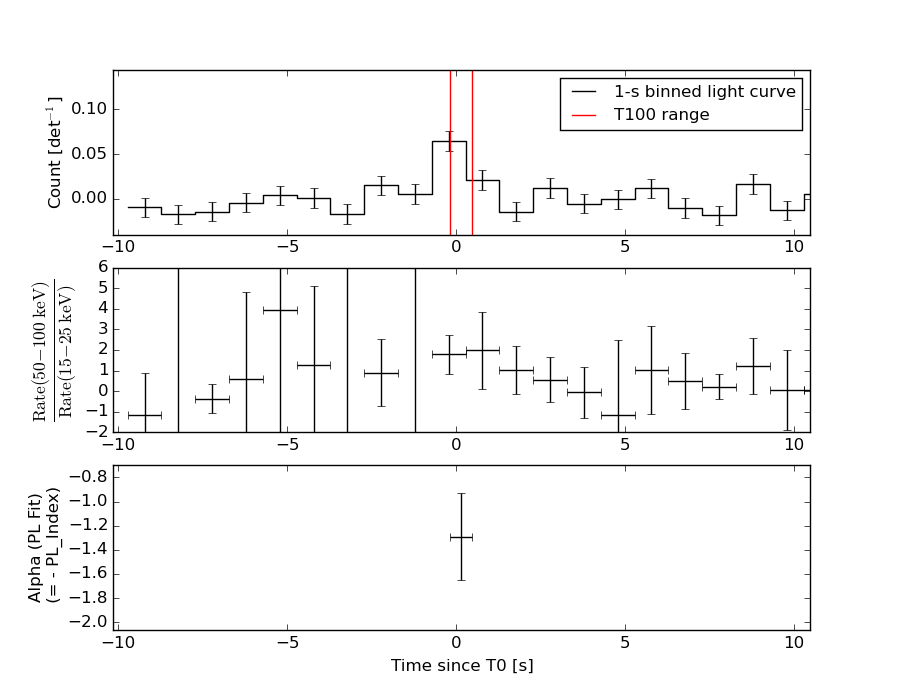
T100 0.640 -0.176 0.464
T90 0.512 -0.176 0.336
T50 0.192 0.016 0.208
Peak 1.000 -0.356 0.644
====== Spectral Analysis Summary =====================================
Model : spectral model: simple power-law (PL) and cutoff power-law (CPL)
Ph_index : photon index: E^{Ph_index}
Ph_90err : 90% error of the photon index
Epeak : Epeak in keV
Epeak_90err: 90% error of Epeak
Norm : normalization at 50 keV in both the PL model and CPL model
Nomr_90err : 90% error of the normalization
chi2 : Chi-Squared
dof : degree of freedo
=== Time-averaged spectral analysis ===
(Best model with acceptable fit: PL)
Model Ph_index Ph_90err_low Ph_90err_hi Epeak Epeak_90err_low Epeak_90err_hi Norm Nomr_90err_low Norm_90err_hi chi2 dof
PL -1.293 -0.359 0.360 - - - 8.28e-03 -1.58e-03 1.57e-03 69.130 57
CPL -1.148 -2.769 1.179 340.817 N/A N/A 9.59e-03 N/A N/A 69.160 56
=== 1-s peak spectral analysis ===
(Best model with acceptable fit: PL)
Model Ph_index Ph_90err_low Ph_90err_hi Epeak Epeak_90err_low Epeak_90err_hi Norm Nomr_90err_low Norm_90err_hi chi2 dof
PL -1.298 -0.468 0.468 - - - 5.20e-03 -1.22e-03 1.22e-03 61.870 57
CPL -1.289 -0.477 0.982 9999.350 -9999.350 -9999.350 5.22e-03 -1.22e-03 1.77e-02 61.870 56
=== Fluence/Peak Flux Summary ===
Model Band1 Band2 Band3 Band4 Band5 Total
15-25 25-50 50-100 100-350 15-150 15-350 keV
Fluence PL 5.57e-09 1.16e-08 1.90e-08 6.98e-08 5.24e-08 1.06e-07 erg/cm2
90%_error_low -1.94e-09 -2.56e-09 -4.56e-09 -3.14e-08 -1.11e-08 -3.51e-08 erg/cm2
90%_error_hi 2.18e-09 2.48e-09 4.43e-09 4.56e-08 1.12e-08 4.71e-08 erg/cm2
Peak flux PL 1.76e-01 2.00e-01 1.63e-01 2.21e-01 6.20e-01 7.61e-01 ph/cm2/s
90%_error_low -7.79e-02 -5.81e-02 -4.71e-02 -1.14e-01 -1.52e-01 -1.82e-01 ph/cm2/s
90%_error_hi 9.32e-02 5.54e-02 4.49e-02 1.71e-01 1.54e-01 1.87e-01 ph/cm2/s
Fluence CPL 4.34e-09 6.03e-09 6.48e-09 1.61e-08 2.11e-08 3.29e-08 erg/cm2
90%_error_low N/A -2.13e-09 -4.35e-09 -9.60e-09 -1.42e-08 -2.14e-08 erg/cm2
90%_error_hi N/A 1.62e-09 3.28e-09 4.95e-09 1.12e-08 1.33e-08 erg/cm2
Peak flux CPL 1.83e-01 2.00e-01 1.62e-01 2.20e-01 6.21e-01 7.63e-01 ph/cm2/s
90%_error_low N/A N/A N/A N/A N/A -2.53e-01 ph/cm2/s
90%_error_hi N/A N/A N/A N/A N/A 1.83e-01 ph/cm2/s
======================================================================
Image
Pre-slew 15.0-350.0 keV image (Event data)
#   RAcent    DECcent   POSerr    Theta     Phi              Peak Cts       SNR   Name
  281.8358   -11.1920   0.0237    26.8111  -172.8743         0.0793030      8.111 TRIG_00592544

Foreground time interval of the image:
 -0.176   0.464 (delta_t =   0.640 [sec])
Background time interval of the image:
-239.728  -0.176 (delta_t = 239.552 [sec])
Light Curves
Note: The mask-weighted lightcurves have units of either count/det or counts/sec/det, where a det is 0.4 x 0.4 = 0.16 sq cm.
Full-time range; 1 s binning
Other quick-look light curves:
- 64 ms binning (zoomed)
- 16 ms binning (zoomed)
- 8 ms binning (zoomed)
- 2 ms binning (zoomed)
- SN=5 or 10 s binning (full-time range)
- Raw light curve
Spectra
- 64 ms binning (zoomed)
- 16 ms binning (zoomed)
- 8 ms binning (zoomed)
- 2 ms binning (zoomed)
- SN=5 or 10 s binning (full-time range)
- Raw light curve
Spectra
Notes:
- 1) The fitting includes the systematic errors.
- 2) When the burst includes telescope slew time periods, the fitting uses an average response file made from multiple 5-s response files through out the slew time plus single time preiod for the non-slew times, and weighted by the total counts in the corresponding time period using addrmf. An average response file is needed becuase a spectral fit using the pre-slew DRM will introduce some errors in both a spectral shape and a normalization if the PHA file contains a lot of the slew/post-slew time interval.
- 3) For fits to more complicated models (e.g. a power-law over a cutoff power-law), the BAT team has decided to require a chi-square improvement of more than 6 for each extra dof.
Time averaged spectrum fit using the average DRM
Power-law model
Time interval is from   -0.176 sec. to    0.464 sec.

Spectral model in power-law:
------------------------------------------------------------
Parameters  : value       lower 90%   higher 90%
Photon index: -1.29291     ( -0.358754   0.359623 )
Norm@50keV  : 8.27767E-03    ( -0.00157527   0.00157456 )
------------------------------------------------------------
#Fit statistic : Chi-Squared =          69.13 using 59 PHA bins.
# Reduced chi-squared =          1.213 for     57 degrees of freedom
# Null hypothesis probability =   1.302202e-01

Photon flux (15-150 keV)    in 0.64 sec: 0.986275 ( -0.194615  0.195865 ) ph/cm2/s
Energy fluence (15-150 keV)             : 5.24481e-08 ( -1.10796e-08  1.12124e-08 ) ergs/cm2
Cutoff power-law model
Time interval is from   -0.176 sec. to    0.464 sec.
Spectral model in the cutoff power-law:
------------------------------------------------------------
Parameters  : value       lower 90%   higher 90%
Photon index: -2.61932     ( -1.29735   2.6498 )
Epeak [keV] : 195.816      (   )
Norm@50keV  : 1.65185E-03    (     )
------------------------------------------------------------
#Fit statistic : Chi-Squared =          68.71 using 59 PHA bins.
# Reduced chi-squared =          1.227 for     56 degrees of freedom
# Null hypothesis probability =   1.185618e-01

Photon flux (15-150 keV)    in 0.64 sec: 0.986130 ( -0.207073  0.19451 ) ph/cm2/s
Energy fluence (15-150 keV)             : 2.11048e-08 ( -1.41987e-08  1.12352e-08 ) ergs/cm2
1-s peak spectrum fit
Power-law model

Time interval is from   -0.356 sec. to    0.644 sec.

Spectral model in power-law:
------------------------------------------------------------
Parameters  : value       lower 90%   higher 90%
Photon index: -1.29788     ( -0.4682   0.467566 )
Norm@50keV  : 5.20299E-03    ( -0.00121617   0.00121597 )
------------------------------------------------------------
#Fit statistic : Chi-Squared =          61.87 using 59 PHA bins.
# Reduced chi-squared =          1.085 for     57 degrees of freedom
# Null hypothesis probability =   3.064582e-01

Photon flux (15-150 keV)    in 1 sec: 0.620492 ( -0.152361  0.153587 ) ph/cm2/s
Energy fluence (15-150 keV)             : 5.14482e-08 ( -1.32977e-08  1.34496e-08 ) ergs/cm2
Cutoff power-law model
Time interval is from   -0.356 sec. to    0.644 sec.
Spectral model in the cutoff power-law:
------------------------------------------------------------
Parameters  : value       lower 90%   higher 90%
Photon index: -1.2887     ( -0.473393   0.985599 )
Epeak [keV] : 9999.35      ( -9999.36 -9999.36 )
Norm@50keV  : 5.21921E-03    ( -0.00122214   0.0176891 )
------------------------------------------------------------
#Fit statistic : Chi-Squared =          61.87 using 59 PHA bins.
# Reduced chi-squared =          1.105 for     56 degrees of freedom
# Null hypothesis probability =   2.744954e-01

Photon flux (15-150 keV)    in 1 sec: 0.620525 (    ) ph/cm2/s
Energy fluence (15-150 keV)             : 5.16214e-08 ( 0  0 ) ergs/cm2
Time-resolved spectra
Distribution
T90 vs. Hardness ratio plot
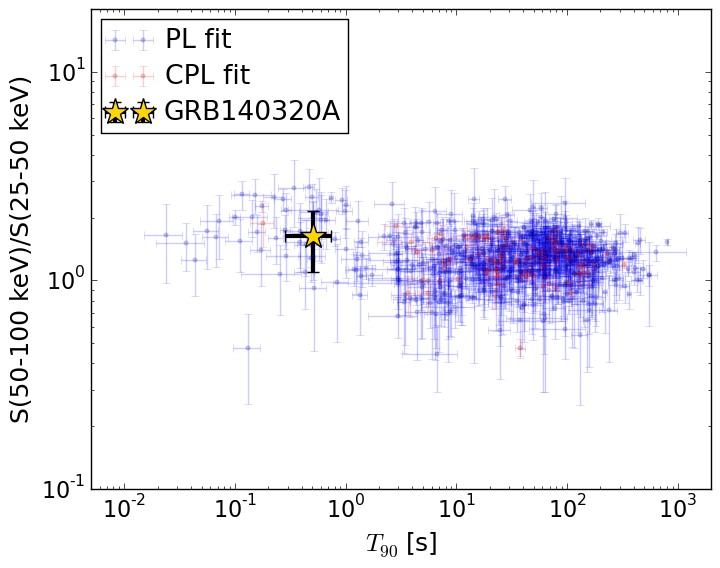
T90                                   = 0.512 sec.
Hardness ratio (energy fluence ratio) = 1.6325631759
S(15-50 keV) vs. S(50-150 keV) plot
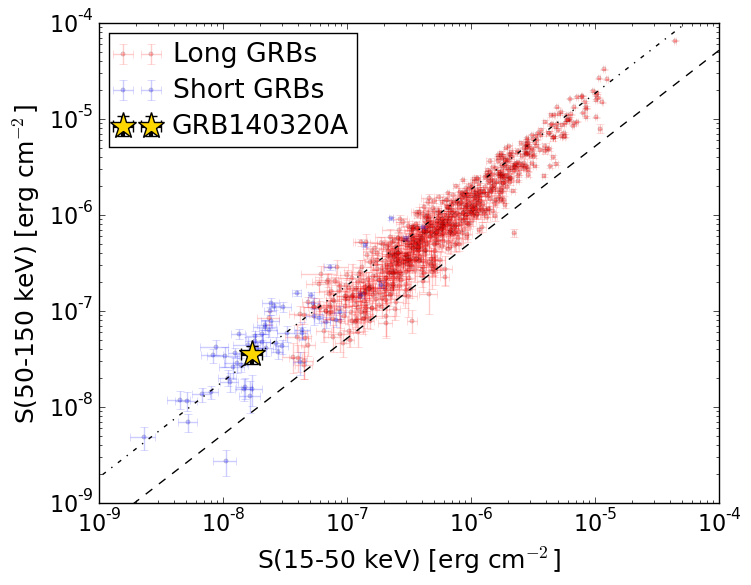
S(15-50 keV)  = 1.7200072e-08
S(50-150 keV) = 3.524863e-08
The dash-dotted line and the dashed line traces the fluences calculated from the Band function with Epeak = 15 and 150 keV, respectively. Both lines assume a canonical values of alpha = -1 and beta = -2.5.
Mask shadow pattern
IMX = -5.014766492289734E-01, IMY = 6.269090877061936E-02
Spacecraft aspect plot
Bright source in the pre-burst/pre-slew/post-slew images
Pre-burst image of 15-350 keV band
Time interval of the image:
-239.728000 -0.176000

# RAcent  DECcent POSerr Theta    Phi  PeakCts   SNR AngSep     Name
#  [deg]    [deg]    ['] [deg]  [deg]                   [']
244.9794 -15.6142    1.7  41.0  124.2   5.1467   6.7    1.6	Sco X-1
255.9859 -37.8389    1.2  22.2   93.6   2.4398   9.3    0.3	4U 1700-377
256.6092 -36.5397    5.4  21.9   97.3   0.5530   2.1   10.9	GX 349+2
263.1092 -24.7235    2.8  22.2  132.5   0.9315   4.0    5.6	GX 1+4
264.7363 -44.4958    4.6  16.0   71.7   0.5421   2.5    2.8	4U 1735-44
268.2579  -1.6215    0.0  39.1  166.5   0.4978   1.4   12.1	SW J1753.5-0127
270.1394 -25.0630    4.1  17.5  145.4   0.6157   2.8    7.9	GX 5-1
270.2569 -25.6985    4.3  17.0  144.3   0.5934   2.7    3.6	GRS 1758-258
274.1382 -13.9629    6.9  25.6  169.1   0.4334   1.7    8.9	GX 17+2
275.7844 -30.3922    3.4  10.2  147.1   0.6996   3.4    7.4	H1820-303
285.1201 -24.7541    7.2  13.2 -164.0   0.4094   1.6   11.0	HT1900.1-2455
288.8445  10.9255    1.5  49.0 -161.7   3.7926   7.6    3.0	GRS 1915+105
263.1231 -33.9086    3.0  17.5  109.1   0.8419   3.8    8.0	GX 354-0
265.6935 -27.7292    1.4  18.5  130.2   1.8750   8.5 ------	UNKNOWN
266.1202 -28.7476    0.3  17.6  128.3   7.3542  32.9 ------	UNKNOWN
270.0268 -13.9124    2.4  27.1  160.8   1.1986   4.9 ------	UNKNOWN
268.1997  15.8296    2.3  55.8  173.5   5.4807   5.0 ------	UNKNOWN
 15.9170 -59.3305    3.0  58.9  -24.3   7.7711   3.8 ------	UNKNOWN
331.0116 -25.9428    2.6  41.1  -80.7   5.4316   4.5 ------	UNKNOWN
Pre-slew background subtracted image of 15-350 keV band
Time interval of the image:
-0.176000 0.464000

# RAcent  DECcent POSerr Theta    Phi  PeakCts   SNR AngSep     Name
#  [deg]    [deg]    ['] [deg]  [deg]                   [']
244.9864 -15.5140    3.9  41.1  124.4  -0.0970  -3.0    7.6	Sco X-1
255.8064 -37.7599    4.0  22.3   93.8   0.0327   2.9    9.9	4U 1700-377
256.3203 -36.5557    4.7  22.1   97.1   0.0270   2.5    9.7	GX 349+2
263.0112 -24.7455 2700.0  22.3  132.3  -0.0000  -0.0    0.1	GX 1+4
264.8226 -44.3065  642.2  15.9   72.3   0.0002   0.0    9.3	4U 1735-44
268.4235  -1.2928    3.0  39.4  166.9   0.0546   3.8   10.2	SW J1753.5-0127
270.1747 -24.9411    4.7  17.6  145.7  -0.0216  -2.5   10.2	GX 5-1
270.1314 -25.6106    0.0  17.1  144.2   0.0274   3.1   12.2	GRS 1758-258
273.9053 -13.9758   10.0  25.6  168.6   0.0112   1.2    6.9	GX 17+2
275.9555 -30.2901    3.7  10.2  148.1   0.0265   3.1    4.9	H1820-303
285.0328 -24.9209  119.5  13.0 -164.3  -0.0009  -0.1    0.2	HT1900.1-2455
288.8159  11.0870   81.9  49.2 -161.8   0.0028   0.1    8.6	GRS 1915+105
263.1574 -33.9738   42.9  17.4  108.9  -0.0027  -0.3   11.8	GX 354-0
227.9640 -61.7033    2.6  41.5   48.7   0.1157   4.5 ------	UNKNOWN
281.8349 -11.1928    1.4  26.8 -172.9   0.0798   8.2 ------	UNKNOWN
347.4629 -69.2165    2.1  45.5  -14.2   0.0841   5.5 ------	UNKNOWN
Post-slew image of 15-350 keV band
Time interval of the image:
64.372600 288.572600

# RAcent  DECcent POSerr Theta    Phi  PeakCts   SNR AngSep     Name
#  [deg]    [deg]    ['] [deg]  [deg]                   [']
244.9643 -15.6628    1.4  36.1   81.1   4.7610   8.3    1.6	Sco X-1
256.0818 -37.8705    2.6  35.3   38.9   1.5203   4.5    4.8	4U 1700-377
256.4219 -36.5403   15.4  34.2   40.3   0.2601   0.7    7.1	GX 349+2
262.8525 -24.5886  420.2  22.5   53.2   0.0067   0.0   12.7	GX 1+4
264.6458 -44.3130    3.7  36.3   23.4   0.9334   3.1    9.2	4U 1735-44
268.2202  -1.4562    6.0  16.7  127.2  -0.4032  -1.9    8.9	SW J1753.5-0127
270.2528 -24.9714    9.1  17.6   39.4   0.2577   1.3    6.7	GX 5-1
270.3709 -25.7817    3.0  18.2   37.5   0.8046   3.9    4.4	GRS 1758-258
273.8507 -13.9890    4.1   8.3   71.8   0.5692   2.8    9.5	GX 17+2
275.7624 -30.2692    3.5  19.9   18.0   0.6849   3.2   10.3	H1820-303
285.1964 -24.9145    8.6  14.1  -10.2   0.2962   1.3    8.7	HT1900.1-2455
288.8027  10.9687    0.8  23.2 -160.1   3.4217  14.4    1.4	GRS 1915+105
299.5761  35.2152    1.5  49.3 -158.5   4.2461   7.9    1.1	Cyg X-1
308.2685  40.8244    9.3  57.5 -154.1  -1.8469  -1.3   10.5	Cyg X-3
262.9877 -33.7902    3.7  28.4   36.8   0.7955   3.2    2.7	GX 354-0
265.6420 -27.7410    1.7  22.5   42.7   1.5608   6.8 ------	UNKNOWN
266.1379 -28.7451    0.4  22.9   40.0   7.6896  32.7 ------	UNKNOWN
277.3813 -23.7814    2.2  13.3   20.5   1.0882   5.1 ------	UNKNOWN
294.9358 -10.9606    2.4  12.8  -87.3   1.0165   4.8 ------	UNKNOWN
315.9326 -45.8908    5.6  45.2  -31.0   0.8629   2.1 ------	UNKNOWN
321.4313   1.6304    3.4  41.4 -103.2   4.4118   3.4 ------	UNKNOWN
	UNKNOWN