Analysis Summary
Notes:
- 1) No attempt has been made to eliminate the non-significant decimal places.
- 2) This batgrbproduct analysis is done using the HEASARC data.
- 3) This batgrbproduct analysis is using the flight position for the mask-weighting calculation.
======================================================================
                  BAT GRB EVENT DATA PROCESSING REPORT
    Process Script Ver: batgrbproduct v2.46
    Process Start Time: Sat Oct  4 23:50:09 EDT 2014
             Host Name: batevent1
   Current Working Dir: /local/data/batevent/batevent_reproc/trigger595141
======================================================================

  Trigger: 00595141      Segment: 000

  BAT Trigger Time: 418655766.656   [s; MET]
      Trigger Stop: 418655768.704   [s; MET]
               UTC: 2014-04-08T13:15:54.794960    [includes UTCF correction]
       Where From?: TDRSS position message

  BAT
    RA: 290.684540061204   Dec: -12.578173144477  [deg; J2000]

     Catalogged Source?: NO
     Point Source?:      YES
     GRB Indicated?:     YES    [ by BAT flight software ]
     Image S/N Ratio:    7.83
     Image Trigger?:     NO
     Rate S/N Ratio:     11.7046999107196  [ if not an image trigger ]
     Image S/N Ratio:    7.83

  Analysis Position:   [ source = BAT ]
    RA: 290.684540061204   Dec: -12.578173144477  [deg; J2000]

  Refined Position:   [ source = BAT pre-slew burst ]
    RA: 290.721755011471   Dec: -12.5845738421696  [deg; J2000]
        { 19h 22m 53.2s , -12d 35' 04.5" }
         +/- 1.8711852608461 [arcmin] (estimated 90% radius based on SNR)
         +/- 0.900254967281793 [arcmin] (formal 1-sigma fit error)
    SNR: 12.4273952602332

  Angular difference between the analysis and refined position is 2.212860 arcmin

  Partial Coding Fraction: 0.4023438    [ including projection effects ]

  Duration
     T90: 3.62799996137619 +/- 0.606155095312045
        Measured from: -0.540000021457672
                   to: 3.08799993991852     [s; relative to TRIGTIME]
     T50: 1.82399994134903 +/- 0.579889597109368
        Measured from: 0.236000001430511
                   to: 2.05999994277954     [s; relative to TRIGTIME]


  Fluence
     Peak Flux  (peak 1 second)
        Measured from: 0.719999969005585
                   to: 1.71999996900558     [s; relative to TRIGTIME]
     Total Fluence
        Measured from: -0.680000007152557
                   to: 3.44799995422363     [s; relative to TRIGTIME]

             Band 1     Band 2     Band 3     Band 4
              15-25      25-50     50-100    100-350     keV
 Total     0.148278   0.143476   0.170564   0.042135
           0.023677   0.023369   0.019813   0.019513 [error]
 Peak      0.056499   0.043170   0.050020   0.023436
           0.011965   0.011736   0.010168   0.009711 [error]

     [ fluence units of on-axis counts / fully illuminated detector ]

======================================================================


====== Table of the duration information =============================

        Value   tstart    tstop
T100    4.128   -0.680    3.448
T90     3.628   -0.540    3.088
T50     1.824    0.236    2.060
Peak    1.000    0.720    1.720


====== Spectral Analysis Summary =====================================

Model      : spectral model: simple power-law (PL) and cutoff power-law (CPL)
Ph_index   : photon index: E^{Ph_index}
Ph_90err   : 90% error of the photon index
Epeak      : Epeak in keV
Epeak_90err: 90% error of Epeak
Norm       : normalization at 50 keV in both the PL model and CPL model
Nomr_90err : 90% error of the normalization
chi2       : Chi-Squared
dof        : degree of freedo

=== Time-averaged spectral analysis ===
(Best model with acceptable fit: PL)

Model Ph_index Ph_90err_low Ph_90err_hi  Epeak  Epeak_90err_low  Epeak_90err_hi  Norm       Nomr_90err_low    Norm_90err_hi    chi2    dof
PL      -1.488    -0.245      0.245       -           -               -         8.30e-03     -1.15e-03          1.15e-03      58.100   57
CPL     -1.002    -0.683      1.172      109.210     -45.483      -109.210      1.41e-02     -6.80e-03          3.41e-02      57.350   56


=== 1-s peak spectral analysis ===
(Best model with acceptable fit: PL)

Model Ph_index Ph_90err_low Ph_90err_hi  Epeak  Epeak_90err_low  Epeak_90err_hi  Norm       Nomr_90err_low    Norm_90err_hi    chi2    dof
PL      -1.699     -0.421     0.404       -           -               -         1.07e-02     -2.52e-03          2.43e-03      66.570   57
CPL     -1.713     -0.408     0.578     9999.360    -9999.350      -9999.360      1.06e-02     -1.06e-02          2.57e-02      66.580   56


=== Fluence/Peak Flux Summary ===

              Model    Band1     Band2     Band3     Band4     Band5     Total
                       15-25     25-50    50-100    100-350    15-150    15-350    keV
Fluence         PL   4.32e-08  8.00e-08  1.14e-07  3.43e-07  3.26e-07  5.81e-07   erg/cm2
      90%_error_low -1.04e-08 -1.21e-08 -2.01e-08 -1.15e-07 -4.86e-08 -1.32e-07   erg/cm2
      90%_error_hi   1.12e-08  1.19e-08  1.98e-08  1.49e-07  4.90e-08  1.59e-07   erg/cm2
Peak flux       PL   5.33e-01  4.77e-01  2.94e-01  2.75e-01  1.42e+00  1.58e+00   ph/cm2/s
      90%_error_low -1.87e-01 -1.08e-01 -8.96e-02 -1.39e-01 -3.12e-01 -3.38e-01   ph/cm2/s
      90%_error_hi   2.04e-01  1.06e-01  8.77e-02  2.07e-01  3.13e-01  3.39e-01   ph/cm2/s

Fluence        CPL   3.91e-08  8.32e-08  1.19e-07  1.84e-07  3.16e-07  4.25e-07   erg/cm2
      90%_error_low -1.32e-08 -1.36e-08 -2.22e-08 -1.22e-07 -5.20e-08 -1.34e-07   erg/cm2
      90%_error_hi   1.36e-08  1.42e-08  2.30e-08  2.75e-07  5.22e-08  2.13e-07   erg/cm2
Peak flux      CPL   5.08e-01  3.80e-01  1.97e-01  1.73e-01  1.16e+00  1.26e+00   ph/cm2/s
      90%_error_low     N/A   -1.82e-01 -8.75e-02 -8.14e-02     N/A   -5.83e-01   ph/cm2/s
      90%_error_hi      N/A    1.66e-01  4.66e-02  5.70e-02     N/A    3.32e-01   ph/cm2/s

======================================================================
Image
Pre-slew 15.0-350.0 keV image (Event data)
#   RAcent    DECcent   POSerr    Theta     Phi              Peak Cts       SNR   Name
  290.7218   -12.5846   0.0155    40.3269  -142.3042         0.5638398     12.427 TRIG_00595141

Foreground time interval of the image:
 -0.680   3.448 (delta_t =   4.128 [sec])
Background time interval of the image:
-179.656  -0.680 (delta_t = 178.976 [sec])
Light Curves
Note: The mask-weighted lightcurves have units of either count/det or counts/sec/det, where a det is 0.4 x 0.4 = 0.16 sq cm.
Full-time range; 1 s binning
Other quick-look light curves:
- 64 ms binning (zoomed)
- 16 ms binning (zoomed)
- 8 ms binning (zoomed)
- 2 ms binning (zoomed)
- SN=5 or 10 s binning (full-time range)
- Raw light curve
Spectra
- 64 ms binning (zoomed)
- 16 ms binning (zoomed)
- 8 ms binning (zoomed)
- 2 ms binning (zoomed)
- SN=5 or 10 s binning (full-time range)
- Raw light curve
Spectra
Notes:
- 1) The fitting includes the systematic errors.
- 2) When the burst includes telescope slew time periods, the fitting uses an average response file made from multiple 5-s response files through out the slew time plus single time preiod for the non-slew times, and weighted by the total counts in the corresponding time period using addrmf. An average response file is needed becuase a spectral fit using the pre-slew DRM will introduce some errors in both a spectral shape and a normalization if the PHA file contains a lot of the slew/post-slew time interval.
- 3) For fits to more complicated models (e.g. a power-law over a cutoff power-law), the BAT team has decided to require a chi-square improvement of more than 6 for each extra dof.
Time averaged spectrum fit using the average DRM
Power-law model
Time interval is from   -0.680 sec. to    3.448 sec.

Spectral model in power-law:
------------------------------------------------------------
Parameters  : value       lower 90%   higher 90%
Photon index: -1.48814     ( -0.245436   0.244904 )
Norm@50keV  : 8.29607E-03    ( -0.00115257   0.0011494 )
------------------------------------------------------------
#Fit statistic : Chi-Squared =          58.10 using 59 PHA bins.
# Reduced chi-squared =          1.019 for     57 degrees of freedom
# Null hypothesis probability =   4.345988e-01

Photon flux (15-150 keV)    in 4.128 sec: 1.03243 ( -0.148818  0.14958 ) ph/cm2/s
Energy fluence (15-150 keV)             : 3.25559e-07 ( -4.85527e-08  4.89824e-08 ) ergs/cm2
Cutoff power-law model
Time interval is from   -0.680 sec. to    3.448 sec.
Spectral model in the cutoff power-law:
------------------------------------------------------------
Parameters  : value       lower 90%   higher 90%
Photon index: -1.00243     ( -0.683175   1.1715 )
Epeak [keV] : 109.210      ( -45.4831 -109.211 )
Norm@50keV  : 1.41411E-02    ( -0.00679768   0.0340647 )
------------------------------------------------------------
#Fit statistic : Chi-Squared =          57.35 using 59 PHA bins.
# Reduced chi-squared =          1.024 for     56 degrees of freedom
# Null hypothesis probability =   4.249318e-01

Photon flux (15-150 keV)    in 4.128 sec: 1.00549 ( -0.159276  0.15823 ) ph/cm2/s
Energy fluence (15-150 keV)             : 3.16191e-07 ( -5.19686e-08  5.22258e-08 ) ergs/cm2
1-s peak spectrum fit
Power-law model

Time interval is from    0.720 sec. to    1.720 sec.

Spectral model in power-law:
------------------------------------------------------------
Parameters  : value       lower 90%   higher 90%
Photon index: -1.69892     ( -0.420587   0.40416 )
Norm@50keV  : 1.06899E-02    ( -0.00252116   0.00243418 )
------------------------------------------------------------
#Fit statistic : Chi-Squared =          66.57 using 59 PHA bins.
# Reduced chi-squared =          1.168 for     57 degrees of freedom
# Null hypothesis probability =   1.807173e-01

Photon flux (15-150 keV)    in 1 sec: 1.41927 ( -0.31209  0.31289 ) ph/cm2/s
Energy fluence (15-150 keV)             : 9.89988e-08 ( -2.38988e-08  2.43514e-08 ) ergs/cm2
Cutoff power-law model
Time interval is from    0.720 sec. to    1.720 sec.
Spectral model in the cutoff power-law:
------------------------------------------------------------
Parameters  : value       lower 90%   higher 90%
Photon index: -1.71319     ( -0.411527   0.57436 )
Epeak [keV] : 9999.36      ( -9999.35 -9999.36 )
Norm@50keV  : 1.06154E-02    ( -0.010682   0.0256653 )
------------------------------------------------------------
#Fit statistic : Chi-Squared =          66.58 using 59 PHA bins.
# Reduced chi-squared =          1.189 for     56 degrees of freedom
# Null hypothesis probability =   1.573855e-01

Photon flux (15-150 keV)    in 1 sec: 1.15754 (    ) ph/cm2/s
Energy fluence (15-150 keV)             : 9.89145e-08 ( -2.39596e-08  2.67898e-08 ) ergs/cm2
Time-resolved spectra
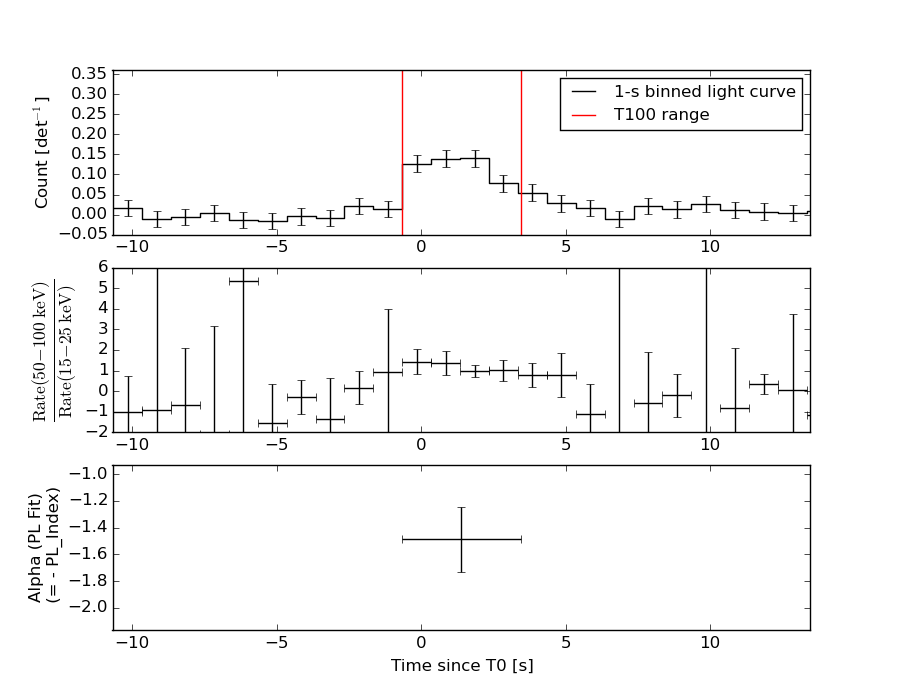
Distribution
T90 vs. Hardness ratio plot
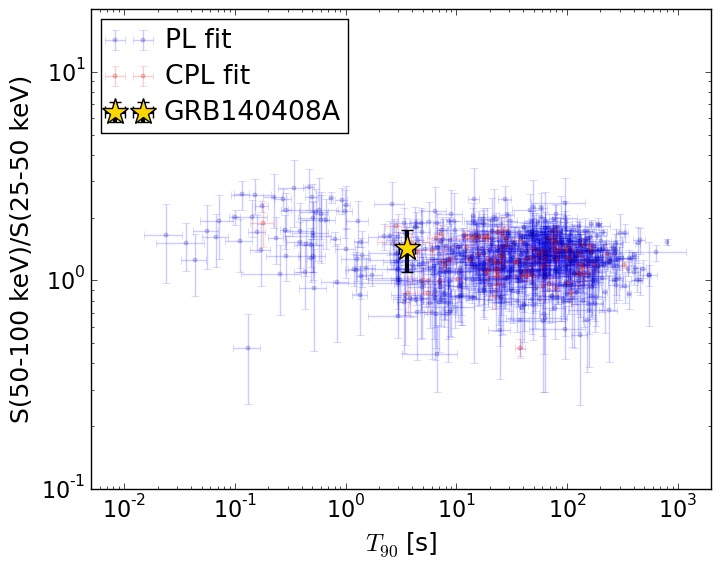
T90                                   = 3.628 sec.
Hardness ratio (energy fluence ratio) = 1.42593550188
S(15-50 keV) vs. S(50-150 keV) plot
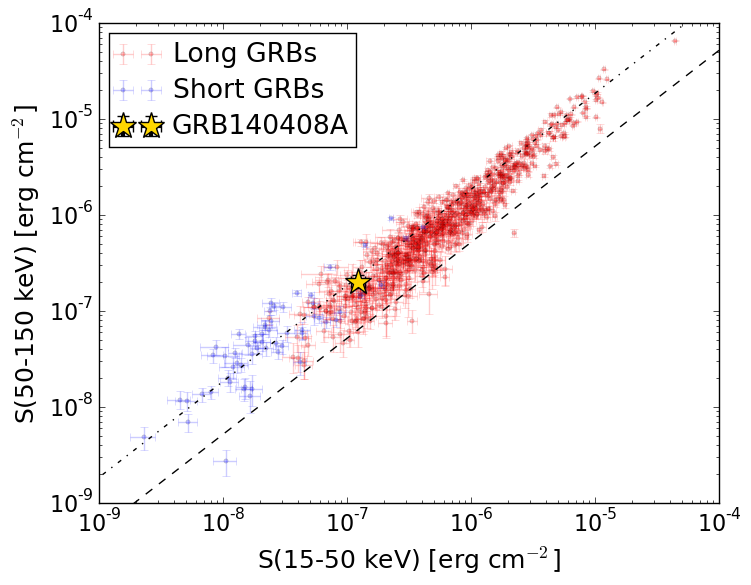
S(15-50 keV)  = 1.2328771e-07
S(50-150 keV) = 2.0226841e-07
The dash-dotted line and the dashed line traces the fluences calculated from the Band function with Epeak = 15 and 150 keV, respectively. Both lines assume a canonical values of alpha = -1 and beta = -2.5.
Mask shadow pattern
IMX = -6.716837489736525E-01, IMY = 5.190579036363208E-01
Spacecraft aspect plot

Bright source in the pre-burst/pre-slew/post-slew images
Pre-burst image of 15-350 keV band
Time interval of the image:
-179.656000 -0.680000

# RAcent  DECcent POSerr Theta    Phi  PeakCts   SNR AngSep     Name
#  [deg]    [deg]    ['] [deg]  [deg]                   [']
170.6174 -60.6159   69.0  54.3   18.4   0.2564   0.2    8.9	Cen X-3
186.8229 -62.8265    8.0  46.3   17.8   0.8657   1.4    5.7	GX 301-2
244.9780 -15.6359    0.7  26.7  134.3   5.5813  16.4    0.3	Sco X-1
255.9897 -37.8128    1.3   2.5  139.2   2.1836   8.6    1.9	4U 1700-377
256.3539 -36.4662    2.9   3.7  151.0   1.0265   3.9    4.7	GX 349+2
262.8278 -24.7989    4.5  16.0 -179.9   0.7033   2.5   10.4	GX 1+4
264.5041 -44.5150    7.3   7.0  -67.3  -0.4121  -1.6   10.9	4U 1735-44
268.4669  -1.3229    6.6  40.1  178.9   0.7650   1.8    9.8	SW J1753.5-0127
270.2500 -25.0679    4.0  18.6 -158.8   0.7860   2.9    2.0	GX 5-1
270.4082 -25.8774    6.9  18.0 -157.0   0.4445   1.7    9.9	GRS 1758-258
274.1462 -14.0150    3.2  30.0 -164.3   1.1115   3.6    8.3	GX 17+2
275.8207 -30.2038    6.5  18.1 -136.1   0.4678   1.8   11.2	H1820-303
285.1174 -24.9343    4.7  27.8 -133.3   0.8316   2.4    4.5	HT1900.1-2455
288.7992  10.9481  915.5  58.9 -161.8  -0.0239  -0.0    0.2	GRS 1915+105
262.9326 -33.8102    4.9   7.8 -160.9   0.6570   2.4    3.2	GX 354-0
185.7668 -47.8683    2.9  50.1   37.2   5.3090   4.0 ------	UNKNOWN
249.6329   8.3216    2.6  49.0  151.3   5.0986   4.4 ------	UNKNOWN
240.5999 -46.5310    3.4  13.6   37.8   0.8792   3.4 ------	UNKNOWN
237.3162 -60.7820    3.4  24.0    5.3   0.9318   3.4 ------	UNKNOWN
265.6768 -27.7041    2.0  14.3 -166.7   1.6028   5.7 ------	UNKNOWN
266.1067 -28.7364    1.3  13.5 -163.2   2.5229   8.7 ------	UNKNOWN
	UNKNOWN
	UNKNOWN
	UNKNOWN
	UNKNOWN
Pre-slew background subtracted image of 15-350 keV band
Time interval of the image:
-0.680000 3.448000

# RAcent  DECcent POSerr Theta    Phi  PeakCts   SNR AngSep     Name
#  [deg]    [deg]    ['] [deg]  [deg]                   [']
170.4055 -60.6013    4.3  54.4   18.3  -0.4435  -2.6    2.9	Cen X-3
186.6316 -62.6590    8.4  46.4   18.0  -0.0831  -1.4    6.7	GX 301-2
245.0820 -15.5263    3.6  26.8  134.6  -0.1070  -3.2    9.0	Sco X-1
256.1718 -37.8802    4.8   2.4  141.8  -0.0622  -2.4    9.0	4U 1700-377
256.6724 -36.3305    0.0   3.8  155.1  -0.0139  -0.6   12.7	GX 349+2
263.1331 -24.8143    4.0  16.1 -178.9   0.0741   2.9    7.9	GX 1+4
264.5382 -44.4170    7.1   6.9  -68.1  -0.0412  -1.6    9.0	4U 1735-44
268.4322  -1.4159    7.0  40.0  178.9   0.0675   1.6    4.4	SW J1753.5-0127
270.1722 -24.9036    3.4  18.7 -159.3   0.0848   3.4   12.2	GX 5-1
270.3312 -25.5962   55.4  18.2 -157.7  -0.0052  -0.2    8.9	GRS 1758-258
274.0380 -14.1536    5.6  29.9 -164.4  -0.0578  -2.1    7.3	GX 17+2
276.0740 -30.5362    0.0  18.1 -134.9  -0.0617  -2.3   12.7	H1820-303
285.1932 -25.0595    6.3  27.8 -133.0   0.0566   1.8   11.9	HT1900.1-2455
288.7186  10.8191    0.0  58.7 -161.8   0.0615   0.4    8.9	GRS 1915+105
262.7692 -33.9396    0.0   7.6 -161.2  -0.0171  -0.7   12.6	GX 354-0
200.1067 -40.8993    2.3  42.6   50.9   0.4341   4.9 ------	UNKNOWN
264.0913  14.1838    2.2  54.7  169.5   0.7005   5.2 ------	UNKNOWN
266.4987  11.0987    2.2  52.0  172.9   0.4689   5.3 ------	UNKNOWN
279.0894  13.4474    2.5  57.3 -173.2   0.5963   4.6 ------	UNKNOWN
290.7218 -12.5846    0.9  40.3 -142.3   0.5637  12.4 ------	UNKNOWN
Post-slew image of 15-350 keV band
Time interval of the image:
89.244630 902.420500

# RAcent  DECcent POSerr Theta    Phi  PeakCts   SNR AngSep     Name
#  [deg]    [deg]    ['] [deg]  [deg]                   [']
255.8113 -37.8718    6.9  40.0   52.7   5.6205   1.7    8.5	4U 1700-377
256.6092 -36.3684   60.8  38.7   54.2  -0.5901  -0.2    9.0	GX 349+2
262.9137 -24.8741   22.4  28.9   69.0   1.0714   0.5    9.3	GX 1+4
264.5576 -44.3982    6.2  38.9   38.2   4.5816   1.9    8.5	4U 1735-44
268.5158  -1.4827    9.1  24.6  123.2  -2.0830  -1.3    9.0	SW J1753.5-0127
270.2430 -25.1257    2.8  23.0   62.1   6.2507   4.2    3.6	GX 5-1
270.4743 -25.8688   12.7  23.2   60.2  -1.3784  -0.9   12.0	GRS 1758-258
273.8624 -14.1910    0.0  16.4   90.6   3.4879   2.2   12.5	GX 17+2
275.9651 -30.3537    6.2  22.4   43.2   2.6754   1.9    2.2	H1820-303
284.8719 -24.9136    3.3  13.5   31.3   4.6127   3.5    8.9	HT1900.1-2455
288.8105  10.9540    1.4  23.6 -176.5  10.9470   8.3    0.9	GRS 1915+105
299.5162  35.2024    2.4  48.5 -162.3  14.9635   4.8    3.6	Cyg X-1
308.0066  40.8748    8.0  55.8 -156.1  -9.8015  -1.5    6.6	Cyg X-3
262.9003 -33.8257    2.8  33.0   53.4   9.0430   4.2    4.5	GX 354-0
252.7816 -52.5430    3.0  50.1   37.2  22.5962   3.8 ------	UNKNOWN
266.1742 -28.7448    1.4  27.9   59.0  15.8285   8.3 ------	UNKNOWN
283.2864 -24.3714    3.1  13.7   37.7   4.9596   3.8 ------	UNKNOWN
306.0107 -63.5611    3.2  52.1   -0.5  12.8295   3.6 ------	UNKNOWN
310.4419 -68.2617    2.6  57.1   -0.5  28.3175   4.4 ------	UNKNOWN
317.8568 -16.4049    2.4  26.6  -70.4   8.0264   4.8 ------	UNKNOWN
322.6944  21.2497    3.0  46.2 -128.7  22.3686   3.8 ------	UNKNOWN