Analysis Summary
Notes:
- 1) No attempt has been made to eliminate the non-significant decimal places.
- 2) This batgrbproduct analysis is done using the HEASARC data.
- 3) This batgrbproduct analysis is using the flight position for the mask-weighting calculation.
======================================================================
BAT GRB EVENT DATA PROCESSING REPORT
Process Script Ver: batgrbproduct v2.46
Process Start Time: Sat Oct 4 23:46:18 EDT 2014
Host Name: batevent1
Current Working Dir: /local/data/batevent/batevent_reproc/trigger595608
======================================================================
Trigger: 00595608 Segment: 000
BAT Trigger Time: 419034061.632 [s; MET]
Trigger Stop: 419034062.656 [s; MET]
UTC: 2014-04-12T22:20:49.752900 [includes UTCF correction]
Where From?: TDRSS position message
BAT
RA: 145.049609678632 Dec: -65.8089066452474 [deg; J2000]
Catalogged Source?: NO
Point Source?: YES
GRB Indicated?: YES [ by BAT flight software ]
Image S/N Ratio: 10
Image Trigger?: NO
Rate S/N Ratio: 12.2882057274445 [ if not an image trigger ]
Image S/N Ratio: 10
Analysis Position: [ source = BAT ]
RA: 145.049609678632 Dec: -65.8089066452474 [deg; J2000]
Refined Position: [ source = BAT pre-slew burst ]
RA: 144.998010188121 Dec: -65.8269537681377 [deg; J2000]
{ 09h 39m 59.5s , -65d 49' 37.0" }
+/- 1.65442038844535 [arcmin] (estimated 90% radius based on SNR)
+/- 0.604464729267588 [arcmin] (formal 1-sigma fit error)
SNR: 14.8172337473661
Angular difference between the analysis and refined position is 1.667606 arcmin
Partial Coding Fraction: 0.7734375 [ including projection effects ]
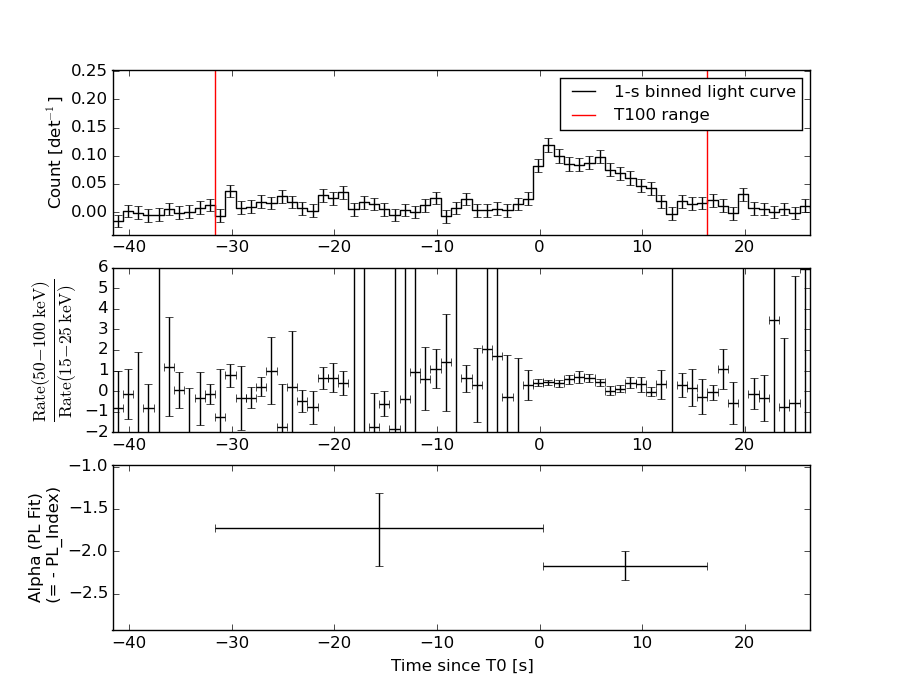
Duration
T90: 48 +/- 22.6274169979695
Measured from: -31.6320000290871
to: 16.3679999709129 [s; relative to TRIGTIME]
T50: 16 +/- 16
Measured from: -15.6320000290871
to: 0.367999970912933 [s; relative to TRIGTIME]
Fluence
Peak Flux (peak 1 second)
Measured from: 7.86799997091293
to: 8.86799997091293 [s; relative to TRIGTIME]
Total Fluence
Measured from: -31.6320000290871
to: 16.3679999709129 [s; relative to TRIGTIME]
Band 1 Band 2 Band 3 Band 4
15-25 25-50 50-100 100-350 keV
Total 0.530040 0.547798 0.213849 0.109351
0.042879 0.043354 0.037550 0.033056 [error]
Peak 0.031284 0.031046 0.008428 0.000666
0.006606 0.006483 0.005519 0.004837 [error]
[ fluence units of on-axis counts / fully illuminated detector ]
======================================================================
====== Table of the duration information =============================
Value tstart tstop
T100 48.000 -31.632 16.368
T90 48.000 -31.632 16.368
T50 16.000 -15.632 0.368
Peak 1.000 7.868 8.868
====== Spectral Analysis Summary =====================================
Model : spectral model: simple power-law (PL) and cutoff power-law (CPL)
Ph_index : photon index: E^{Ph_index}
Ph_90err : 90% error of the photon index
Epeak : Epeak in keV
Epeak_90err: 90% error of Epeak
Norm : normalization at 50 keV in both the PL model and CPL model
Nomr_90err : 90% error of the normalization
chi2 : Chi-Squared
dof : degree of freedo
=== Time-averaged spectral analysis ===
(Best model with acceptable fit: PL)
Model Ph_index Ph_90err_low Ph_90err_hi Epeak Epeak_90err_low Epeak_90err_hi Norm Nomr_90err_low Norm_90err_hi chi2 dof
PL -2.029 -0.193 0.184 - - - 1.60e-03 -1.98e-04 1.94e-04 36.250 57
CPL -2.266 -0.145 0.747 106.251 N/A N/A 1.20e-03 N/A N/A 35.720 56
=== 1-s peak spectral analysis ===
(Best model with acceptable fit: PL)
Model Ph_index Ph_90err_low Ph_90err_hi Epeak Epeak_90err_low Epeak_90err_hi Norm Nomr_90err_low Norm_90err_hi chi2 dof
PL -2.128 -0.510 0.437 - - - 3.86e-03 -1.35e-03 1.30e-03 47.970 57
CPL -0.506 -1.862 4.298 33.568 -33.568 -33.568 3.99e-02 -3.99e-02 2.23e+01 46.660 56
=== Fluence/Peak Flux Summary ===
Model Band1 Band2 Band3 Band4 Band5 Total
15-25 25-50 50-100 100-350 15-150 15-350 keV
Fluence PL 1.61e-07 2.15e-07 2.11e-07 3.71e-07 7.09e-07 9.59e-07 erg/cm2
90%_error_low -2.13e-08 -2.01e-08 -3.58e-08 -1.12e-07 -8.03e-08 -1.54e-07 erg/cm2
90%_error_hi 2.18e-08 2.00e-08 3.67e-08 1.42e-07 8.22e-08 1.78e-07 erg/cm2
Peak flux PL 2.91e-01 2.03e-01 9.28e-02 5.92e-02 6.16e-01 6.46e-01 ph/cm2/s
90%_error_low -8.94e-02 -5.14e-02 -3.98e-02 -3.69e-02 -1.49e-01 -1.60e-01 ph/cm2/s
90%_error_hi 9.28e-02 5.07e-02 4.33e-02 6.27e-02 1.49e-01 1.62e-01 ph/cm2/s
Fluence CPL 1.59e-07 1.90e-07 2.06e-07 4.16e-07 7.17e-07 9.64e-07 erg/cm2
90%_error_low N/A -5.40e-08 N/A -1.93e-07 -8.53e-08 -2.90e-07 erg/cm2
90%_error_hi N/A 3.54e-08 N/A 1.58e-07 8.02e-08 1.66e-07 erg/cm2
Peak flux CPL 2.68e-01 2.42e-01 7.53e-02 6.21e-03 5.91e-01 5.92e-01 ph/cm2/s
90%_error_low N/A -7.53e-02 -5.20e-02 -6.21e-03 -1.50e-01 N/A ph/cm2/s
90%_error_hi N/A 8.14e-02 5.55e-02 9.45e-02 1.52e-01 N/A ph/cm2/s
======================================================================
Image
Pre-slew 15.0-350.0 keV image (Event data)
#   RAcent    DECcent   POSerr    Theta     Phi              Peak Cts       SNR   Name
  144.9980   -65.8270   0.0129    16.2015    86.8548         1.3689639     14.817 TRIG_00595608

Foreground time interval of the image:
-31.632  16.368 (delta_t =  48.000 [sec])
Background time interval of the image:
-239.632 -31.632 (delta_t = 208.000 [sec])
Light Curves
Note: The mask-weighted lightcurves have units of either count/det or counts/sec/det, where a det is 0.4 x 0.4 = 0.16 sq cm.
Full-time range; 1 s binning
Other quick-look light curves:
- 64 ms binning (zoomed)
- 16 ms binning (zoomed)
- 8 ms binning (zoomed)
- 2 ms binning (zoomed)
- SN=5 or 10 s binning (full-time range)
- Raw light curve
Spectra
- 64 ms binning (zoomed)
- 16 ms binning (zoomed)
- 8 ms binning (zoomed)
- 2 ms binning (zoomed)
- SN=5 or 10 s binning (full-time range)
- Raw light curve
Spectra
Notes:
- 1) The fitting includes the systematic errors.
- 2) When the burst includes telescope slew time periods, the fitting uses an average response file made from multiple 5-s response files through out the slew time plus single time preiod for the non-slew times, and weighted by the total counts in the corresponding time period using addrmf. An average response file is needed becuase a spectral fit using the pre-slew DRM will introduce some errors in both a spectral shape and a normalization if the PHA file contains a lot of the slew/post-slew time interval.
- 3) For fits to more complicated models (e.g. a power-law over a cutoff power-law), the BAT team has decided to require a chi-square improvement of more than 6 for each extra dof.
Time averaged spectrum fit using the average DRM
Power-law model
Time interval is from  -31.632 sec. to   16.368 sec.

Spectral model in power-law:
------------------------------------------------------------
Parameters  : value       lower 90%   higher 90%
Photon index: -2.02873     ( -0.192586   0.183636 )
Norm@50keV  : 1.59922E-03    ( -0.000198339   0.000193558 )
------------------------------------------------------------
#Fit statistic : Chi-Squared =          36.25 using 59 PHA bins.
# Reduced chi-squared =         0.6359 for     57 degrees of freedom
# Null hypothesis probability =   9.854623e-01

Photon flux (15-150 keV)    in 48 sec: 0.243126 ( -0.022401  0.022408 ) ph/cm2/s
Energy fluence (15-150 keV)             : 7.09219e-07 ( -8.02618e-08  8.22451e-08 ) ergs/cm2
Cutoff power-law model
Time interval is from  -31.632 sec. to   16.368 sec.
Spectral model in the cutoff power-law:
------------------------------------------------------------
Parameters  : value       lower 90%   higher 90%
Photon index: -2.26554     ( -0.14511   0.746808 )
Epeak [keV] : 106.251      (   )
Norm@50keV  : 1.19644E-03    (     )
------------------------------------------------------------
#Fit statistic : Chi-Squared =          35.72 using 59 PHA bins.
# Reduced chi-squared =         0.6379 for     56 degrees of freedom
# Null hypothesis probability =   9.841419e-01

Photon flux (15-150 keV)    in 48 sec: 0.223095 ( -0.048225  0.040441 ) ph/cm2/s
Energy fluence (15-150 keV)             : 7.1687e-07 ( -8.52715e-08  8.01902e-08 ) ergs/cm2
1-s peak spectrum fit
Power-law model

Time interval is from    7.868 sec. to    8.868 sec.

Spectral model in power-law:
------------------------------------------------------------
Parameters  : value       lower 90%   higher 90%
Photon index: -2.12821     ( -0.509962   0.436474 )
Norm@50keV  : 3.85864E-03    ( -0.00134956   0.00130482 )
------------------------------------------------------------
#Fit statistic : Chi-Squared =          47.97 using 59 PHA bins.
# Reduced chi-squared =         0.8416 for     57 degrees of freedom
# Null hypothesis probability =   7.972031e-01

Photon flux (15-150 keV)    in 1 sec: 0.615709 ( -0.149391  0.149455 ) ph/cm2/s
Energy fluence (15-150 keV)             : 3.59625e-08 ( -1.07736e-08  1.15262e-08 ) ergs/cm2
Cutoff power-law model
Time interval is from    7.868 sec. to    8.868 sec.
Spectral model in the cutoff power-law:
------------------------------------------------------------
Parameters  : value       lower 90%   higher 90%
Photon index: -0.505683     ( -1.89951   4.26062 )
Epeak [keV] : 33.5678      ( -33.6119 -33.6119 )
Norm@50keV  : 3.99296E-02    ( -0.0441445   22.252 )
------------------------------------------------------------
#Fit statistic : Chi-Squared =          46.66 using 59 PHA bins.
# Reduced chi-squared =         0.8331 for     56 degrees of freedom
# Null hypothesis probability =   8.088147e-01

Photon flux (15-150 keV)    in 1 sec: 0.591056 ( -0.150019  0.152347 ) ph/cm2/s
Energy fluence (15-150 keV)             : 0 ( 0  0 ) ergs/cm2
Time-resolved spectra
Distribution
T90 vs. Hardness ratio plot
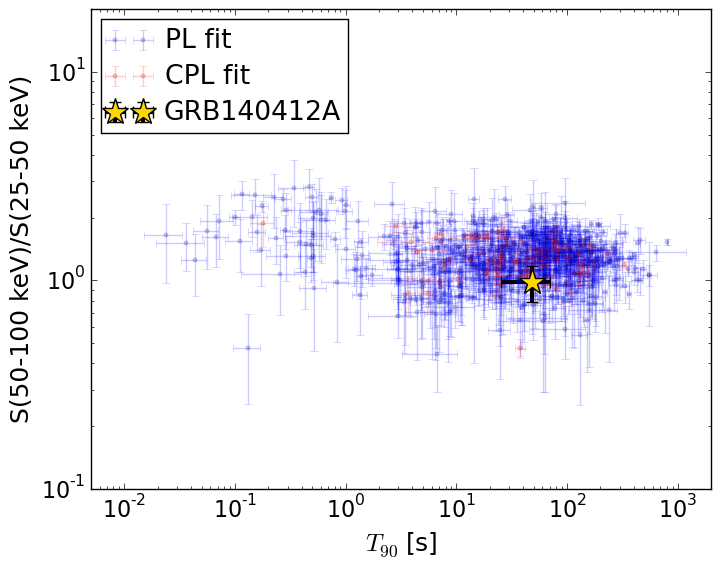
T90                                   = 48.0 sec.
Hardness ratio (energy fluence ratio) = 0.980324615507
S(15-50 keV) vs. S(50-150 keV) plot
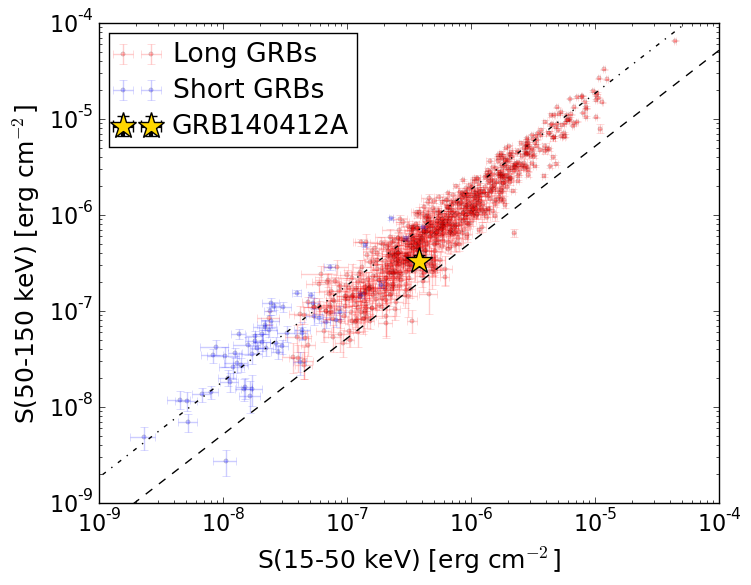
S(15-50 keV)  = 3.766891e-07
S(50-150 keV) = 3.325327e-07
The dash-dotted line and the dashed line traces the fluences calculated from the Band function with Epeak = 15 and 150 keV, respectively. Both lines assume a canonical values of alpha = -1 and beta = -2.5.
Mask shadow pattern
IMX = 1.594155435631204E-02, IMY = -2.901177717198384E-01
Spacecraft aspect plot
Bright source in the pre-burst/pre-slew/post-slew images
Pre-burst image of 15-350 keV band
Time interval of the image:
-239.632000 -31.632000

# RAcent  DECcent POSerr Theta    Phi  PeakCts   SNR AngSep     Name
#  [deg]    [deg]    ['] [deg]  [deg]                   [']
135.5219 -40.5362    1.3  34.0   38.7   2.5973   8.8    1.1	Vela X-1
170.1627 -60.5802    3.5  28.1   96.0   0.9224   3.3    5.2	Cen X-3
186.5854 -62.7191    2.6  31.7  110.5   1.5031   4.4    3.6	GX 301-2
105.5157 -34.9459    2.4  35.0   -4.8   1.1201   4.8 ------	UNKNOWN
Pre-slew background subtracted image of 15-350 keV band
Time interval of the image:
-31.632000 16.368000

# RAcent  DECcent POSerr Theta    Phi  PeakCts   SNR AngSep     Name
#  [deg]    [deg]    ['] [deg]  [deg]                   [']
135.4719 -40.5221    9.5  34.0   38.6   0.1557   1.2    3.2	Vela X-1
170.6468 -60.5964    6.6  28.3   96.4   0.2216   1.7    9.9	Cen X-3
186.4859 -62.5774    0.0  31.8  110.3   0.2103   1.6   12.5	GX 301-2
123.1404 -23.7744    2.9  47.8   16.7   0.8250   4.0 ------	UNKNOWN
144.9974 -65.8257    0.8  16.2   86.9   1.3748  14.9 ------	UNKNOWN
104.2638 -13.6826    2.2  56.3   -7.0   1.6499   5.2 ------	UNKNOWN
 78.9190 -27.9706    2.2  44.1  -39.6   0.8276   5.3 ------	UNKNOWN
Post-slew image of 15-350 keV band
Time interval of the image:
55.268590 962.438000

# RAcent  DECcent POSerr Theta    Phi  PeakCts   SNR AngSep     Name
#  [deg]    [deg]    ['] [deg]  [deg]                   [']
135.5287 -40.5436    0.6  25.8   11.6  11.4972  20.2    0.7	Vela X-1
170.3329 -60.6772    2.0  12.4  105.7   3.1724   5.8    3.3	Cen X-3
186.6532 -62.7756    0.8  18.0  128.0   8.8767  14.1    0.3	GX 301-2
168.5307 -44.0429    2.3  25.3   70.5   3.7134   5.0 ------	UNKNOWN
120.3506 -73.2452    2.3  11.2 -113.6   2.7219   4.9 ------	UNKNOWN