Analysis Summary
Notes:
- 1) No attempt has been made to eliminate the non-significant decimal places.
- 2) This batgrbproduct analysis is done using the HEASARC data.
- 3) This batgrbproduct analysis is using the flight position for the mask-weighting calculation.
==========================================================================
           BAT GROUND-DETECTED GRB DATA PROCESSING REPORT
            (This burst occurred during telescope slew)
    Process Script Ver: batgrbproduct v2.46
    Process Start Time: Mon Mar 23 00:10:38 EDT 2015
             Host Name: bat1
   Current Working Dir: /local/data/bat1/alien/Swift_3rdBATcatalog/event/batevent_reproc/GRB140414A
======================================================================

  Trigger: 00084568      Segment: 002

  BAT Trigger Time: 419148400.628
               UTC: 2014-04-14T06:06:28.744   [includes UTCF correction]
       Where From?: Ground analysis (best_duration.txt)
  NOTE: BAT trigger time for ground-detected burst during slew is the T100 start time.

  Refined Position:   [ source = BAT mosaic image ]
    RA: 195.334779671725   Dec: 56.911610323343  [deg; J2000]
        { 13h 01m 20.3s , +56d 54' 41.8" }
        +/- 1.74669840158 [arcmin] (estimated 90% radius based on SNR)
    SNR: 13.7135405058


  Angular difference between the analysis and refined position is Usage: arcmin

  Partial Coding Fraction: Unavailable because the burst occurred during slew.

  Duration
     T90: 0.495999932289124 +/- 0.0683520568627649
        Measured from: 0.016
                   to: 0.512     [s; relative to TRIGTIME]
     T50: 0.263999938964844 +/- 0.0582408661455224
        Measured from: 0.192
                   to: 0.456     [s; relative to TRIGTIME]


====== Table of the duration information =============================

        Value   tstart    tstop
T100    0.532    0.000    0.532
T90     0.496    0.016    0.512
T50     0.264    0.192    0.456
Peak    1.000   -0.234    0.766


====== Spectral Analysis Summary =====================================

Model      : spectral model: simple power-law (PL) and cutoff power-law (CPL)
Ph_index   : photon index: E^{Ph_index}
Ph_90err   : 90% error of the photon index
Epeak      : Epeak in keV
Epeak_90err: 90% error of Epeak
Norm       : normalization at 50 keV in both the PL model and CPL model
Nomr_90err : 90% error of the normalization
chi2       : Chi-Squared
dof        : degree of freedo

=== Time-averaged spectral analysis ===
(Best model with acceptable fit: PL)

Model Ph_index Ph_90err_low Ph_90err_hi  Epeak  Epeak_90err_low  Epeak_90err_hi  Norm       Nomr_90err_low    Norm_90err_hi    chi2    dof
PL      -0.667    -0.161      0.168       -           -               -         1.88e-02     -1.82e-03          1.80e-03      63.200   57
CPL     -0.530    -0.420      0.683      664.065    -664.065      -664.065      2.15e-02     -3.88e-03          1.84e-02      63.050   56


=== 1-s peak spectral analysis ===
(Best model with acceptable fit: PL)

Model Ph_index Ph_90err_low Ph_90err_hi  Epeak  Epeak_90err_low  Epeak_90err_hi  Norm       Nomr_90err_low    Norm_90err_hi    chi2    dof
PL      -0.820     -0.195     0.203       -           -               -         1.04e-02     -1.17e-03          1.16e-03      60.830   57
CPL     -0.678     -0.233     0.832      547.082    -547.082      -547.082      1.19e-02     -2.49e-03          1.45e-02      60.730   56


=== Fluence/Peak Flux Summary ===

              Model    Band1     Band2     Band3     Band4     Band5     Total
                       15-25     25-50    50-100    100-350    15-150    15-350    keV
Fluence         PL   5.90e-09  1.82e-08  4.58e-08  3.27e-07  1.24e-07  3.97e-07   erg/cm2
      90%_error_low -1.17e-09 -2.25e-09 -4.29e-09 -6.77e-08 -1.20e-08 -6.98e-08   erg/cm2
      90%_error_hi   1.27e-09  2.21e-09  4.27e-09  8.05e-08  1.21e-08  8.14e-08   erg/cm2
Peak flux       PL   2.23e-01  3.37e-01  3.82e-01  8.24e-01  1.19e+00  1.77e+00   ph/cm2/s
      90%_error_low -5.15e-02 -4.94e-02 -4.46e-02 -1.96e-01 -1.32e-01 -2.25e-01   ph/cm2/s
      90%_error_hi   5.61e-02  4.85e-02  4.42e-02  2.36e-01  1.32e-01  2.40e-01   ph/cm2/s

Fluence        CPL   5.67e-09  1.83e-08  4.66e-08  2.75e-07  1.24e-07  3.44e-07   erg/cm2
      90%_error_low -1.52e-09 -2.28e-09 -4.94e-09 -1.44e-07 -1.24e-08 -1.42e-07   erg/cm2
      90%_error_hi   1.27e-09  2.34e-09  5.57e-09  1.65e-07  1.21e-08  7.49e-08   erg/cm2
Peak flux      CPL   2.15e-01  3.40e-01  3.89e-01  7.08e-01  1.18e+00  1.65e+00   ph/cm2/s
      90%_error_low -6.56e-02 -5.08e-02 -5.01e-02 -3.69e-01 -1.36e-01 -3.98e-01   ph/cm2/s
      90%_error_hi   5.47e-02  5.17e-02  5.69e-02  1.78e-01  1.35e-01  3.32e-01   ph/cm2/s

======================================================================
Image
Note1: The mosaic image is made with timebin = 0.05 s; energybin = 15-350 keV
Note2: The mosaic image uses Galactic coordinate.
#RAcent DECcent POSerr Theta  Phi  Peak_Cts  SNR Name
195.335 56.912 0.005 27.242 -30.216 0.240 13.714 UNKNOWN

Image time interval: 0.000 to 0.532 [sec]
Light Curves
Note: The mask-weighted lightcurves have units of either count/det or counts/sec/det, where a det is 0.4 x 0.4 = 0.16 sq cm.
Best duration plot
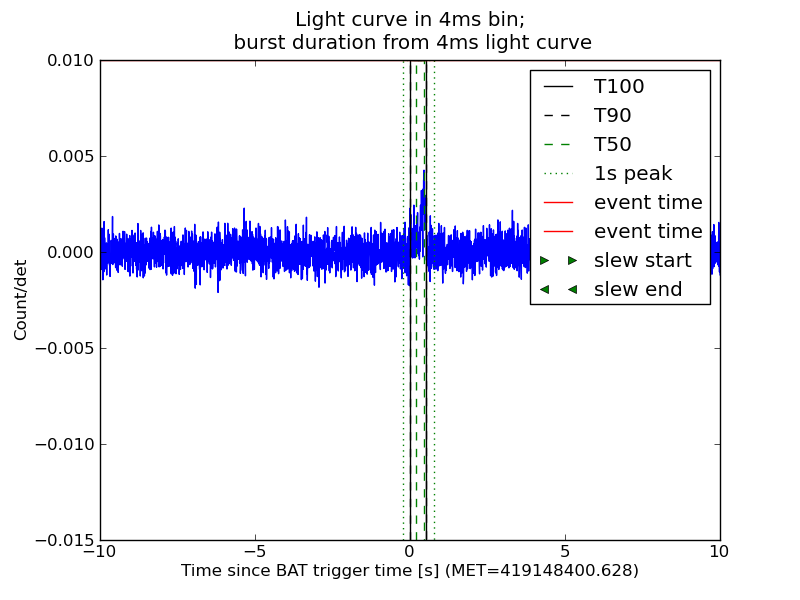
Full-time range; 1 s binning
Other quick-look light curves:
- 64 ms binning (zoomed)
- 16 ms binning (zoomed)
- 8 ms binning (zoomed)
- 2 ms binning (zoomed)
- SN=5 or 10 s binning (full-time range)
- Raw light curve
Spectra
- 64 ms binning (zoomed)
- 16 ms binning (zoomed)
- 8 ms binning (zoomed)
- 2 ms binning (zoomed)
- SN=5 or 10 s binning (full-time range)
- Raw light curve
Spectra
Notes:
- 1) The fitting includes the systematic errors.
- 2) When the burst includes telescope slew time periods, the fitting uses an average response file made from multiple 5-s response files through out the slew time plus single time preiod for the non-slew times, and weighted by the total counts in the corresponding time period using addrmf. An average response file is needed becuase a spectral fit using the pre-slew DRM will introduce some errors in both a spectral shape and a normalization if the PHA file contains a lot of the slew/post-slew time interval.
- 3) For fits to more complicated models (e.g. a power-law over a cutoff power-law), the BAT team has decided to require a chi-square improvement of more than 6 for each extra dof.
Time averaged spectrum fit using the average DRM
Power-law model

Time interval is from    0.000 sec. to    0.532 sec.

Spectral model in power-law:
------------------------------------------------------------
Parameters  : value       lower 90%   higher 90%
Photon index: -0.666919     ( -0.16117   0.167705 )
Norm@50keV  : 1.88406E-02    ( -0.00182394   0.00179944 )
------------------------------------------------------------
#Fit statistic : Chi-Squared =          63.20 using 59 PHA bins.
# Reduced chi-squared =          1.109 for     57 degrees of freedom
# Null hypothesis probability =   2.667864e-01

Photon flux (15-150 keV)    in 0.532 sec: 2.18398 ( -0.19942  0.19969 ) ph/cm2/s
Energy fluence (15-150 keV)             : 1.24217e-07 ( -1.20123e-08  1.20752e-08 ) ergs/cm2
Cutoff power-law model
Time interval is from    0.000 sec. to    0.532 sec.
Spectral model in the cutoff power-law:
------------------------------------------------------------
Parameters  : value       lower 90%   higher 90%
Photon index: -0.529901     ( -0.420347   0.682908 )
Epeak [keV] : 664.065      ( -664.066 -664.066 )
Norm@50keV  : 2.14698E-02    ( -0.00388361   0.018379 )
------------------------------------------------------------
#Fit statistic : Chi-Squared =          63.05 using 59 PHA bins.
# Reduced chi-squared =          1.126 for     56 degrees of freedom
# Null hypothesis probability =   2.410757e-01

Photon flux (15-150 keV)    in 0.532 sec: 2.17513 ( -0.20318  0.20323 ) ph/cm2/s
Energy fluence (15-150 keV)             : 1.23715e-07 ( -1.24005e-08  1.212e-08 ) ergs/cm2
1-s peak spectrum fit
Power-law model

Time interval is from   -0.234 sec. to    0.766 sec.

Spectral model in power-law:
------------------------------------------------------------
Parameters  : value       lower 90%   higher 90%
Photon index: -0.819864     ( -0.195034   0.202684 )
Norm@50keV  : 1.03560E-02    ( -0.00117037   0.00116094 )
------------------------------------------------------------
#Fit statistic : Chi-Squared =          60.83 using 59 PHA bins.
# Reduced chi-squared =          1.067 for     57 degrees of freedom
# Null hypothesis probability =   3.396036e-01

Photon flux (15-150 keV)    in 1 sec: 1.18949 ( -0.13219  0.13248 ) ph/cm2/s
Energy fluence (15-150 keV)             : 1.20033e-07 ( -1.44558e-08  1.45499e-08 ) ergs/cm2
Cutoff power-law model
Time interval is from   -0.234 sec. to    0.766 sec.
Spectral model in the cutoff power-law:
------------------------------------------------------------
Parameters  : value       lower 90%   higher 90%
Photon index: -0.67807     ( -0.233489   0.831622 )
Epeak [keV] : 547.082      ( -547.085 -547.085 )
Norm@50keV  : 1.19468E-02    ( -0.00249259   0.0145479 )
------------------------------------------------------------
#Fit statistic : Chi-Squared =          60.73 using 59 PHA bins.
# Reduced chi-squared =          1.084 for     56 degrees of freedom
# Null hypothesis probability =   3.094790e-01

Photon flux (15-150 keV)    in 1 sec: 1.18333 ( -0.13604  0.13477 ) ph/cm2/s
Energy fluence (15-150 keV)             : 1.19226e-07 ( -1.53058e-08  1.48065e-08 ) ergs/cm2
Time-resolved spectra

Distribution
T90 vs. Hardness ratio plot
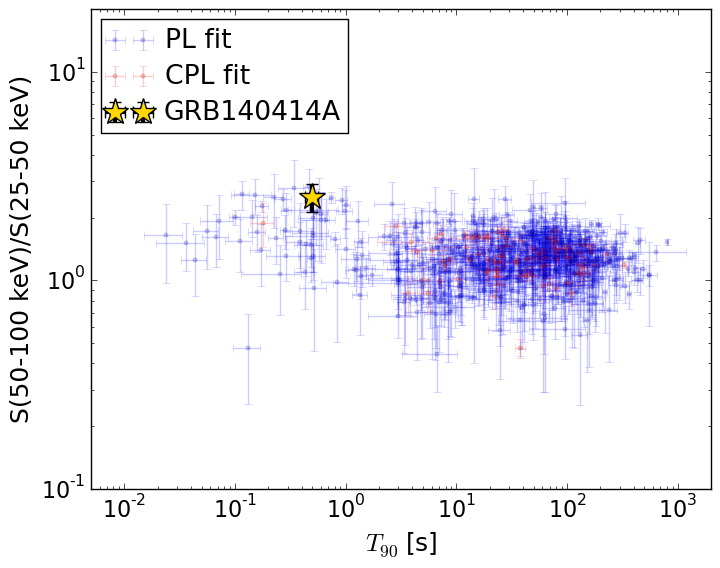
T90                                   = 0.4959999 sec.
Hardness ratio (energy fluence ratio) = 2.51941738753
S(15-50 keV) vs. S(50-150 keV) plot
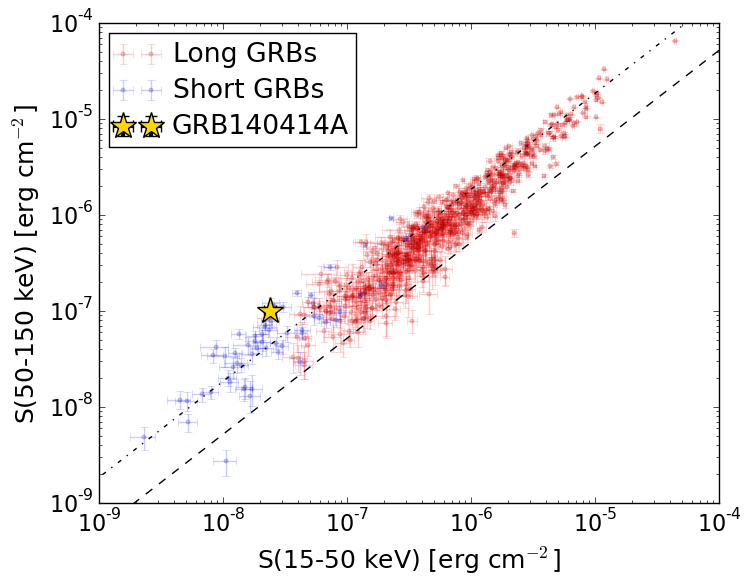
S(15-50 keV)  = 2.4066131e-08
S(50-150 keV) = 1.0015134e-07
The dash-dotted line and the dashed line traces the fluences calculated from the Band function with Epeak = 15 and 150 keV, respectively. Both lines assume a canonical values of alpha = -1 and beta = -2.5.
Mask shadow pattern
Mask shadow pattern unavailable because this burst occurs during telescope slews.Spacecraft aspect plot