Analysis Summary
Notes:
- 1) No attempt has been made to eliminate the non-significant decimal places.
- 2) This batgrbproduct analysis is done using the HEASARC data.
- 3) This batgrbproduct analysis is using the flight position for the mask-weighting calculation.
======================================================================
                  BAT GRB EVENT DATA PROCESSING REPORT
    Process Script Ver: batgrbproduct v2.46
    Process Start Time: Sat Oct  4 23:32:32 EDT 2014
             Host Name: batevent1
   Current Working Dir: /local/data/batevent/batevent_reproc/trigger596426
======================================================================

  Trigger: 00596426      Segment: 000

  BAT Trigger Time: 419573222.976   [s; MET]
      Trigger Stop: 419573224   [s; MET]
               UTC: 2014-04-19T04:06:51.071220    [includes UTCF correction]
       Where From?: TDRSS position message

  BAT
    RA: 126.99951654378   Dec: 46.2209756335083  [deg; J2000]

     Catalogged Source?: NO
     Point Source?:      YES
     GRB Indicated?:     YES    [ by BAT flight software ]
     Image S/N Ratio:    11.96
     Image Trigger?:     NO
     Rate S/N Ratio:     40.9756024970958  [ if not an image trigger ]
     Image S/N Ratio:    11.96

  Analysis Position:   [ source = BAT ]
    RA: 126.99951654378   Dec: 46.2209756335083  [deg; J2000]

  Refined Position:   [ source = BAT pre-slew burst ]
    RA: 127.00158970807   Dec: 46.2340088443795  [deg; J2000]
        { 08h 28m 00.4s , +46d 14' 02.4" }
         +/- 0.688422882359341 [arcmin] (estimated 90% radius based on SNR)
         +/- 0.177832474241562 [arcmin] (formal 1-sigma fit error)
    SNR: 51.8505860593101

  Angular difference between the analysis and refined position is 0.786713 arcmin

  Partial Coding Fraction: 0.3320312    [ including projection effects ]

  Duration
     T90: 80.0759999155998 +/- 3.77504441677767
        Measured from: -2.44400000572205
                   to: 77.6319999098778     [s; relative to TRIGTIME]
     T50: 38.8039999604225 +/- 0.849894101154483
        Measured from: 8.56000000238419
                   to: 47.3639999628067     [s; relative to TRIGTIME]


  Fluence
     Peak Flux  (peak 1 second)
        Measured from: 51.4239999651909
                   to: 52.4239999651909     [s; relative to TRIGTIME]
     Total Fluence
        Measured from: -8.68800002336502
                   to: 125.347999989986     [s; relative to TRIGTIME]

             Band 1     Band 2     Band 3     Band 4
              15-25      25-50     50-100    100-350     keV
 Total     4.506116   7.404678   7.443074   2.618822
           0.090397   0.100439   0.096987   0.083572 [error]
 Peak      0.110133   0.209249   0.204925   0.063059
           0.007232   0.008562   0.008655   0.006535 [error]

     [ fluence units of on-axis counts / fully illuminated detector ]

======================================================================


====== Table of the duration information =============================

        Value   tstart    tstop
T100  134.036   -8.688  125.348
T90    80.076   -2.444   77.632
T50    38.804    8.560   47.364
Peak    1.000   51.424   52.424


====== Spectral Analysis Summary =====================================

Model      : spectral model: simple power-law (PL) and cutoff power-law (CPL)
Ph_index   : photon index: E^{Ph_index}
Ph_90err   : 90% error of the photon index
Epeak      : Epeak in keV
Epeak_90err: 90% error of Epeak
Norm       : normalization at 50 keV in both the PL model and CPL model
Nomr_90err : 90% error of the normalization
chi2       : Chi-Squared
dof        : degree of freedo

=== Time-averaged spectral analysis ===
(Best model with acceptable fit: PL)

Model Ph_index Ph_90err_low Ph_90err_hi  Epeak  Epeak_90err_low  Epeak_90err_hi  Norm       Nomr_90err_low    Norm_90err_hi    chi2    dof
PL      -1.155    -0.034      0.034       -           -               -         1.14e-02     -2.10e-04          2.09e-04      45.330   57
CPL     -1.099    -0.067      0.108      994.290    -994.290      -994.290      1.20e-02     -7.61e-04          1.20e-03      45.410   56


=== 1-s peak spectral analysis ===
(Best model with acceptable fit: PL)

Model Ph_index Ph_90err_low Ph_90err_hi  Epeak  Epeak_90err_low  Epeak_90err_hi  Norm       Nomr_90err_low    Norm_90err_hi    chi2    dof
PL      -1.030     -0.079     0.080       -           -               -         3.90e-02     -1.75e-03          1.75e-03      52.220   57
CPL     -0.754     -0.296     0.328      255.400    -108.375      -255.400      5.21e-02     -1.06e-02          2.05e-02      49.850   56


=== Fluence/Peak Flux Summary ===

              Model    Band1     Band2     Band3     Band4     Band5     Total
                       15-25     25-50    50-100    100-350    15-150    15-350    keV
Fluence         PL   1.41e-06  3.21e-06  5.78e-06  2.45e-05  1.57e-05  3.49e-05   erg/cm2
      90%_error_low -5.77e-08 -7.69e-08 -1.09e-07 -1.12e-06 -2.83e-07 -1.15e-06   erg/cm2
      90%_error_hi   5.88e-08  7.68e-08  1.09e-07  1.16e-06  2.84e-07  1.18e-06   erg/cm2
Peak flux       PL   1.03e+00  1.37e+00  1.34e+00  2.35e+00  4.50e+00  6.08e+00   ph/cm2/s
      90%_error_low -9.14e-02 -7.46e-02 -6.80e-02 -2.50e-01 -2.05e-01 -3.05e-01   ph/cm2/s
      90%_error_hi   9.44e-02  7.41e-02  6.76e-02  2.69e-01  2.05e-01  3.11e-01   ph/cm2/s

Fluence        CPL   1.42e-06  3.22e-06  5.79e-06  2.40e-05  1.57e-05  3.44e-05   erg/cm2
      90%_error_low -1.07e-07 -1.02e-07 -1.38e-07 -3.65e-06 -2.29e-07 -3.70e-06   erg/cm2
      90%_error_hi   3.85e-08  9.94e-08  1.10e-07  7.27e-07  3.41e-07  1.47e-06   erg/cm2
Peak flux      CPL   9.58e-01  1.39e+00  1.38e+00  1.76e+00  4.45e+00  5.49e+00   ph/cm2/s
      90%_error_low -1.16e-01 -7.98e-02 -8.26e-02 -4.69e-01 -2.12e-01 -5.18e-01   ph/cm2/s
      90%_error_hi   1.19e-01  8.06e-02  8.37e-02  4.15e-01  2.12e-01  5.79e-01   ph/cm2/s

======================================================================
Image
Pre-slew 15.0-350.0 keV image (Event data)
#   RAcent    DECcent   POSerr    Theta     Phi              Peak Cts       SNR   Name
  127.0016    46.2340   0.0037    36.5222   142.3095        10.1894655     51.851 TRIG_00596426

Foreground time interval of the image:
 -8.688  17.725 (delta_t =  26.413 [sec])
Background time interval of the image:
-239.976  -8.688 (delta_t = 231.288 [sec])
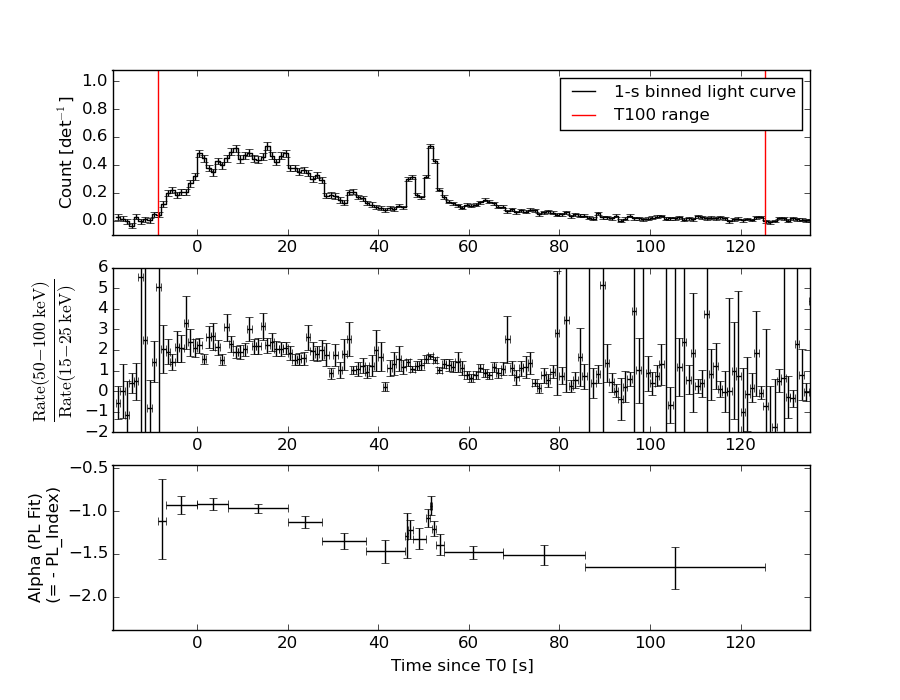
Light Curves
Note: The mask-weighted lightcurves have units of either count/det or counts/sec/det, where a det is 0.4 x 0.4 = 0.16 sq cm.
Full-time range; 1 s binning
Other quick-look light curves:
- 64 ms binning (zoomed)
- 16 ms binning (zoomed)
- 8 ms binning (zoomed)
- 2 ms binning (zoomed)
- SN=5 or 10 s binning (full-time range)
- Raw light curve
Spectra
- 64 ms binning (zoomed)
- 16 ms binning (zoomed)
- 8 ms binning (zoomed)
- 2 ms binning (zoomed)
- SN=5 or 10 s binning (full-time range)
- Raw light curve
Spectra
Notes:
- 1) The fitting includes the systematic errors.
- 2) When the burst includes telescope slew time periods, the fitting uses an average response file made from multiple 5-s response files through out the slew time plus single time preiod for the non-slew times, and weighted by the total counts in the corresponding time period using addrmf. An average response file is needed becuase a spectral fit using the pre-slew DRM will introduce some errors in both a spectral shape and a normalization if the PHA file contains a lot of the slew/post-slew time interval.
- 3) For fits to more complicated models (e.g. a power-law over a cutoff power-law), the BAT team has decided to require a chi-square improvement of more than 6 for each extra dof.
Time averaged spectrum fit using the average DRM
Power-law model

Time interval is from   -8.688 sec. to  125.348 sec.

Spectral model in power-law:
------------------------------------------------------------
Parameters  : value       lower 90%   higher 90%
Photon index: -1.15453     ( -0.0339422   0.0340804 )
Norm@50keV  : 1.14163E-02    ( -0.000210092   0.00020952 )
------------------------------------------------------------
#Fit statistic : Chi-Squared =          45.33 using 59 PHA bins.
# Reduced chi-squared =         0.7952 for     57 degrees of freedom
# Null hypothesis probability =   8.674891e-01

Photon flux (15-150 keV)    in 134 sec: 1.33210 ( -0.02664  0.02675 ) ph/cm2/s
Energy fluence (15-150 keV)             : 1.57284e-05 ( -2.83139e-07  2.83955e-07 ) ergs/cm2
Cutoff power-law model
Time interval is from   -8.688 sec. to  125.348 sec.
Spectral model in the cutoff power-law:
------------------------------------------------------------
Parameters  : value       lower 90%   higher 90%
Photon index: -1.14925     ( -0.0671999   0.10796 )
Epeak [keV] : 9997.24      ( -9997.13 -9997.13 )
Norm@50keV  : 1.14732E-02    ( -0.000200531   0.00175638 )
------------------------------------------------------------
#Fit statistic : Chi-Squared =          45.29 using 59 PHA bins.
# Reduced chi-squared =         0.8088 for     56 degrees of freedom
# Null hypothesis probability =   8.462556e-01

Photon flux (15-150 keV)    in 134 sec: 1.32955 ( -0.02896  0.02413 ) ph/cm2/s
Energy fluence (15-150 keV)             : 1.57122e-05 ( -2.29182e-07  3.41148e-07 ) ergs/cm2
1-s peak spectrum fit
Power-law model
Time interval is from   51.424 sec. to   52.424 sec.

Spectral model in power-law:
------------------------------------------------------------
Parameters  : value       lower 90%   higher 90%
Photon index: -1.03015     ( -0.079213   0.0796724 )
Norm@50keV  : 3.90456E-02    ( -0.00174721   0.00174637 )
------------------------------------------------------------
#Fit statistic : Chi-Squared =          52.22 using 59 PHA bins.
# Reduced chi-squared =         0.9162 for     57 degrees of freedom
# Null hypothesis probability =   6.545507e-01

Photon flux (15-150 keV)    in 1 sec: 4.50333 ( -0.20458  0.20469 ) ph/cm2/s
Energy fluence (15-150 keV)             : 4.1784e-07 ( -2.10781e-08  2.11655e-08 ) ergs/cm2
Cutoff power-law model
Time interval is from   51.424 sec. to   52.424 sec.
Spectral model in the cutoff power-law:
------------------------------------------------------------
Parameters  : value       lower 90%   higher 90%
Photon index: -0.754132     ( -0.295517   0.328113 )
Epeak [keV] : 255.400      ( -108.375 -255.4 )
Norm@50keV  : 5.20719E-02    ( -0.0105558   0.0204951 )
------------------------------------------------------------
#Fit statistic : Chi-Squared =          49.85 using 59 PHA bins.
# Reduced chi-squared =         0.8902 for     56 degrees of freedom
# Null hypothesis probability =   7.054621e-01

Photon flux (15-150 keV)    in 1 sec: 4.45167 ( -0.21229  0.21222 ) ph/cm2/s
Energy fluence (15-150 keV)             : 4.11661e-07 ( -2.24904e-08  2.23792e-08 ) ergs/cm2
Time-resolved spectra
Distribution
T90 vs. Hardness ratio plot
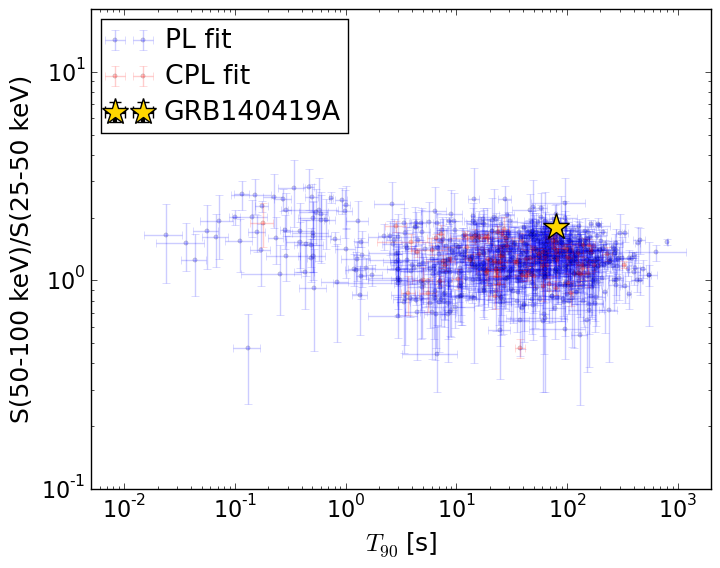
T90                                   = 80.076 sec.
Hardness ratio (energy fluence ratio) = 1.79688350286
S(15-50 keV) vs. S(50-150 keV) plot
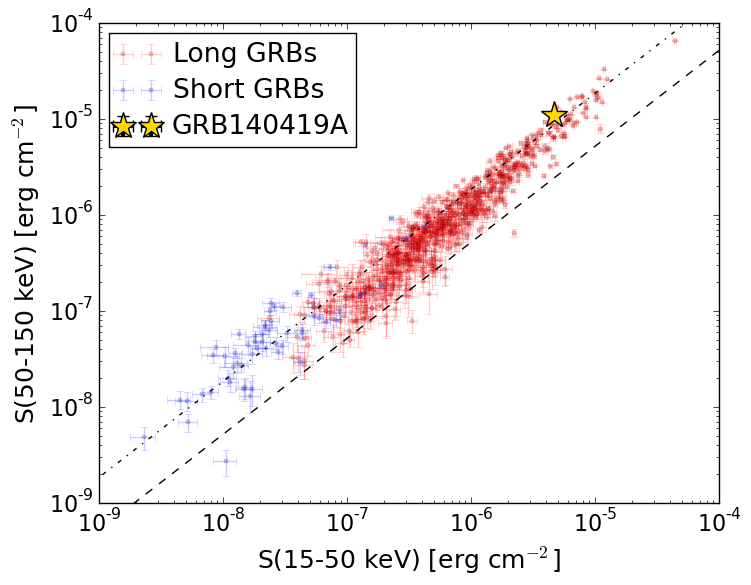
S(15-50 keV)  = 4.62863e-06
S(50-150 keV) = 1.1099989e-05
The dash-dotted line and the dashed line traces the fluences calculated from the Band function with Epeak = 15 and 150 keV, respectively. Both lines assume a canonical values of alpha = -1 and beta = -2.5.
Mask shadow pattern
IMX = -5.860254435949162E-01, IMY = -4.527762847548107E-01
Spacecraft aspect plot
Bright source in the pre-burst/pre-slew/post-slew images
Pre-burst image of 15-350 keV band
Time interval of the image:
-239.976000 -8.688000

# RAcent  DECcent POSerr Theta    Phi  PeakCts   SNR AngSep     Name
#  [deg]    [deg]    ['] [deg]  [deg]                   [']
 83.6345  22.0140    0.5  44.1 -150.4   9.6959  24.7    0.1	Crab
105.6044  59.8504    2.4  18.0  139.5   0.9080   4.7 ------	UNKNOWN
107.0313  25.1793    2.5  47.0  179.3   1.7226   4.6 ------	UNKNOWN
325.1336  45.7394    3.0  54.3   -6.0   2.3436   3.8 ------	UNKNOWN
357.4361  39.5795    2.3  46.6  -36.2   2.3009   5.0 ------	UNKNOWN
 60.1914  20.7233    2.4  44.4 -118.9   4.3452   4.9 ------	UNKNOWN
Pre-slew background subtracted image of 15-350 keV band
Time interval of the image:
-8.688000 17.724610

# RAcent  DECcent POSerr Theta    Phi  PeakCts   SNR AngSep     Name
#  [deg]    [deg]    ['] [deg]  [deg]                   [']
 83.4246  22.0275    5.4  44.1 -150.2   0.3562   2.1   11.6	Crab
168.2072  63.2786    3.0  39.3   95.3   1.6937   3.8 ------	UNKNOWN
167.0277  69.4303    2.6  34.6   88.7   1.0660   4.4 ------	UNKNOWN
127.0016  46.2340    0.2  36.5  142.3  10.1892  51.8 ------	UNKNOWN
302.1078  63.2345    3.9  45.8   20.3   0.5910   3.0 ------	UNKNOWN
Post-slew image of 15-350 keV band
Time interval of the image:
75.524600 962.164700

# RAcent  DECcent POSerr Theta    Phi  PeakCts   SNR AngSep     Name
#  [deg]    [deg]    ['] [deg]  [deg]                   [']
 83.6294  22.0114    0.4  42.5 -124.3  40.0589  28.0    0.3	Crab
120.0616  -9.3329    3.0  55.9  173.6  10.7198   3.9 ------	UNKNOWN
180.0497  75.3703    2.8  36.5    5.2   2.4446   4.1 ------	UNKNOWN
129.5903  39.3641    2.9   7.1  148.9   1.8408   3.9 ------	UNKNOWN
126.9697  46.2348    1.9   0.0 -107.0   3.0350   6.0 ------	UNKNOWN
102.5680  -8.6167    3.6  59.0 -166.2  11.4319   3.2 ------	UNKNOWN