Analysis Summary
Notes:
- 1) No attempt has been made to eliminate the non-significant decimal places.
- 2) This batgrbproduct analysis is done using the HEASARC data.
- 3) This batgrbproduct analysis is using the flight position for the mask-weighting calculation.
======================================================================
                  BAT GRB EVENT DATA PROCESSING REPORT
    Process Script Ver: batgrbproduct v2.46
    Process Start Time: Sat Oct  4 23:24:21 EDT 2014
             Host Name: batevent1
   Current Working Dir: /local/data/batevent/batevent_reproc/trigger596901
======================================================================

  Trigger: 00596901      Segment: 000

  BAT Trigger Time: 419934725.184   [s; MET]
      Trigger Stop: 419934729.28   [s; MET]
               UTC: 2014-04-23T08:31:53.262020    [includes UTCF correction]
       Where From?: TDRSS position message

  BAT
    RA: 197.290296592494   Dec: 49.8145967622945  [deg; J2000]

     Catalogged Source?: NO
     Point Source?:      YES
     GRB Indicated?:     YES    [ by BAT flight software ]
     Image S/N Ratio:    9.94
     Image Trigger?:     NO
     Rate S/N Ratio:     10.9544511501033  [ if not an image trigger ]
     Image S/N Ratio:    9.94

  Analysis Position:   [ source = BAT ]
    RA: 197.290296592494   Dec: 49.8145967622945  [deg; J2000]

  Refined Position:   [ source = BAT pre-slew burst ]
    RA: 197.275473333852   Dec: 49.8380463461092  [deg; J2000]
        { 13h 09m 06.1s , +49d 50' 17.0" }
         +/- 0.912461825176301 [arcmin] (estimated 90% radius based on SNR)
         +/- 0.352192157056506 [arcmin] (formal 1-sigma fit error)
    SNR: 34.6700539400205

  Angular difference between the analysis and refined position is 1.519465 arcmin

  Partial Coding Fraction: 0.3984375    [ including projection effects ]

  Duration
     T90: 134.143999993801 +/- 23.1033129881465
        Measured from: -50.8320000171661
                   to: 83.311999976635     [s; relative to TRIGTIME]
     T50: 53.8240000009537 +/- 2.91112079374196
        Measured from: 2.54399996995926
                   to: 56.3679999709129     [s; relative to TRIGTIME]


  Fluence
     Peak Flux  (peak 1 second)
        Measured from: 44.1879999637604
                   to: 45.1879999637604     [s; relative to TRIGTIME]
     Total Fluence
        Measured from: -130.128000020981
                   to: 108.912000000477     [s; relative to TRIGTIME]

             Band 1     Band 2     Band 3     Band 4
              15-25      25-50     50-100    100-350     keV
 Total     3.335540   5.020936   4.446507   1.275937
           0.127154   0.134508   0.120261   0.101863 [error]
 Peak      0.057980   0.104402   0.083037   0.041026
           0.009167   0.010774   0.009795   0.007752 [error]

     [ fluence units of on-axis counts / fully illuminated detector ]

======================================================================


====== Table of the duration information =============================

        Value   tstart    tstop
T100  239.040 -130.128  108.912
T90   134.144  -50.832   83.312
T50    53.824    2.544   56.368
Peak    1.000   44.188   45.188


====== Spectral Analysis Summary =====================================

Model      : spectral model: simple power-law (PL) and cutoff power-law (CPL)
Ph_index   : photon index: E^{Ph_index}
Ph_90err   : 90% error of the photon index
Epeak      : Epeak in keV
Epeak_90err: 90% error of Epeak
Norm       : normalization at 50 keV in both the PL model and CPL model
Nomr_90err : 90% error of the normalization
chi2       : Chi-Squared
dof        : degree of freedo

=== Time-averaged spectral analysis ===
(Best model with acceptable fit: PL)

Model Ph_index Ph_90err_low Ph_90err_hi  Epeak  Epeak_90err_low  Epeak_90err_hi  Norm       Nomr_90err_low    Norm_90err_hi    chi2    dof
PL      -1.335    -0.056      0.057       -           -               -         4.00e-03     -1.21e-04          1.21e-04      47.910   57
CPL     -1.163    -0.193      0.228      271.043      N/A           N/A         4.79e-03        N/A               N/A         46.090   56


=== 1-s peak spectral analysis ===
(Best model with acceptable fit: PL)

Model Ph_index Ph_90err_low Ph_90err_hi  Epeak  Epeak_90err_low  Epeak_90err_hi  Norm       Nomr_90err_low    Norm_90err_hi    chi2    dof
PL      -1.194     -0.187     0.190       -           -               -         1.83e-02     -2.06e-03          2.06e-03      70.770   57
CPL     -0.980     -0.382     0.879      244.568    -244.568      -244.568      2.35e-02        N/A               N/A         70.540   56


=== Fluence/Peak Flux Summary ===

              Model    Band1     Band2     Band3     Band4     Band5     Total
                       15-25     25-50    50-100    100-350    15-150    15-350    keV
Fluence         PL   1.05e-06  2.13e-06  3.37e-06  1.19e-05  9.37e-06  1.84e-05   erg/cm2
      90%_error_low -6.44e-08 -7.70e-08 -1.21e-07 -9.59e-07 -3.02e-07 -1.02e-06   erg/cm2
      90%_error_hi   6.59e-08  7.67e-08  1.21e-07  1.02e-06  3.02e-07  1.07e-06   erg/cm2
Peak flux       PL   5.63e-01  6.80e-01  5.94e-01  8.91e-01  2.15e+00  2.73e+00   ph/cm2/s
      90%_error_low -1.13e-01 -8.77e-02 -7.84e-02 -2.22e-01 -2.45e-01 -3.25e-01   ph/cm2/s
      90%_error_hi   1.19e-01  8.64e-02  7.75e-02  2.64e-01  2.45e-01  3.32e-01   ph/cm2/s

Fluence        CPL   1.00e-06  2.15e-06  3.43e-06  9.40e-06  9.27e-06  1.60e-05   erg/cm2
      90%_error_low -8.23e-08 -8.26e-08 -1.38e-07 -2.33e-06 -3.29e-07 -2.33e-06   erg/cm2
      90%_error_hi   8.39e-08  8.33e-08  1.39e-07  2.76e-06  3.27e-07  2.28e-06   erg/cm2
Peak flux      CPL   5.43e-01  6.96e-01  6.08e-01  6.85e-01  2.14e+00  2.53e+00   ph/cm2/s
      90%_error_low -1.32e-01 -1.00e-01 -8.85e-02 -4.06e-01 -2.49e-01 -4.78e-01   ph/cm2/s
      90%_error_hi   1.20e-01  1.08e-01  9.27e-02  4.04e-01  2.49e-01  4.96e-01   ph/cm2/s

======================================================================
Image
Pre-slew 15.0-350.0 keV image (Event data)
#   RAcent    DECcent   POSerr    Theta     Phi              Peak Cts       SNR   Name
  197.2755    49.8380   0.0055    29.0584   105.7265        15.2761995     34.670 TRIG_00596901

Foreground time interval of the image:
-130.128 108.912 (delta_t = 239.040 [sec])
Background time interval of the image:
-239.184 -130.128 (delta_t = 109.056 [sec])
Light Curves
Note: The mask-weighted lightcurves have units of either count/det or counts/sec/det, where a det is 0.4 x 0.4 = 0.16 sq cm.
Full-time range; 1 s binning
Other quick-look light curves:
- 64 ms binning (zoomed)
- 16 ms binning (zoomed)
- 8 ms binning (zoomed)
- 2 ms binning (zoomed)
- SN=5 or 10 s binning (full-time range)
- Raw light curve
Spectra
- 64 ms binning (zoomed)
- 16 ms binning (zoomed)
- 8 ms binning (zoomed)
- 2 ms binning (zoomed)
- SN=5 or 10 s binning (full-time range)
- Raw light curve
Spectra
Notes:
- 1) The fitting includes the systematic errors.
- 2) When the burst includes telescope slew time periods, the fitting uses an average response file made from multiple 5-s response files through out the slew time plus single time preiod for the non-slew times, and weighted by the total counts in the corresponding time period using addrmf. An average response file is needed becuase a spectral fit using the pre-slew DRM will introduce some errors in both a spectral shape and a normalization if the PHA file contains a lot of the slew/post-slew time interval.
- 3) For fits to more complicated models (e.g. a power-law over a cutoff power-law), the BAT team has decided to require a chi-square improvement of more than 6 for each extra dof.
Time averaged spectrum fit using the average DRM
Power-law model
Time interval is from -130.128 sec. to  108.912 sec.

Spectral model in power-law:
------------------------------------------------------------
Parameters  : value       lower 90%   higher 90%
Photon index: -1.33513     ( -0.0563251   0.0565238 )
Norm@50keV  : 4.00113E-03    ( -0.000121131   0.000121108 )
------------------------------------------------------------
#Fit statistic : Chi-Squared =          47.91 using 59 PHA bins.
# Reduced chi-squared =         0.8406 for     57 degrees of freedom
# Null hypothesis probability =   7.988438e-01

Photon flux (15-150 keV)    in 239 sec: 0.480579 ( -0.015794  0.015832 ) ph/cm2/s
Energy fluence (15-150 keV)             : 9.37234e-06 ( -3.01697e-07  3.02371e-07 ) ergs/cm2
Cutoff power-law model
Time interval is from -130.128 sec. to  108.912 sec.
Spectral model in the cutoff power-law:
------------------------------------------------------------
Parameters  : value       lower 90%   higher 90%
Photon index: -1.16323     ( -0.192917   0.227854 )
Epeak [keV] : 271.043      (   )
Norm@50keV  : 4.79022E-03    (     )
------------------------------------------------------------
#Fit statistic : Chi-Squared =          46.09 using 59 PHA bins.
# Reduced chi-squared =         0.8231 for     56 degrees of freedom
# Null hypothesis probability =   8.247693e-01

Photon flux (15-150 keV)    in 239 sec: 0.475304 ( -0.017052  0.017088 ) ph/cm2/s
Energy fluence (15-150 keV)             : 9.27189e-06 ( -3.2879e-07  3.27377e-07 ) ergs/cm2
1-s peak spectrum fit
Power-law model
Time interval is from   44.188 sec. to   45.188 sec.

Spectral model in power-law:
------------------------------------------------------------
Parameters  : value       lower 90%   higher 90%
Photon index: -1.19415     ( -0.186939   0.189737 )
Norm@50keV  : 1.83307E-02    ( -0.00205655   0.00205563 )
------------------------------------------------------------
#Fit statistic : Chi-Squared =          70.77 using 59 PHA bins.
# Reduced chi-squared =          1.242 for     57 degrees of freedom
# Null hypothesis probability =   1.038299e-01

Photon flux (15-150 keV)    in 1 sec: 2.14990 ( -0.24506  0.24527 ) ph/cm2/s
Energy fluence (15-150 keV)             : 1.86303e-07 ( -2.33997e-08  2.35717e-08 ) ergs/cm2
Cutoff power-law model
Time interval is from   44.188 sec. to   45.188 sec.
Spectral model in the cutoff power-law:
------------------------------------------------------------
Parameters  : value       lower 90%   higher 90%
Photon index: -0.980168     ( -0.381142   0.879447 )
Epeak [keV] : 244.568      ( -245.133 -245.133 )
Norm@50keV  : 2.35053E-02    (     )
------------------------------------------------------------
#Fit statistic : Chi-Squared =          70.54 using 59 PHA bins.
# Reduced chi-squared =          1.260 for     56 degrees of freedom
# Null hypothesis probability =   9.142197e-02

Photon flux (15-150 keV)    in 1 sec: 2.13794 ( -0.24928  0.24872 ) ph/cm2/s
Energy fluence (15-150 keV)             : 1.83565e-07 ( -2.62428e-08  2.5254e-08 ) ergs/cm2
Time-resolved spectra
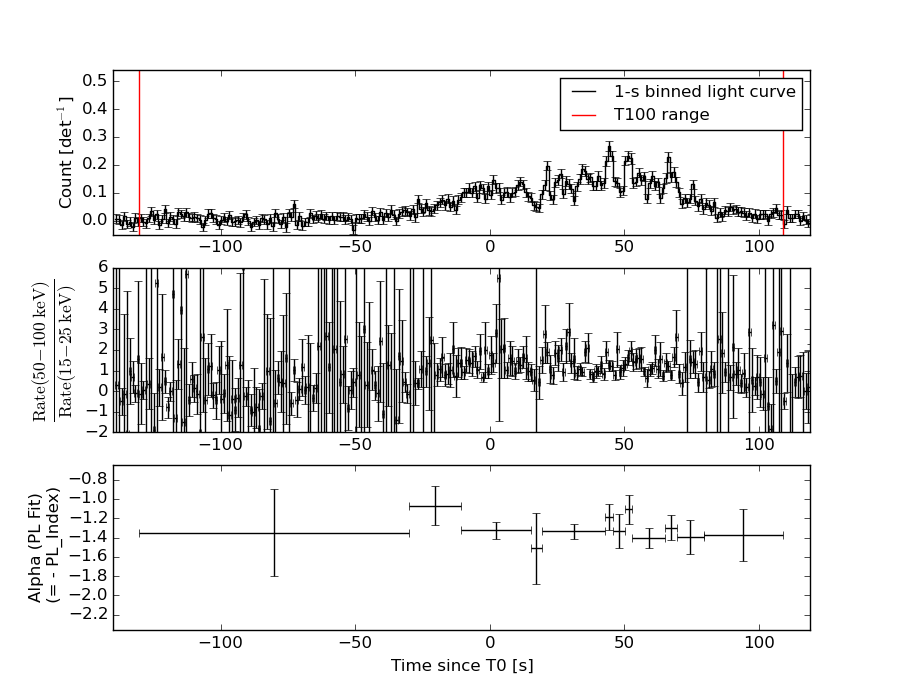
Distribution
T90 vs. Hardness ratio plot
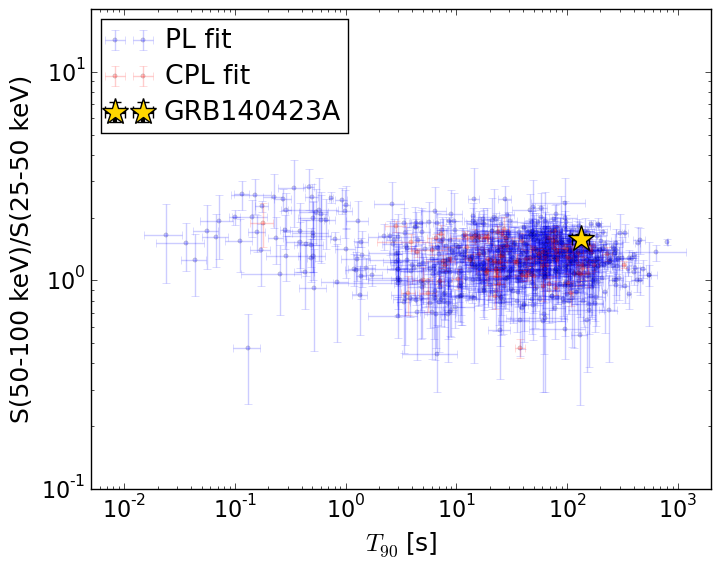
T90                                   = 134.144 sec.
Hardness ratio (energy fluence ratio) = 1.58547690983
S(15-50 keV) vs. S(50-150 keV) plot
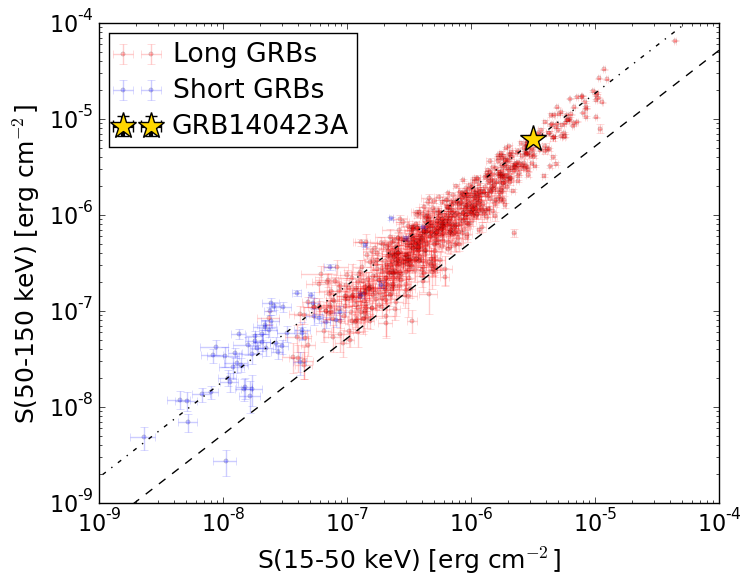
S(15-50 keV)  = 3.173696e-06
S(50-150 keV) = 6.198737e-06
The dash-dotted line and the dashed line traces the fluences calculated from the Band function with Epeak = 15 and 150 keV, respectively. Both lines assume a canonical values of alpha = -1 and beta = -2.5.
Mask shadow pattern
IMX = -1.506037702459664E-01, IMY = -5.348419615468998E-01
Spacecraft aspect plot
Bright source in the pre-burst/pre-slew/post-slew images
Pre-burst image of 15-350 keV band
Time interval of the image:
-239.184000 -130.128000

# RAcent  DECcent POSerr Theta    Phi  PeakCts   SNR AngSep     Name
#  [deg]    [deg]    ['] [deg]  [deg]                   [']
299.6060  35.2186    3.1  57.9   -3.7   2.4521   3.8    1.3	Cyg X-1
308.1073  40.9268    7.3  53.8  -13.1   0.4787   1.6    1.6	Cyg X-3
208.3018  43.4473    2.3  35.7   92.0   1.2829   5.0 ------	UNKNOWN
178.3745  47.6249    1.9  32.0  130.0   1.0461   6.2 ------	UNKNOWN
107.8648  34.1629    2.6  56.4 -157.3   2.0159   4.4 ------	UNKNOWN
Pre-slew background subtracted image of 15-350 keV band
Time interval of the image:
-130.128000 108.912000

# RAcent  DECcent POSerr Theta    Phi  PeakCts   SNR AngSep     Name
#  [deg]    [deg]    ['] [deg]  [deg]                   [']
299.4853  35.2502    5.2  57.8   -3.6  -3.8068  -2.2    5.9	Cyg X-1
308.2230  40.8962    6.2  53.8  -13.2  -1.4951  -1.9    6.1	Cyg X-3
251.1208  36.9666    2.7  47.1   44.0   5.0581   4.2 ------	UNKNOWN
204.0112  45.2785    2.2  33.7   97.2   3.1161   5.1 ------	UNKNOWN
197.2755  49.8380    0.3  29.1  105.7  15.2752  34.7 ------	UNKNOWN
152.1501  64.6322    3.1  19.1  173.8   0.9845   3.7 ------	UNKNOWN
109.6900  52.1668    2.9  38.7 -152.5   1.4767   4.0 ------	UNKNOWN
Post-slew image of 15-350 keV band
Time interval of the image:
300.316630 962.840300

# RAcent  DECcent POSerr Theta    Phi  PeakCts   SNR AngSep     Name
#  [deg]    [deg]    ['] [deg]  [deg]                   [']
352.7413 -72.6630    2.6  46.6   45.9   6.2959   4.5 ------	UNKNOWN
332.4196  26.4436    4.3  59.0 -166.2   6.1791   2.7 ------	UNKNOWN
359.8621  10.0084    3.6  36.2 -137.6   1.7709   3.2 ------	UNKNOWN