Analysis Summary
Notes:
- 1) No attempt has been made to eliminate the non-significant decimal places.
- 2) This batgrbproduct analysis is done using the HEASARC data.
- 3) This batgrbproduct analysis is using the flight position for the mask-weighting calculation.
======================================================================
                  BAT GRB EVENT DATA PROCESSING REPORT
    Process Script Ver: batgrbproduct v2.46
    Process Start Time: Sat Oct  4 23:18:25 EDT 2014
             Host Name: batevent1
   Current Working Dir: /local/data/batevent/batevent_reproc/trigger597519
======================================================================

  Trigger: 00597519      Segment: 000

  BAT Trigger Time: 420417661.952   [s; MET]
      Trigger Stop: 420417666.048   [s; MET]
               UTC: 2014-04-28T22:40:50.007020    [includes UTCF correction]
       Where From?: TDRSS position message

  BAT
    RA: 194.30789595948   Dec: 28.3219605402312  [deg; J2000]

     Catalogged Source?: NO
     Point Source?:      YES
     GRB Indicated?:     YES    [ by BAT flight software ]
     Image S/N Ratio:    8.54
     Image Trigger?:     NO
     Rate S/N Ratio:     12.369316876853  [ if not an image trigger ]
     Image S/N Ratio:    8.54

  Analysis Position:   [ source = BAT ]
    RA: 194.30789595948   Dec: 28.3219605402312  [deg; J2000]

  Refined Position:   [ source = BAT pre-slew burst ]
    RA: 194.364281560349   Dec: 28.3314910846362  [deg; J2000]
        { 12h 57m 27.4s , +28d 19' 53.4" }
         +/- 2.17011165891163 [arcmin] (estimated 90% radius based on SNR)
         +/- 0.894640840435795 [arcmin] (formal 1-sigma fit error)
    SNR: 10.056102559974

  Angular difference between the analysis and refined position is 3.032430 arcmin

  Partial Coding Fraction: 0.703125    [ including projection effects ]

  Duration
     T90: 17.4240000247955 +/- 5.89714506804888
        Measured from: -13.2800000309944
                   to: 4.14399999380112     [s; relative to TRIGTIME]
     T50: 8.17599999904633 +/- 2.67454972917641
        Measured from: -5.96799999475479
                   to: 2.20800000429153     [s; relative to TRIGTIME]


  Fluence
     Peak Flux  (peak 1 second)
        Measured from: 1.29999995231628
                   to: 2.29999995231628     [s; relative to TRIGTIME]
     Total Fluence
        Measured from: -14.1920000314713
                   to: 5.82400000095367     [s; relative to TRIGTIME]

             Band 1     Band 2     Band 3     Band 4
              15-25      25-50     50-100    100-350     keV
 Total     0.141206   0.217306   0.156995   0.007239
           0.028104   0.029377   0.026471   0.025380 [error]
 Peak      0.016388   0.036290   0.021709   0.001207
           0.006651   0.007005   0.006211   0.005683 [error]

     [ fluence units of on-axis counts / fully illuminated detector ]

======================================================================


====== Table of the duration information =============================

        Value   tstart    tstop
T100   20.016  -14.192    5.824
T90    17.424  -13.280    4.144
T50     8.176   -5.968    2.208
Peak    1.000    1.300    2.300


====== Spectral Analysis Summary =====================================

Model      : spectral model: simple power-law (PL) and cutoff power-law (CPL)
Ph_index   : photon index: E^{Ph_index}
Ph_90err   : 90% error of the photon index
Epeak      : Epeak in keV
Epeak_90err: 90% error of Epeak
Norm       : normalization at 50 keV in both the PL model and CPL model
Nomr_90err : 90% error of the normalization
chi2       : Chi-Squared
dof        : degree of freedo

=== Time-averaged spectral analysis ===
(Best model with acceptable fit: PL)

Model Ph_index Ph_90err_low Ph_90err_hi  Epeak  Epeak_90err_low  Epeak_90err_hi  Norm       Nomr_90err_low    Norm_90err_hi    chi2    dof
PL      -1.541    -0.260      0.253       -           -               -         1.80e-03     -2.97e-04          2.93e-04      65.980   57
CPL     -0.403    -1.069      1.397       64.422     -16.756       196.201      7.39e-03     -7.39e-03          3.40e-02      62.620   56


=== 1-s peak spectral analysis ===
(Best model with acceptable fit: PL)

Model Ph_index Ph_90err_low Ph_90err_hi  Epeak  Epeak_90err_low  Epeak_90err_hi  Norm       Nomr_90err_low    Norm_90err_hi    chi2    dof
PL      -1.431     -0.416     0.413       -           -               -         5.25e-03     -1.37e-03          1.35e-03      55.410   57
CPL      0.159     -2.030     4.374       59.968     -14.695       -59.968      3.98e-02     -3.98e-02          1.31e+01      53.750   56


=== Fluence/Peak Flux Summary ===

              Model    Band1     Band2     Band3     Band4     Band5     Total
                       15-25     25-50    50-100    100-350    15-150    15-350    keV
Fluence         PL   4.79e-08  8.58e-08  1.18e-07  3.36e-07  3.40e-07  5.88e-07   erg/cm2
      90%_error_low -1.09e-08 -1.32e-08 -2.53e-08 -1.27e-07 -6.05e-08 -1.54e-07   erg/cm2
      90%_error_hi   1.14e-08  1.31e-08  2.54e-08  1.71e-07  6.20e-08  1.91e-07   erg/cm2
Peak flux       PL   2.02e-01  2.12e-01  1.57e-01  1.89e-01  6.44e-01  7.60e-01   ph/cm2/s
      90%_error_low -7.76e-02 -5.61e-02 -5.00e-02 -9.65e-02 -1.62e-01 -1.96e-01   ph/cm2/s
      90%_error_hi   8.54e-02  5.53e-02  5.00e-02  1.45e-01  1.62e-01  2.01e-01   ph/cm2/s

Fluence        CPL   4.15e-08  9.76e-08  1.20e-07  7.33e-08  3.07e-07  3.32e-07   erg/cm2
      90%_error_low -1.28e-08 -1.73e-08 -3.05e-08 -5.51e-08 -6.31e-08 -8.45e-08   erg/cm2
      90%_error_hi   1.30e-08  1.82e-08  2.95e-08  2.25e-07  6.83e-08  2.27e-07   erg/cm2
Peak flux      CPL   1.68e-01  2.53e-01  1.60e-01  3.45e-02  6.08e-01  6.14e-01   ph/cm2/s
      90%_error_low -9.07e-02 -7.74e-02 -7.97e-02 -3.45e-02 -1.69e-01 -1.74e-01   ph/cm2/s
      90%_error_hi   9.71e-02  9.06e-02  6.16e-02  1.97e-01  1.69e-01  2.60e-01   ph/cm2/s

======================================================================
Image
Pre-slew 15.0-350.0 keV image (Event data)
#   RAcent    DECcent   POSerr    Theta     Phi              Peak Cts       SNR   Name
  194.3643    28.3315   0.0192    21.5944   126.9027         0.5854731     10.056 TRIG_00597519

Foreground time interval of the image:
-14.192   5.824 (delta_t =  20.016 [sec])
Background time interval of the image:
-239.952 -14.192 (delta_t = 225.760 [sec])
Light Curves
Note: The mask-weighted lightcurves have units of either count/det or counts/sec/det, where a det is 0.4 x 0.4 = 0.16 sq cm.
Full-time range; 1 s binning
Other quick-look light curves:
- 64 ms binning (zoomed)
- 16 ms binning (zoomed)
- 8 ms binning (zoomed)
- 2 ms binning (zoomed)
- SN=5 or 10 s binning (full-time range)
- Raw light curve
Spectra
- 64 ms binning (zoomed)
- 16 ms binning (zoomed)
- 8 ms binning (zoomed)
- 2 ms binning (zoomed)
- SN=5 or 10 s binning (full-time range)
- Raw light curve
Spectra
Notes:
- 1) The fitting includes the systematic errors.
- 2) When the burst includes telescope slew time periods, the fitting uses an average response file made from multiple 5-s response files through out the slew time plus single time preiod for the non-slew times, and weighted by the total counts in the corresponding time period using addrmf. An average response file is needed becuase a spectral fit using the pre-slew DRM will introduce some errors in both a spectral shape and a normalization if the PHA file contains a lot of the slew/post-slew time interval.
- 3) For fits to more complicated models (e.g. a power-law over a cutoff power-law), the BAT team has decided to require a chi-square improvement of more than 6 for each extra dof.
Time averaged spectrum fit using the average DRM
Power-law model
Time interval is from  -14.192 sec. to    5.824 sec.

Spectral model in power-law:
------------------------------------------------------------
Parameters  : value       lower 90%   higher 90%
Photon index: -1.54063     ( -0.260353   0.253466 )
Norm@50keV  : 1.80206E-03    ( -0.000296823   0.000292541 )
------------------------------------------------------------
#Fit statistic : Chi-Squared =          65.98 using 59 PHA bins.
# Reduced chi-squared =          1.157 for     57 degrees of freedom
# Null hypothesis probability =   1.943536e-01

Photon flux (15-150 keV)    in 20.02 sec: 0.227523 ( -0.034604  0.034617 ) ph/cm2/s
Energy fluence (15-150 keV)             : 3.40138e-07 ( -6.05463e-08  6.20456e-08 ) ergs/cm2
Cutoff power-law model
Time interval is from  -14.192 sec. to    5.824 sec.
Spectral model in the cutoff power-law:
------------------------------------------------------------
Parameters  : value       lower 90%   higher 90%
Photon index: -0.402624     ( -1.06912   1.397 )
Epeak [keV] : 64.4220      ( -16.7556 196.201 )
Norm@50keV  : 7.39445E-03    ( -0.00739445   0.0339624 )
------------------------------------------------------------
#Fit statistic : Chi-Squared =          62.62 using 59 PHA bins.
# Reduced chi-squared =          1.118 for     56 degrees of freedom
# Null hypothesis probability =   2.529433e-01

Photon flux (15-150 keV)    in 20.02 sec: 0.217986 ( -0.03551  0.03565 ) ph/cm2/s
Energy fluence (15-150 keV)             : 3.06706e-07 ( -6.31082e-08  6.82788e-08 ) ergs/cm2
1-s peak spectrum fit
Power-law model
Time interval is from    1.300 sec. to    2.300 sec.

Spectral model in power-law:
------------------------------------------------------------
Parameters  : value       lower 90%   higher 90%
Photon index: -1.43081     ( -0.415848   0.413228 )
Norm@50keV  : 5.25272E-03    ( -0.00136553   0.00134933 )
------------------------------------------------------------
#Fit statistic : Chi-Squared =          55.41 using 59 PHA bins.
# Reduced chi-squared =         0.9720 for     57 degrees of freedom
# Null hypothesis probability =   5.350976e-01

Photon flux (15-150 keV)    in 1 sec: 0.644308 ( -0.161752  0.161987 ) ph/cm2/s
Energy fluence (15-150 keV)             : 5.04557e-08 ( -1.42314e-08  1.47146e-08 ) ergs/cm2
Cutoff power-law model
Time interval is from    1.300 sec. to    2.300 sec.
Spectral model in the cutoff power-law:
------------------------------------------------------------
Parameters  : value       lower 90%   higher 90%
Photon index: 0.158697     ( -2.03802   4.36635 )
Epeak [keV] : 59.9676      ( -14.521 -59.7936 )
Norm@50keV  : 3.97959E-02    ( -0.0405397   13.0578 )
------------------------------------------------------------
#Fit statistic : Chi-Squared =          53.75 using 59 PHA bins.
# Reduced chi-squared =         0.9598 for     56 degrees of freedom
# Null hypothesis probability =   5.604737e-01

Photon flux (15-150 keV)    in 1 sec: 0.608312 ( -0.168889  0.169405 ) ph/cm2/s
Energy fluence (15-150 keV)             : 4.26727e-08 ( -1.50809e-08  1.78586e-08 ) ergs/cm2
Time-resolved spectra
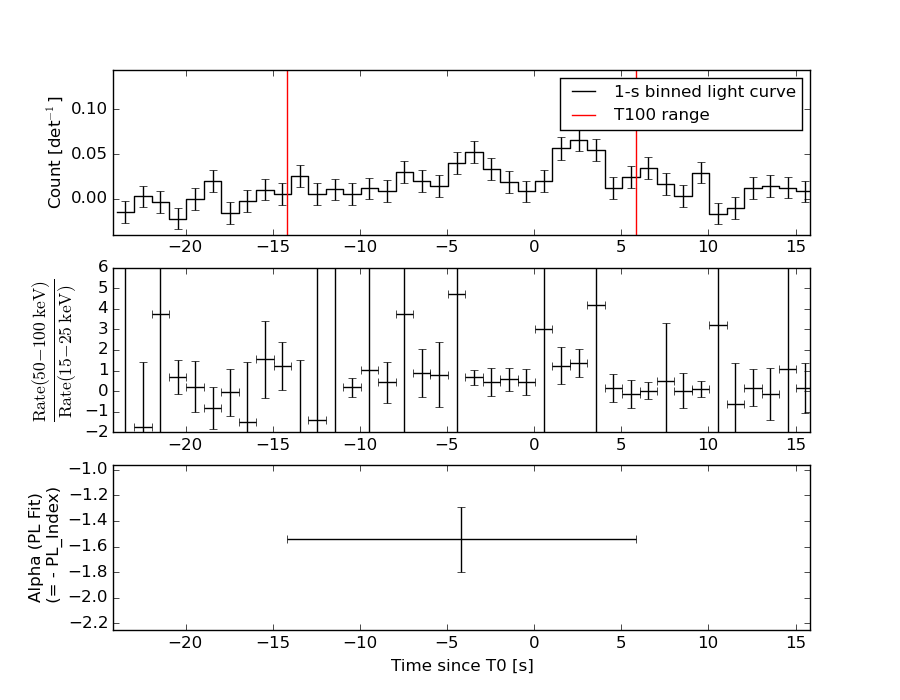
Distribution
T90 vs. Hardness ratio plot
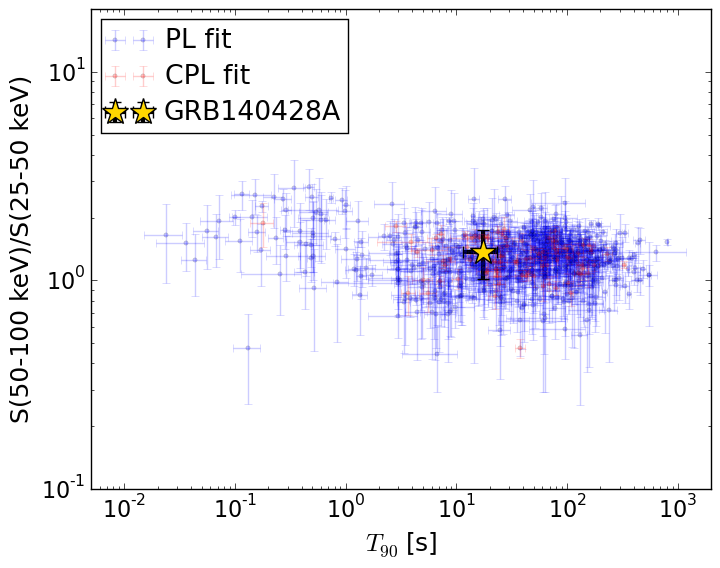
T90                                   = 17.424 sec.
Hardness ratio (energy fluence ratio) = 1.37496042365
S(15-50 keV) vs. S(50-150 keV) plot
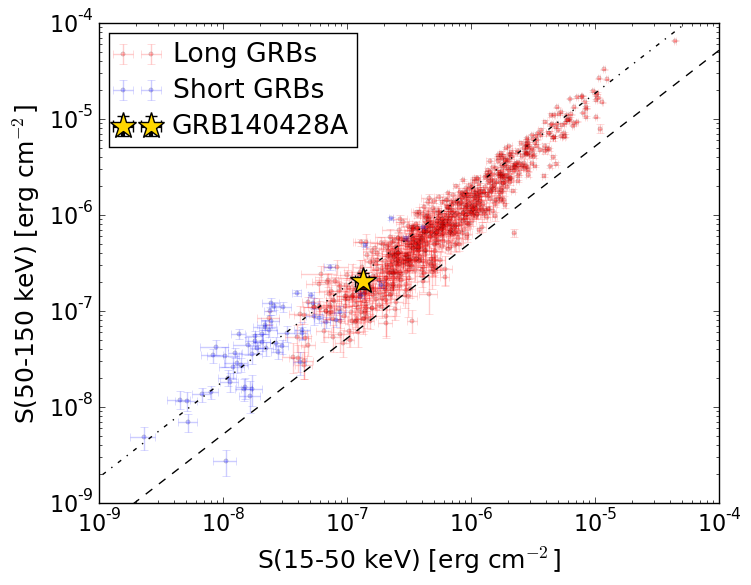
S(15-50 keV)  = 1.3364261e-07
S(50-150 keV) = 2.0649808e-07
The dash-dotted line and the dashed line traces the fluences calculated from the Band function with Epeak = 15 and 150 keV, respectively. Both lines assume a canonical values of alpha = -1 and beta = -2.5.
Mask shadow pattern
IMX = -2.376703540841296E-01, IMY = -3.165160131851645E-01
Spacecraft aspect plot
Bright source in the pre-burst/pre-slew/post-slew images
Pre-burst image of 15-350 keV band
Time interval of the image:
-239.952000 -14.192000

# RAcent  DECcent POSerr Theta    Phi  PeakCts   SNR AngSep     Name
#  [deg]    [deg]    ['] [deg]  [deg]                   [']
254.5897  35.3312    6.2  43.4   26.9   0.7309   1.9    6.5	Her X-1
174.0863   4.9040    2.2  49.0  151.3   4.0115   5.3 ------	UNKNOWN
146.0869   9.4860    2.6  58.3 -175.5   5.2515   4.5 ------	UNKNOWN
219.4775  84.9582    3.2  35.6  -56.8   1.0836   3.7 ------	UNKNOWN
Pre-slew background subtracted image of 15-350 keV band
Time interval of the image:
-14.192000 5.824000

# RAcent  DECcent POSerr Theta    Phi  PeakCts   SNR AngSep     Name
#  [deg]    [deg]    ['] [deg]  [deg]                   [']
254.5765  35.4562    5.1  43.4   26.7  -0.2429  -2.3    9.0	Her X-1
194.3642  28.3315    1.1  21.6  126.9   0.5854  10.1 ------	UNKNOWN
124.6339  48.5901    2.7  45.5 -122.2   0.9024   4.3 ------	UNKNOWN
Post-slew image of 15-350 keV band
Time interval of the image:
83.148590 271.748610

# RAcent  DECcent POSerr Theta    Phi  PeakCts   SNR AngSep     Name
#  [deg]    [deg]    ['] [deg]  [deg]                   [']
254.4450  35.4280   19.5  50.8    5.3   0.2514   0.6    5.2	Her X-1
250.7046  41.9357    2.4  47.2   -2.9   1.4817   4.8 ------	UNKNOWN
138.5426   2.4078    3.3  59.0 -166.1   3.9658   3.5 ------	UNKNOWN
133.8892  19.8263   11.2  55.3 -145.1   1.1857   1.0 ------	UNKNOWN