Analysis Summary
Notes:
- 1) No attempt has been made to eliminate the non-significant decimal places.
- 2) This batgrbproduct analysis is done using the HEASARC data.
- 3) This batgrbproduct analysis is using the flight position for the mask-weighting calculation.
======================================================================
BAT GRB EVENT DATA PROCESSING REPORT
Process Script Ver: batgrbproduct v2.46
Process Start Time: Sat Oct 4 23:14:34 EDT 2014
Host Name: batevent1
Current Working Dir: /local/data/batevent/batevent_reproc/trigger597722
======================================================================
Trigger: 00597722 Segment: 000
BAT Trigger Time: 420582828.48 [s; MET]
Trigger Stop: 420582828.992 [s; MET]
UTC: 2014-04-30T20:33:36.527160 [includes UTCF correction]
Where From?: TDRSS position message
BAT
RA: 102.929387590687 Dec: 23.0094966592596 [deg; J2000]
Catalogged Source?: NO
Point Source?: YES
GRB Indicated?: YES [ by BAT flight software ]
Image S/N Ratio: 9.01
Image Trigger?: NO
Rate S/N Ratio: 15.7162336455017 [ if not an image trigger ]
Image S/N Ratio: 9.01
Analysis Position: [ source = BAT ]
RA: 102.929387590687 Dec: 23.0094966592596 [deg; J2000]
Refined Position: [ source = BAT pre-slew burst ]
RA: 102.937944482399 Dec: 23.0365183284277 [deg; J2000]
{ 06h 51m 45.1s , +23d 02' 11.5" }
+/- 1.03827433826553 [arcmin] (estimated 90% radius based on SNR)
+/- 0.403022539645457 [arcmin] (formal 1-sigma fit error)
SNR: 28.8280556055997
Angular difference between the analysis and refined position is 1.688754 arcmin
Partial Coding Fraction: 1.03125 [ including projection effects ]
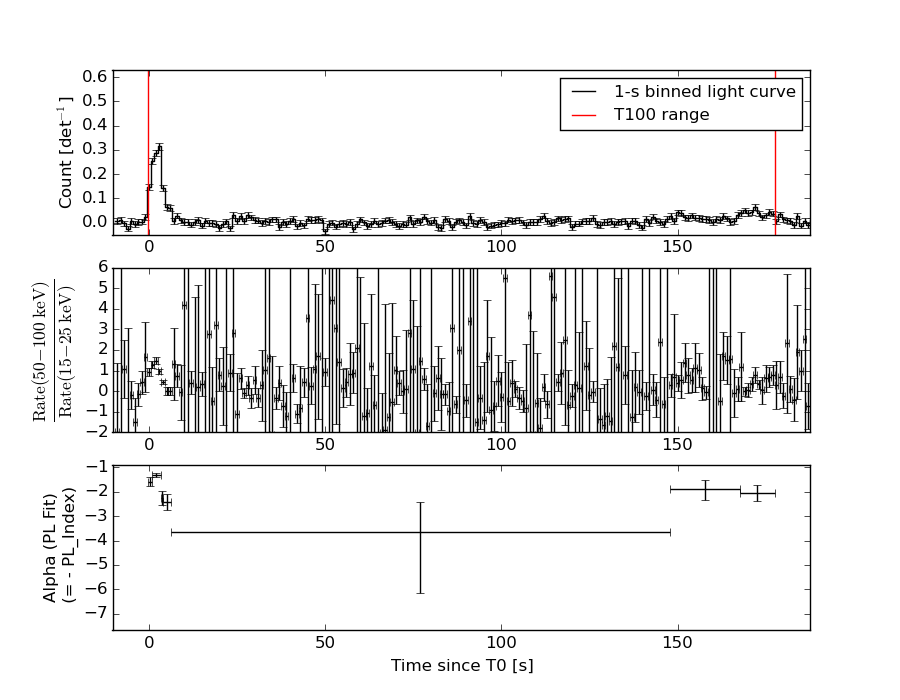
Duration
T90: 173.587999939919 +/- 3.7074196198355
Measured from: 0.435999989509583
to: 174.023999929428 [s; relative to TRIGTIME]
T50: 151.607999920845 +/- 8.96403928269971
Measured from: 2.37199997901917
to: 153.979999899864 [s; relative to TRIGTIME]
Fluence
Peak Flux (peak 1 second)
Measured from: 2.43999999761581
to: 3.43999999761581 [s; relative to TRIGTIME]
Total Fluence
Measured from: -0.304000020027161
to: 177.575999975204 [s; relative to TRIGTIME]
Band 1 Band 2 Band 3 Band 4
15-25 25-50 50-100 100-350 keV
Total 0.857825 0.876561 0.443856 0.167611
0.076080 0.080175 0.075188 0.079717 [error]
Peak 0.077636 0.139918 0.080152 0.026840
0.006830 0.007719 0.007102 0.006444 [error]
[ fluence units of on-axis counts / fully illuminated detector ]
======================================================================
====== Table of the duration information =============================
Value tstart tstop
T100 177.880 -0.304 177.576
T90 173.588 0.436 174.024
T50 151.608 2.372 153.980
Peak 1.000 2.440 3.440
====== Spectral Analysis Summary =====================================
Model : spectral model: simple power-law (PL) and cutoff power-law (CPL)
Ph_index : photon index: E^{Ph_index}
Ph_90err : 90% error of the photon index
Epeak : Epeak in keV
Epeak_90err: 90% error of Epeak
Norm : normalization at 50 keV in both the PL model and CPL model
Nomr_90err : 90% error of the normalization
chi2 : Chi-Squared
dof : degree of freedo
=== Time-averaged spectral analysis ===
(Best model with acceptable fit: PL)
Model Ph_index Ph_90err_low Ph_90err_hi Epeak Epeak_90err_low Epeak_90err_hi Norm Nomr_90err_low Norm_90err_hi chi2 dof
PL -2.006 -0.230 0.217 - - - 6.91e-04 -1.03e-04 1.00e-04 54.940 57
CPL -2.108 -0.466 0.374 47.620 N/A N/A 5.85e-04 N/A N/A 54.310 56
=== 1-s peak spectral analysis ===
(Best model with acceptable fit: PL)
Model Ph_index Ph_90err_low Ph_90err_hi Epeak Epeak_90err_low Epeak_90err_hi Norm Nomr_90err_low Norm_90err_hi chi2 dof
PL -1.395 -0.120 0.119 - - - 2.05e-02 -1.49e-03 1.48e-03 65.120 57
CPL -0.790 -0.514 0.605 92.322 -26.290 226.230 4.36e-02 -2.02e-02 4.86e-02 61.010 56
=== Fluence/Peak Flux Summary ===
Model Band1 Band2 Band3 Band4 Band5 Total
15-25 25-50 50-100 100-350 15-150 15-350 keV
Fluence PL 2.53e-07 3.42e-07 3.41e-07 6.12e-07 1.13e-06 1.55e-06 erg/cm2
90%_error_low -3.68e-08 -3.66e-08 -6.97e-08 -2.18e-07 -1.54e-07 -3.02e-07 erg/cm2
90%_error_hi 3.75e-08 3.63e-08 7.26e-08 2.92e-07 1.60e-07 3.63e-07 erg/cm2
Peak flux PL 7.64e-01 8.19e-01 6.23e-01 7.72e-01 2.50e+00 2.98e+00 ph/cm2/s
90%_error_low -8.79e-02 -6.00e-02 -5.72e-02 -1.35e-01 -1.74e-01 -2.20e-01 ph/cm2/s
90%_error_hi 9.04e-02 5.98e-02 5.70e-02 1.52e-01 1.74e-01 2.23e-01 ph/cm2/s
Fluence CPL 2.43e-07 3.29e-07 3.52e-07 6.92e-07 1.11e-06 1.65e-06 erg/cm2
90%_error_low -4.43e-08 -1.67e-07 -2.58e-07 -2.69e-07 -1.79e-07 -1.06e-06 erg/cm2
90%_error_hi 4.21e-08 4.48e-08 1.84e-08 1.57e-07 1.78e-07 1.29e-07 erg/cm2
Peak flux CPL 7.06e-01 8.76e-01 6.38e-01 3.58e-01 2.43e+00 2.58e+00 ph/cm2/s
90%_error_low -1.01e-01 -7.77e-02 -6.29e-02 -1.69e-01 -1.84e-01 -2.52e-01 ph/cm2/s
90%_error_hi 1.03e-01 8.09e-02 6.30e-02 3.22e-01 1.83e-01 3.47e-01 ph/cm2/s
======================================================================
Image
Pre-slew 15.0-350.0 keV image (Event data)
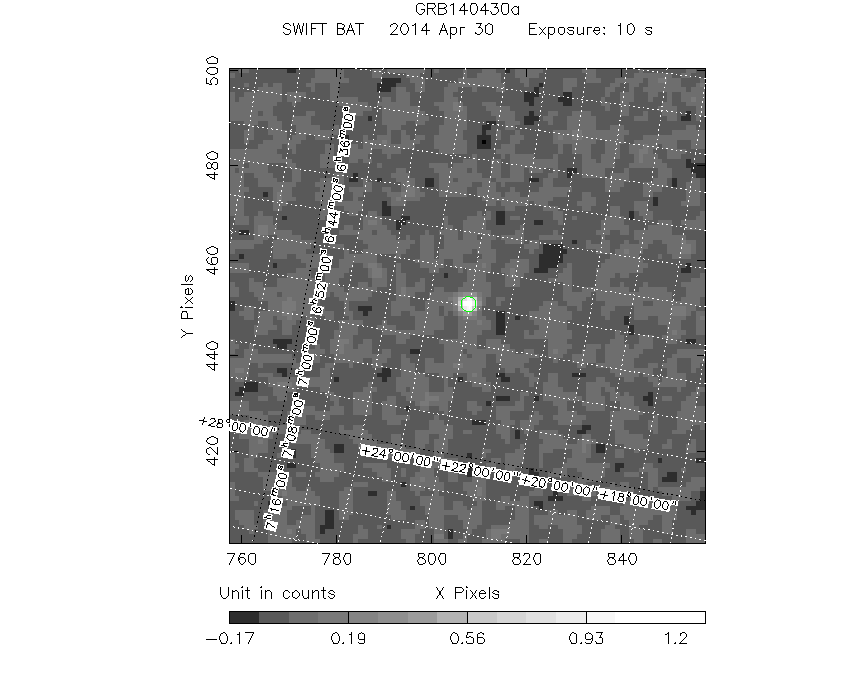
#   RAcent    DECcent   POSerr    Theta     Phi              Peak Cts       SNR   Name
  102.9379    23.0365   0.0066     9.1187    19.6796         1.2950529     28.828 TRIG_00597722

Foreground time interval of the image:
 -0.304  10.021 (delta_t =  10.325 [sec])
Background time interval of the image:
-179.480  -0.304 (delta_t = 179.176 [sec])
Light Curves
Note: The mask-weighted lightcurves have units of either count/det or counts/sec/det, where a det is 0.4 x 0.4 = 0.16 sq cm.
Full-time range; 1 s binning
Other quick-look light curves:
- 64 ms binning (zoomed)
- 16 ms binning (zoomed)
- 8 ms binning (zoomed)
- 2 ms binning (zoomed)
- SN=5 or 10 s binning (full-time range)
- Raw light curve
Spectra
- 64 ms binning (zoomed)
- 16 ms binning (zoomed)
- 8 ms binning (zoomed)
- 2 ms binning (zoomed)
- SN=5 or 10 s binning (full-time range)
- Raw light curve
Spectra
Notes:
- 1) The fitting includes the systematic errors.
- 2) When the burst includes telescope slew time periods, the fitting uses an average response file made from multiple 5-s response files through out the slew time plus single time preiod for the non-slew times, and weighted by the total counts in the corresponding time period using addrmf. An average response file is needed becuase a spectral fit using the pre-slew DRM will introduce some errors in both a spectral shape and a normalization if the PHA file contains a lot of the slew/post-slew time interval.
- 3) For fits to more complicated models (e.g. a power-law over a cutoff power-law), the BAT team has decided to require a chi-square improvement of more than 6 for each extra dof.
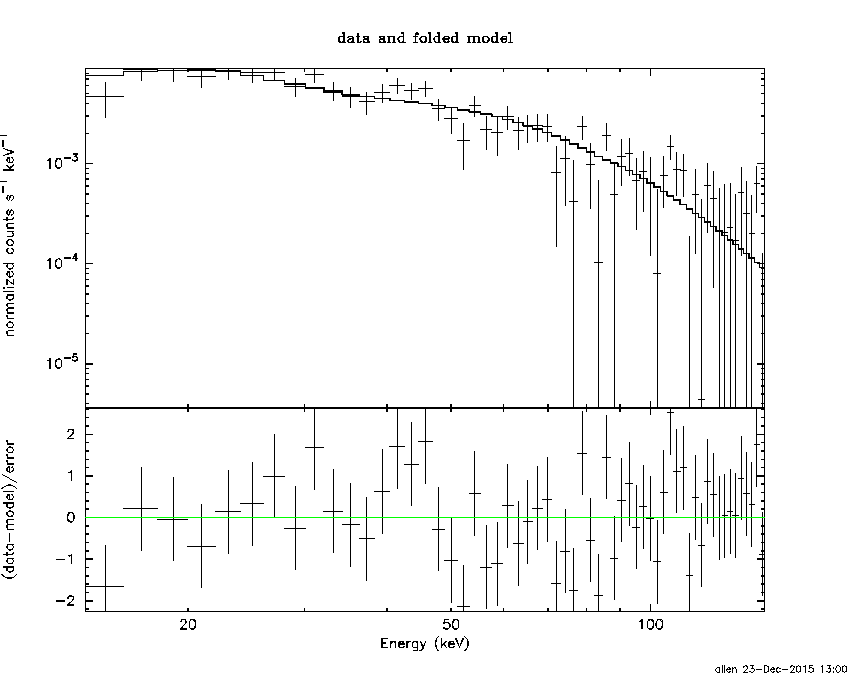
Time averaged spectrum fit using the average DRM
Power-law model
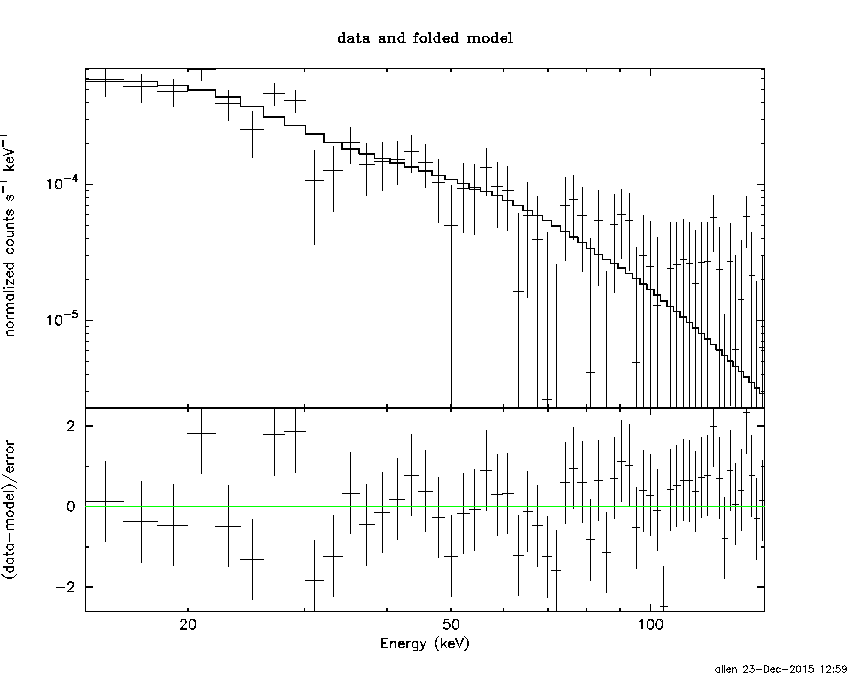
Time interval is from   -0.304 sec. to  177.576 sec.

Spectral model in power-law:
------------------------------------------------------------
Parameters  : value       lower 90%   higher 90%
Photon index: -2.00561     ( -0.230441   0.217254 )
Norm@50keV  : 6.90716E-04    ( -0.000103272   0.000100327 )
------------------------------------------------------------
#Fit statistic : Chi-Squared =          54.94 using 59 PHA bins.
# Reduced chi-squared =         0.9638 for     57 degrees of freedom
# Null hypothesis probability =   5.528264e-01

Photon flux (15-150 keV)    in 177.9 sec: 0.103883 ( -0.0106763  0.010678 ) ph/cm2/s
Energy fluence (15-150 keV)             : 1.13372e-06 ( -1.54015e-07  1.60314e-07 ) ergs/cm2
Cutoff power-law model
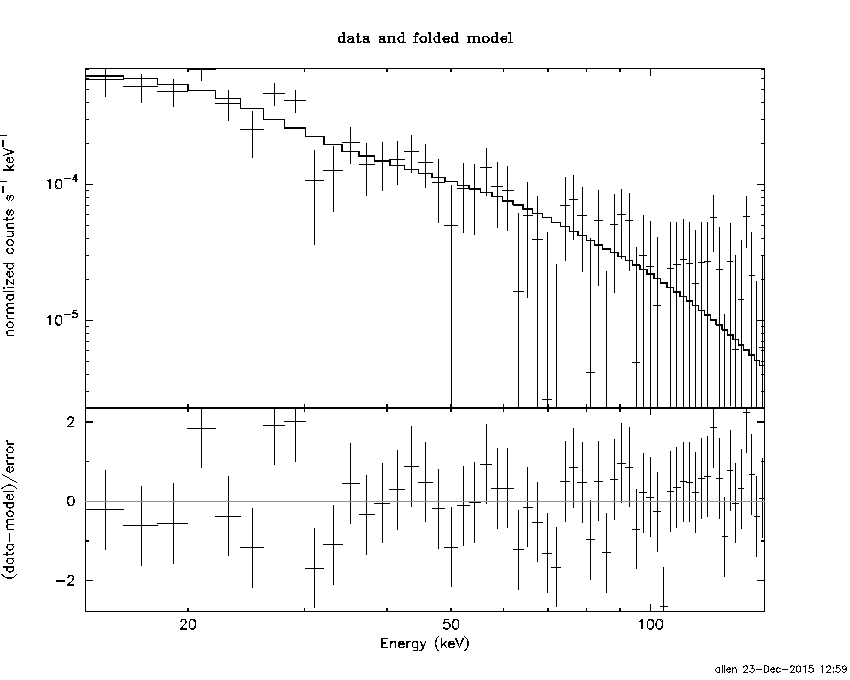
Time interval is from   -0.304 sec. to  177.576 sec.
Spectral model in the cutoff power-law:
------------------------------------------------------------
Parameters  : value       lower 90%   higher 90%
Photon index: -2.38858     ( -0.184899   0.65539 )
Epeak [keV] : 143.214      (   )
Norm@50keV  : 4.35877E-04    (     )
------------------------------------------------------------
#Fit statistic : Chi-Squared =          53.66 using 59 PHA bins.
# Reduced chi-squared =         0.9582 for     56 degrees of freedom
# Null hypothesis probability =   5.640469e-01

Photon flux (15-150 keV)    in 177.9 sec: 8.60012E-02 ( -0.020872  0.0268488 ) ph/cm2/s
Energy fluence (15-150 keV)             : 1.10567e-06 ( -1.79234e-07  1.77651e-07 ) ergs/cm2
1-s peak spectrum fit
Power-law model
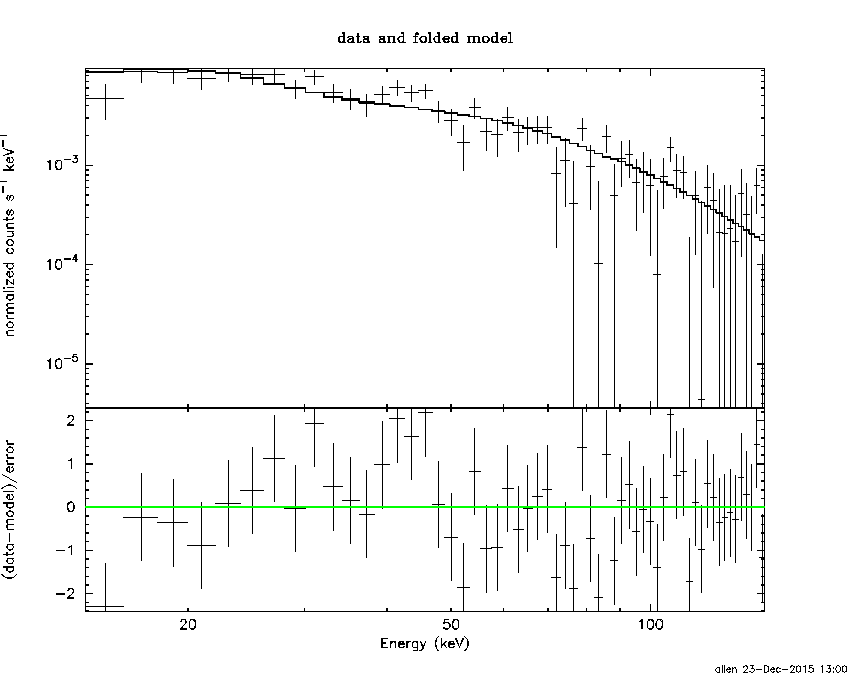
Time interval is from    2.440 sec. to    3.440 sec.

Spectral model in power-law:
------------------------------------------------------------
Parameters  : value       lower 90%   higher 90%
Photon index: -1.3949     ( -0.119909   0.11938 )
Norm@50keV  : 2.05371E-02    ( -0.00149145   0.00148451 )
------------------------------------------------------------
#Fit statistic : Chi-Squared =          65.12 using 59 PHA bins.
# Reduced chi-squared =          1.142 for     57 degrees of freedom
# Null hypothesis probability =   2.150654e-01

Photon flux (15-150 keV)    in 1 sec: 2.49821 ( -0.17434  0.17437 ) ph/cm2/s
Energy fluence (15-150 keV)             : 1.98674e-07 ( -1.6339e-08  1.65397e-08 ) ergs/cm2
Cutoff power-law model
Time interval is from    2.440 sec. to    3.440 sec.
Spectral model in the cutoff power-law:
------------------------------------------------------------
Parameters  : value       lower 90%   higher 90%
Photon index: -0.790201     ( -0.513853   0.604897 )
Epeak [keV] : 92.3218      ( -26.2996 226.221 )
Norm@50keV  : 4.35631E-02    ( -0.0202312   0.0485947 )
------------------------------------------------------------
#Fit statistic : Chi-Squared =          61.01 using 59 PHA bins.
# Reduced chi-squared =          1.089 for     56 degrees of freedom
# Null hypothesis probability =   3.007670e-01

Photon flux (15-150 keV)    in 1 sec: 2.43403 ( -0.1838  0.18307 ) ph/cm2/s
Energy fluence (15-150 keV)             : 1.85413e-07 ( -2.00608e-08  2.00199e-08 ) ergs/cm2
Time-resolved spectra
Distribution
T90 vs. Hardness ratio plot
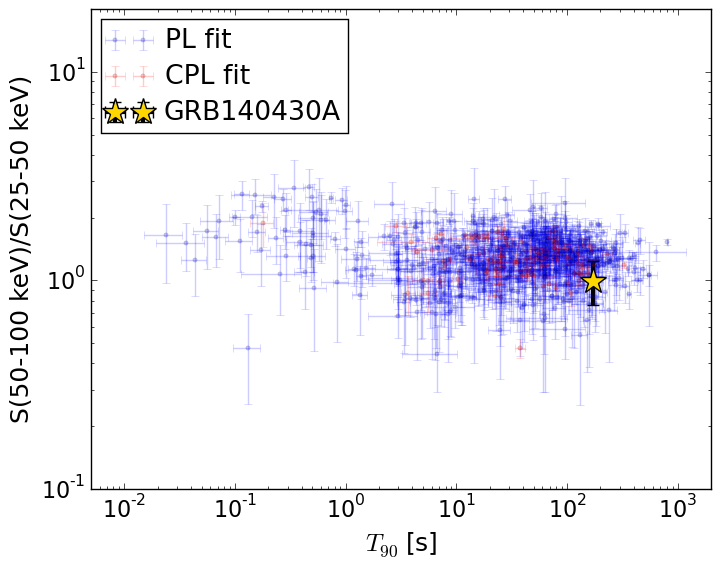
T90                                   = 173.588 sec.
Hardness ratio (energy fluence ratio) = 0.996139359836
S(15-50 keV) vs. S(50-150 keV) plot
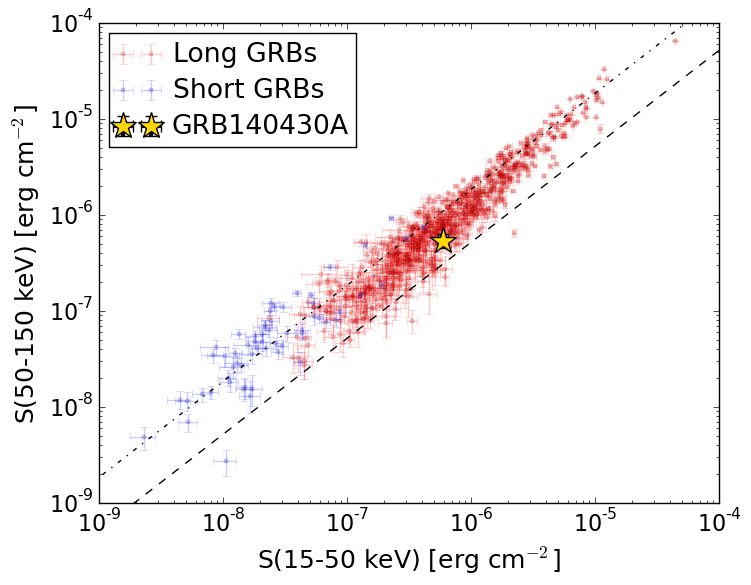
S(15-50 keV)  = 5.946281e-07
S(50-150 keV) = 5.390813e-07
The dash-dotted line and the dashed line traces the fluences calculated from the Band function with Epeak = 15 and 150 keV, respectively. Both lines assume a canonical values of alpha = -1 and beta = -2.5.
Mask shadow pattern
IMX = 1.511338956559928E-01, IMY = -5.405304042056846E-02
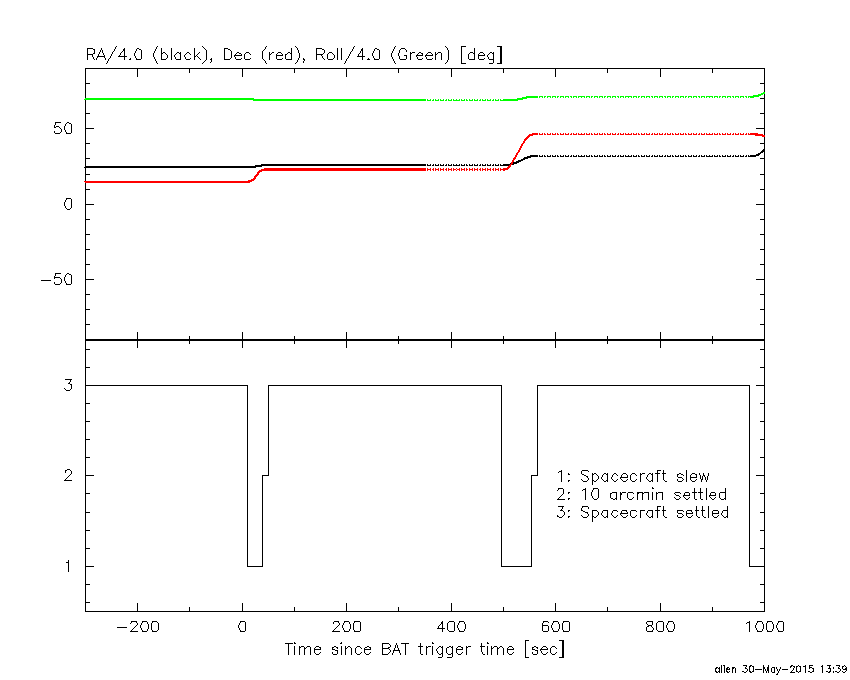
Spacecraft aspect plot
Bright source in the pre-burst/pre-slew/post-slew images
Pre-burst image of 15-350 keV band
Time interval of the image:
-179.480000 -0.304000

# RAcent  DECcent POSerr Theta    Phi  PeakCts   SNR AngSep     Name
#  [deg]    [deg]    ['] [deg]  [deg]                   [']
 83.6298  22.0065    0.5  15.6  -69.3   6.1255  23.5    0.5	Crab
146.9509  43.4228    3.2  50.1   37.2   4.1878   3.6 ------	UNKNOWN
143.4363  45.6388    3.1  48.6   33.2   3.6576   3.7 ------	UNKNOWN
123.8181  28.4858    2.6  27.1   47.9   1.2808   4.4 ------	UNKNOWN
103.2026  43.8474    3.0  29.1   -0.9   1.0431   3.8 ------	UNKNOWN
 87.4598  -3.4380    2.2  21.4 -157.0   1.1408   5.2 ------	UNKNOWN
 84.6893  31.5669    2.5  20.7  -42.8   1.1954   4.7 ------	UNKNOWN
 55.0304  30.4941    3.1  42.5  -69.1   4.0850   3.8 ------	UNKNOWN
Pre-slew background subtracted image of 15-350 keV band
Time interval of the image:
-0.304000 10.020600

# RAcent  DECcent POSerr Theta    Phi  PeakCts   SNR AngSep     Name
#  [deg]    [deg]    ['] [deg]  [deg]                   [']
 83.7102  22.0497    4.8  15.5  -69.1   0.1030   2.4    4.8	Crab
102.9379  23.0365    0.4   9.1   19.7   1.2952  28.8 ------	UNKNOWN
 56.1100  14.2489    2.3  40.8  -93.6   0.9758   5.1 ------	UNKNOWN
Post-slew image of 15-350 keV band
Time interval of the image:
39.820610 497.320600

# RAcent  DECcent POSerr Theta    Phi  PeakCts   SNR AngSep     Name
#  [deg]    [deg]    ['] [deg]  [deg]                   [']
 83.6331  22.0156    0.2  17.8  -94.3  19.2958  48.6    0.1	Crab
136.0031   8.4562    3.0  34.9  104.4   3.6354   3.8 ------	UNKNOWN
123.8870  64.8678    2.6  44.0    7.7   2.9215   4.5 ------	UNKNOWN
 98.1385 -25.9798    3.1  49.2 -179.2   3.4108   3.7 ------	UNKNOWN
 68.7343 -21.0558    4.5  55.2 -145.2   7.4792   2.6 ------	UNKNOWN