Analysis Summary
Notes:
- 1) No attempt has been made to eliminate the non-significant decimal places.
- 2) This batgrbproduct analysis is done using the HEASARC data.
- 3) This batgrbproduct analysis is using the flight position for the mask-weighting calculation.
======================================================================
BAT GRB EVENT DATA PROCESSING REPORT
Process Script Ver: batgrbproduct v2.46
Process Start Time: Sat Oct 4 23:10:17 EDT 2014
Host Name: batevent1
Current Working Dir: /local/data/batevent/batevent_reproc/trigger597841
======================================================================
Trigger: 00597841 Segment: 000
BAT Trigger Time: 420712232.448 [s; MET]
Trigger Stop: 420712233.472 [s; MET]
UTC: 2014-05-02T08:30:20.489000 [includes UTCF correction]
Where From?: TDRSS position message
BAT
RA: 319.15470216594 Dec: 49.0179516633632 [deg; J2000]
Catalogged Source?: NO
Point Source?: YES
GRB Indicated?: YES [ by BAT flight software ]
Image S/N Ratio: 7.76
Image Trigger?: NO
Rate S/N Ratio: 17.7763888346312 [ if not an image trigger ]
Image S/N Ratio: 7.76
Analysis Position: [ source = BAT ]
RA: 319.15470216594 Dec: 49.0179516633632 [deg; J2000]
Refined Position: [ source = BAT pre-slew burst ]
RA: 319.170479042702 Dec: 48.9775569616716 [deg; J2000]
{ 21h 16m 40.9s , +48d 58' 39.2" }
+/- 1.17278046971036 [arcmin] (estimated 90% radius based on SNR)
+/- 0.445183562930929 [arcmin] (formal 1-sigma fit error)
SNR: 24.2235251327384
Angular difference between the analysis and refined position is 2.501990 arcmin
Partial Coding Fraction: 0.9921875 [ including projection effects ]
Duration
T90: 15.1199999451637 +/- 1.88811543107599
Measured from: -0.952000021934509
to: 14.1679999232292 [s; relative to TRIGTIME]
T50: 7.13199996948242 +/- 1.16295486297824
Measured from: 1.18799996376038
to: 8.3199999332428 [s; relative to TRIGTIME]
Fluence
Peak Flux (peak 1 second)
Measured from: 1.44400000572205
to: 2.44400000572205 [s; relative to TRIGTIME]
Total Fluence
Measured from: -1.66400003433228
to: 17.3919999599457 [s; relative to TRIGTIME]
Band 1 Band 2 Band 3 Band 4
15-25 25-50 50-100 100-350 keV
Total 0.270291 0.340163 0.334148 0.111486
0.023581 0.024420 0.021357 0.017615 [error]
Peak 0.029760 0.046509 0.026514 0.015679
0.005608 0.005797 0.005060 0.004228 [error]
[ fluence units of on-axis counts / fully illuminated detector ]
======================================================================
====== Table of the duration information =============================
Value tstart tstop
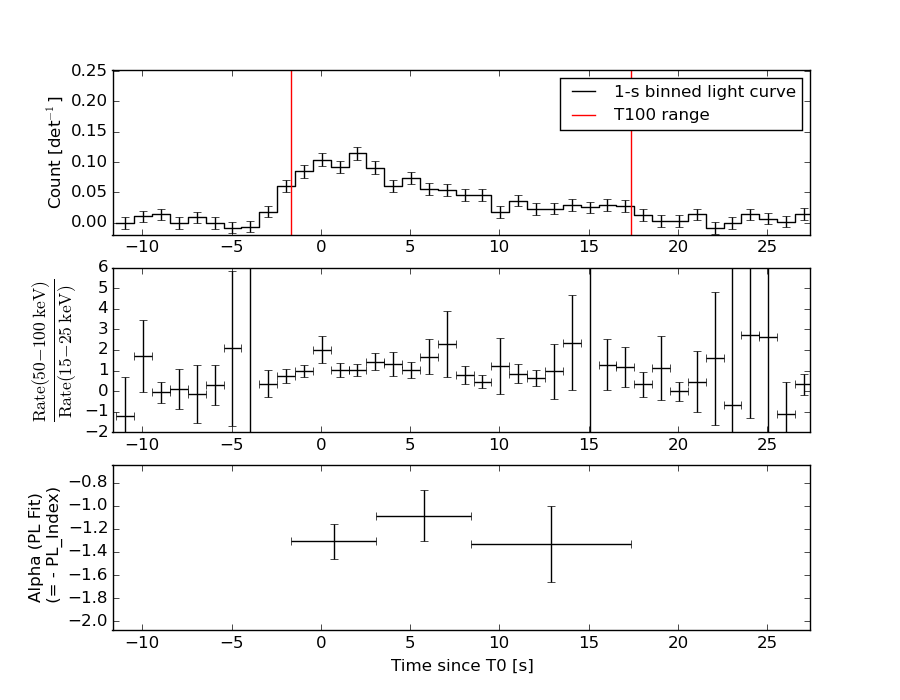
T100 19.056 -1.664 17.392
T90 15.120 -0.952 14.168
T50 7.132 1.188 8.320
Peak 1.000 1.444 2.444
====== Spectral Analysis Summary =====================================
Model : spectral model: simple power-law (PL) and cutoff power-law (CPL)
Ph_index : photon index: E^{Ph_index}
Ph_90err : 90% error of the photon index
Epeak : Epeak in keV
Epeak_90err: 90% error of Epeak
Norm : normalization at 50 keV in both the PL model and CPL model
Nomr_90err : 90% error of the normalization
chi2 : Chi-Squared
dof : degree of freedo
=== Time-averaged spectral analysis ===
(Best model with acceptable fit: PL)
Model Ph_index Ph_90err_low Ph_90err_hi Epeak Epeak_90err_low Epeak_90err_hi Norm Nomr_90err_low Norm_90err_hi chi2 dof
PL -1.225 -0.131 0.132 - - - 3.52e-03 -2.40e-04 2.40e-04 51.170 57
CPL -1.227 -0.125 0.140 9999.360 -9999.360 -9999.360 3.53e-03 -2.41e-04 6.25e-04 51.220 56
=== 1-s peak spectral analysis ===
(Best model with acceptable fit: PL)
Model Ph_index Ph_90err_low Ph_90err_hi Epeak Epeak_90err_low Epeak_90err_hi Norm Nomr_90err_low Norm_90err_hi chi2 dof
PL -1.497 -0.267 0.262 - - - 6.99e-03 -1.10e-03 1.08e-03 67.270 57
CPL -1.346 -0.420 1.049 201.582 -201.582 -201.582 8.44e-03 -2.54e-03 2.17e-02 67.310 56
=== Fluence/Peak Flux Summary ===
Model Band1 Band2 Band3 Band4 Band5 Total
15-25 25-50 50-100 100-350 15-150 15-350 keV
Fluence PL 6.62e-08 1.44e-07 2.46e-07 9.73e-07 6.75e-07 1.43e-06 erg/cm2
90%_error_low -9.09e-09 -1.16e-08 -2.07e-08 -1.79e-07 -5.16e-08 -1.92e-07 erg/cm2
90%_error_hi 9.53e-09 1.15e-08 2.05e-08 2.06e-07 5.19e-08 2.15e-07 erg/cm2
Peak flux PL 2.87e-01 2.89e-01 2.05e-01 2.31e-01 8.72e-01 1.01e+00 ph/cm2/s
90%_error_low -6.82e-02 -4.43e-02 -4.15e-02 -8.27e-02 -1.28e-01 -1.55e-01 ph/cm2/s
90%_error_hi 7.21e-02 4.39e-02 4.12e-02 1.08e-01 1.29e-01 1.57e-01 ph/cm2/s
Fluence CPL 5.30e-08 6.87e-08 6.82e-08 1.51e-07 2.31e-07 3.39e-07 erg/cm2
90%_error_low -1.26e-08 -1.41e-08 -3.27e-08 -3.97e-08 -6.31e-08 -1.98e-07 erg/cm2
90%_error_hi 1.19e-08 1.10e-08 9.12e-09 4.11e-08 3.00e-08 4.10e-08 erg/cm2
Peak flux CPL 2.86e-01 2.90e-01 2.05e-01 2.22e-01 8.71e-01 1.00e+00 ph/cm2/s
90%_error_low -7.81e-02 -4.45e-02 -4.18e-02 -2.22e-01 -1.31e-01 -2.28e-01 ph/cm2/s
90%_error_hi 6.45e-02 5.71e-02 4.40e-02 6.87e-02 1.29e-01 1.62e-01 ph/cm2/s
======================================================================
Image
Pre-slew 15.0-350.0 keV image (Event data)
#   RAcent    DECcent   POSerr    Theta     Phi              Peak Cts       SNR   Name
  319.1705    48.9776   0.0079    10.4621   142.0517         1.0414320     24.224 TRIG_00597841

Foreground time interval of the image:
 -1.664  16.453 (delta_t =  18.117 [sec])
Background time interval of the image:
-378.947 -363.368 (delta_t =  15.579 [sec])
-239.448  -1.664 (delta_t = 237.784 [sec])
Light Curves
Note: The mask-weighted lightcurves have units of either count/det or counts/sec/det, where a det is 0.4 x 0.4 = 0.16 sq cm.
Full-time range; 1 s binning
Other quick-look light curves:
- 64 ms binning (zoomed)
- 16 ms binning (zoomed)
- 8 ms binning (zoomed)
- 2 ms binning (zoomed)
- SN=5 or 10 s binning (full-time range)
- Raw light curve
Spectra
- 64 ms binning (zoomed)
- 16 ms binning (zoomed)
- 8 ms binning (zoomed)
- 2 ms binning (zoomed)
- SN=5 or 10 s binning (full-time range)
- Raw light curve
Spectra
Notes:
- 1) The fitting includes the systematic errors.
- 2) When the burst includes telescope slew time periods, the fitting uses an average response file made from multiple 5-s response files through out the slew time plus single time preiod for the non-slew times, and weighted by the total counts in the corresponding time period using addrmf. An average response file is needed becuase a spectral fit using the pre-slew DRM will introduce some errors in both a spectral shape and a normalization if the PHA file contains a lot of the slew/post-slew time interval.
- 3) For fits to more complicated models (e.g. a power-law over a cutoff power-law), the BAT team has decided to require a chi-square improvement of more than 6 for each extra dof.
Time averaged spectrum fit using the average DRM
Power-law model
Time interval is from   -1.664 sec. to   17.392 sec.

Spectral model in power-law:
------------------------------------------------------------
Parameters  : value       lower 90%   higher 90%
Photon index: -1.22493     ( -0.131083   0.132111 )
Norm@50keV  : 3.51691E-03    ( -0.000240042   0.000240037 )
------------------------------------------------------------
#Fit statistic : Chi-Squared =          51.17 using 59 PHA bins.
# Reduced chi-squared =         0.8978 for     57 degrees of freedom
# Null hypothesis probability =   6.923041e-01

Photon flux (15-150 keV)    in 19.06 sec: 0.414323 ( -0.029496  0.029621 ) ph/cm2/s
Energy fluence (15-150 keV)             : 6.7545e-07 ( -5.15676e-08  5.18989e-08 ) ergs/cm2
Cutoff power-law model
Time interval is from   -1.664 sec. to   17.392 sec.
Spectral model in the cutoff power-law:
------------------------------------------------------------
Parameters  : value       lower 90%   higher 90%
Photon index: -1.22732     ( -0.125889   0.13947 )
Epeak [keV] : 9999.36      ( -9999.36 -9999.36 )
Norm@50keV  : 3.53282E-03    ( -0.000240926   0.000625273 )
------------------------------------------------------------
#Fit statistic : Chi-Squared =          51.22 using 59 PHA bins.
# Reduced chi-squared =         0.9146 for     56 degrees of freedom
# Null hypothesis probability =   6.560583e-01

Photon flux (15-150 keV)    in 19.06 sec: 0.414224 ( -0.029532  0.029592 ) ph/cm2/s
Energy fluence (15-150 keV)             : 2.3074e-07 ( -6.31254e-08  3.00027e-08 ) ergs/cm2
1-s peak spectrum fit
Power-law model
Time interval is from    1.444 sec. to    2.444 sec.

Spectral model in power-law:
------------------------------------------------------------
Parameters  : value       lower 90%   higher 90%
Photon index: -1.49709     ( -0.26691   0.261691 )
Norm@50keV  : 6.99272E-03    ( -0.00110209   0.00108362 )
------------------------------------------------------------
#Fit statistic : Chi-Squared =          67.27 using 59 PHA bins.
# Reduced chi-squared =          1.180 for     57 degrees of freedom
# Null hypothesis probability =   1.658211e-01

Photon flux (15-150 keV)    in 1 sec: 0.872307 ( -0.128458  0.128533 ) ph/cm2/s
Energy fluence (15-150 keV)             : 6.63758e-08 ( -1.1514e-08  1.17618e-08 ) ergs/cm2
Cutoff power-law model

Time interval is from    1.444 sec. to    2.444 sec.
Spectral model in the cutoff power-law:
------------------------------------------------------------
Parameters  : value       lower 90%   higher 90%
Photon index: -1.49464     ( -0.410458   1.05877 )
Epeak [keV] : 9816.53      ( -9607.09 -9607.09 )
Norm@50keV  : 7.01408E-03    ( -0.001111   0.0231445 )
------------------------------------------------------------
#Fit statistic : Chi-Squared =          67.27 using 59 PHA bins.
# Reduced chi-squared =          1.201 for     56 degrees of freedom
# Null hypothesis probability =   1.439886e-01

Photon flux (15-150 keV)    in 1 sec: 0.871413 ( -0.130845  0.128907 ) ph/cm2/s
Energy fluence (15-150 keV)             : 6.61957e-08 ( -1.37959e-08  1.18322e-08 ) ergs/cm2
Time-resolved spectra
Distribution
T90 vs. Hardness ratio plot
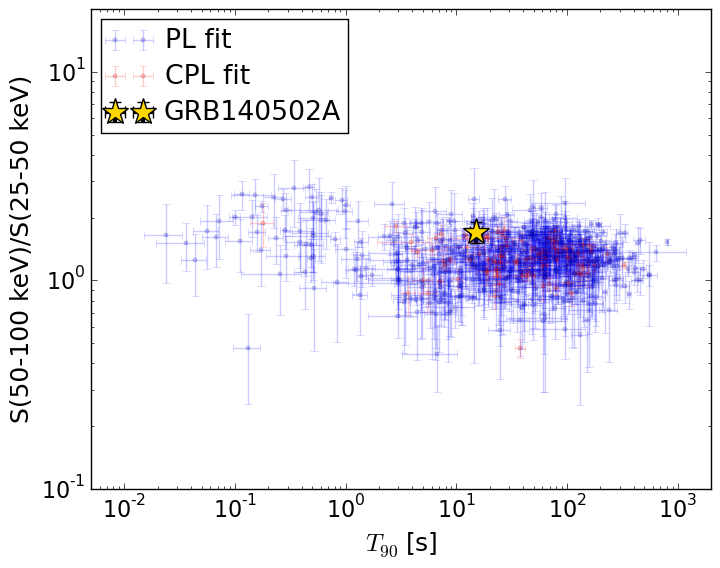
T90                                   = 15.12 sec.
Hardness ratio (energy fluence ratio) = 1.71127594481
S(15-50 keV) vs. S(50-150 keV) plot

S(15-50 keV)  = 2.1016901e-07
S(50-150 keV) = 4.65284e-07
The dash-dotted line and the dashed line traces the fluences calculated from the Band function with Epeak = 15 and 150 keV, respectively. Both lines assume a canonical values of alpha = -1 and beta = -2.5.
Mask shadow pattern
IMX = -1.456122689975370E-01, IMY = -1.135532740789120E-01
Spacecraft aspect plot
Bright source in the pre-burst/pre-slew/post-slew images
Pre-burst image of 15-350 keV band
Time interval of the image:
-378.947400 -363.368000
-239.448000 -1.664000

# RAcent  DECcent POSerr Theta    Phi  PeakCts   SNR AngSep     Name
#  [deg]    [deg]    ['] [deg]  [deg]                   [']
299.6101  35.2055    0.4  25.1   92.4   7.5200  25.6    1.0	Cyg X-1
308.0788  40.9288    1.6  16.9  101.5   1.6202   7.4    2.0	Cyg X-3
325.9846  38.2923    3.9   5.4   52.1   0.5762   2.9    9.0	Cyg X-2
317.2819  29.1254    3.7  17.1   52.2   0.6376   3.2 ------	UNKNOWN
 21.4544  65.0066    2.5  36.1 -137.9   1.5757   4.6 ------	UNKNOWN
Pre-slew background subtracted image of 15-350 keV band
Time interval of the image:
-1.664000 16.452590

# RAcent  DECcent POSerr Theta    Phi  PeakCts   SNR AngSep     Name
#  [deg]    [deg]    ['] [deg]  [deg]                   [']
299.5279  35.0195   10.4  25.3   92.1  -0.0744  -1.1   11.3	Cyg X-1
308.1179  41.1127    6.5  16.9  102.0  -0.0906  -1.8    9.6	Cyg X-3
326.0660  38.2588    3.9   5.4   51.3  -0.1303  -3.0    6.2	Cyg X-2
319.1704  48.9775    0.5  10.5  142.1   1.0417  24.2 ------	UNKNOWN
340.3747  29.6298    2.4  14.9  -26.2   0.2096   4.9 ------	UNKNOWN
352.6700   3.7953    2.3  43.2  -24.6   0.3778   5.1  495.0	UNKNOWN
Post-slew image of 15-350 keV band
Time interval of the image:
53.852580 962.619600

# RAcent  DECcent POSerr Theta    Phi  PeakCts   SNR AngSep     Name
#  [deg]    [deg]    ['] [deg]  [deg]                   [']
288.7746  10.9177    2.5  45.7   47.2   9.7284   4.5    2.2	GRS 1915+105
299.5808  35.1984    0.2  19.9   56.7  27.9296  46.0    0.5	Cyg X-1
308.0643  40.9793    1.3  11.2   51.7   4.7860   8.9    2.6	Cyg X-3
326.3154  38.1699    6.0  12.0  -24.8   1.1833   1.9   11.3	Cyg X-2
323.7408  27.8798    3.1  21.4   -7.9   2.1343   3.7 ------	UNKNOWN
125.1162  72.1822    3.1  58.4 -171.7  12.2244   3.8 ------	UNKNOWN
338.5381  -3.9118    3.1  55.5  -20.4   8.0747   3.7 ------	UNKNOWN
 12.3958  35.3688    4.7  40.8  -87.7   9.8102   2.5 ------	UNKNOWN