Analysis Summary
Notes:
- 1) No attempt has been made to eliminate the non-significant decimal places.
- 2) This batgrbproduct analysis is done using the HEASARC data.
- 3) This batgrbproduct analysis is using the flight position for the mask-weighting calculation.
======================================================================
BAT GRB EVENT DATA PROCESSING REPORT
Process Script Ver: batgrbproduct v2.46
Process Start Time: Sat Oct 4 23:05:44 EDT 2014
Host Name: batevent1
Current Working Dir: /local/data/batevent/batevent_reproc/trigger598284
======================================================================
Trigger: 00598284 Segment: 000
BAT Trigger Time: 421103268.8 [s; MET]
Trigger Stop: 421103269.824 [s; MET]
UTC: 2014-05-06T21:07:36.822400 [includes UTCF correction]
Where From?: TDRSS position message
BAT
RA: 276.789901704877 Dec: -55.5621609300121 [deg; J2000]
Catalogged Source?: NO
Point Source?: YES
GRB Indicated?: YES [ by BAT flight software ]
Image S/N Ratio: 12.41
Image Trigger?: NO
Rate S/N Ratio: 41.4487635521254 [ if not an image trigger ]
Image S/N Ratio: 12.41
Analysis Position: [ source = BAT ]
RA: 276.789901704877 Dec: -55.5621609300121 [deg; J2000]
Refined Position: [ source = BAT pre-slew burst ]
RA: 276.807481011087 Dec: -55.5561962834224 [deg; J2000]
{ 18h 27m 13.8s , -55d 33' 22.3" }
+/- 1.58177295917385 [arcmin] (estimated 90% radius based on SNR)
+/- 0.608742520706948 [arcmin] (formal 1-sigma fit error)
SNR: 15.7988960479555
Angular difference between the analysis and refined position is 0.695642 arcmin
Partial Coding Fraction: 0.1162109 [ including projection effects ]
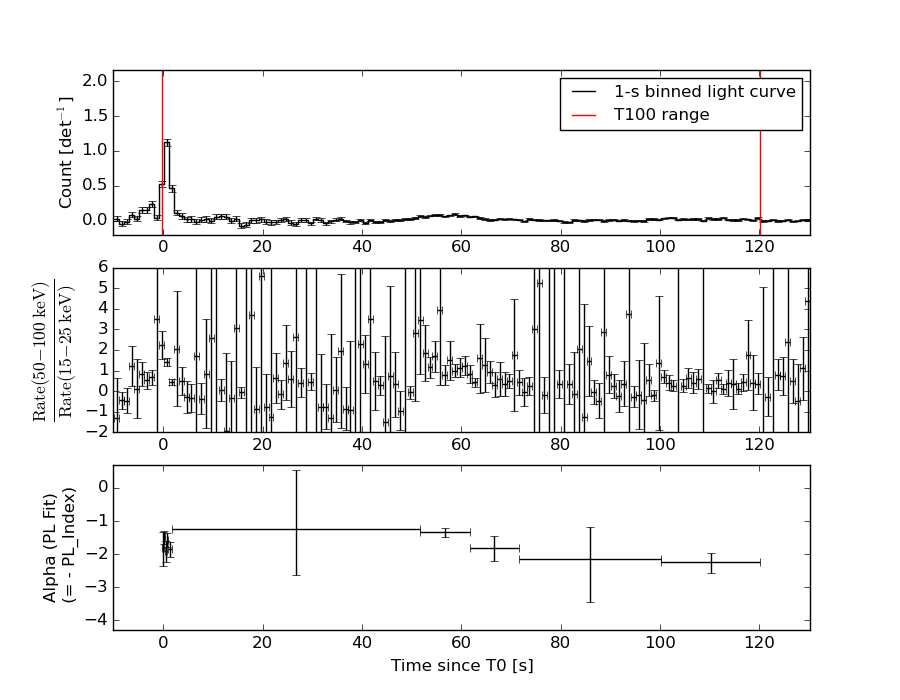
Duration
T90: 111.103999972343 +/- 9.54671488141262
Measured from: 0.0999999642372131
to: 111.203999936581 [s; relative to TRIGTIME]
T50: 60.3559999465942 +/- 6.5170695850662
Measured from: 0.783999979496002
to: 61.1399999260902 [s; relative to TRIGTIME]
Fluence
Peak Flux (peak 1 second)
Measured from: 0.00400000810623169
to: 1.00400000810623 [s; relative to TRIGTIME]
Total Fluence
Measured from: -0.196000039577484
to: 120.175999999046 [s; relative to TRIGTIME]
Band 1 Band 2 Band 3 Band 4
15-25 25-50 50-100 100-350 keV
Total 1.099321 1.450953 1.225410 0.314412
0.134694 0.129023 0.108604 0.090748 [error]
Peak 0.261797 0.399078 0.444168 0.160300
0.027738 0.032687 0.031638 0.022688 [error]
[ fluence units of on-axis counts / fully illuminated detector ]
======================================================================
====== Table of the duration information =============================
Value tstart tstop
T100 120.372 -0.196 120.176
T90 111.104 0.100 111.204
T50 60.356 0.784 61.140
Peak 1.000 0.004 1.004
====== Spectral Analysis Summary =====================================
Model : spectral model: simple power-law (PL) and cutoff power-law (CPL)
Ph_index : photon index: E^{Ph_index}
Ph_90err : 90% error of the photon index
Epeak : Epeak in keV
Epeak_90err: 90% error of Epeak
Norm : normalization at 50 keV in both the PL model and CPL model
Nomr_90err : 90% error of the normalization
chi2 : Chi-Squared
dof : degree of freedo
=== Time-averaged spectral analysis ===
(Best model with acceptable fit: PL)
Model Ph_index Ph_90err_low Ph_90err_hi Epeak Epeak_90err_low Epeak_90err_hi Norm Nomr_90err_low Norm_90err_hi chi2 dof
PL -1.557 -0.165 0.164 - - - 2.35e-03 -2.16e-04 2.16e-04 46.550 57
CPL -1.449 -1.063 0.575 271.007 -271.007 -271.007 2.65e-03 -1.77e-03 2.22e-03 46.580 56
=== 1-s peak spectral analysis ===
(Best model with acceptable fit: CPL)
Model Ph_index Ph_90err_low Ph_90err_hi Epeak Epeak_90err_low Epeak_90err_hi Norm Nomr_90err_low Norm_90err_hi chi2 dof
PL -1.358 -0.125 0.125 - - - 9.05e-02 -7.10e-03 7.10e-03 61.810 57
CPL -0.530 -0.561 0.646 100.377 -21.884 88.186 2.17e-01 -9.52e-02 2.01e-01 55.120 56
=== Fluence/Peak Flux Summary ===
Model Band1 Band2 Band3 Band4 Band5 Total
15-25 25-50 50-100 100-350 15-150 15-350 keV
Fluence PL 3.81e-07 6.77e-07 9.20e-07 2.58e-06 2.66e-06 4.56e-06 erg/cm2
90%_error_low -6.20e-08 -6.75e-08 -1.08e-07 -6.06e-07 -2.60e-07 -6.92e-07 erg/cm2
90%_error_hi 6.51e-08 6.68e-08 1.07e-07 7.21e-07 2.61e-07 7.80e-07 erg/cm2
Peak flux PL 3.25e+00 3.56e+00 2.78e+00 3.56e+00 1.09e+01 1.31e+01 ph/cm2/s
90%_error_low -4.55e-01 -3.25e-01 -2.46e-01 -5.96e-01 -9.05e-01 -1.04e+00 ph/cm2/s
90%_error_hi 4.76e-01 3.22e-01 2.44e-01 6.56e-01 9.08e-01 1.04e+00 ph/cm2/s
Fluence CPL 3.79e-07 6.79e-07 9.23e-07 2.45e-06 2.66e-06 4.43e-06 erg/cm2
90%_error_low -7.60e-08 -6.91e-08 -1.11e-07 -1.37e-06 -2.76e-07 -1.39e-06 erg/cm2
90%_error_hi 5.37e-08 7.66e-08 1.19e-07 2.95e-07 2.65e-07 8.71e-07 erg/cm2
Peak flux CPL 2.66e+00 3.77e+00 3.10e+00 1.86e+00 1.06e+01 1.14e+01 ph/cm2/s
90%_error_low -5.70e-01 -3.70e-01 -3.27e-01 -6.37e-01 -9.24e-01 -1.16e+00 ph/cm2/s
90%_error_hi 5.98e-01 3.76e-01 3.34e-01 1.00e+00 9.27e-01 1.32e+00 ph/cm2/s
======================================================================
Image
Pre-slew 15.0-350.0 keV image (Event data)
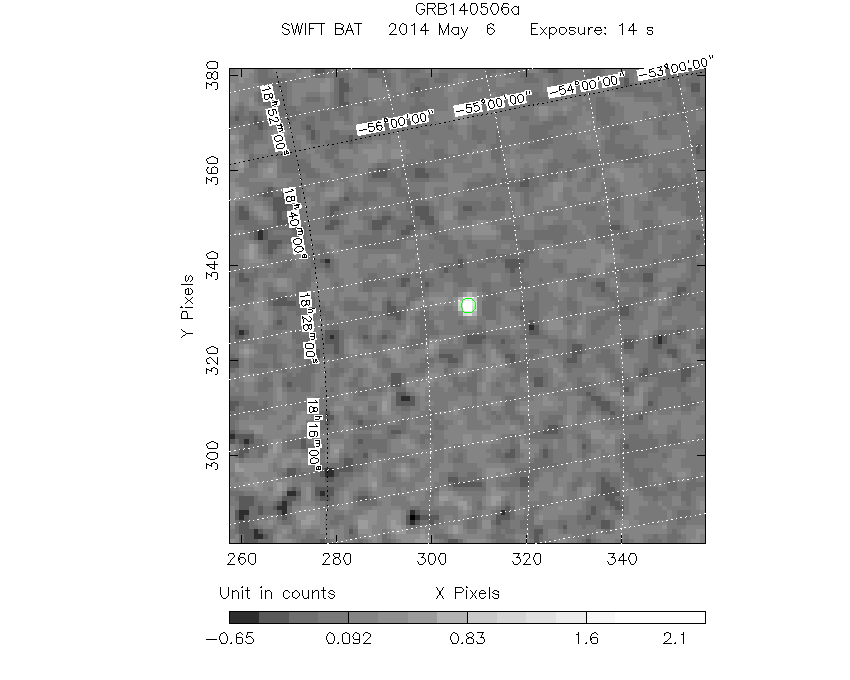
#   RAcent    DECcent   POSerr    Theta     Phi              Peak Cts       SNR   Name
  276.8075   -55.5562   0.0122    51.1079    14.2302         2.5505097     15.799 TRIG_00598284

Foreground time interval of the image:
 -0.196  14.301 (delta_t =  14.497 [sec])
Background time interval of the image:
-239.800  -0.196 (delta_t = 239.604 [sec])
Light Curves
Note: The mask-weighted lightcurves have units of either count/det or counts/sec/det, where a det is 0.4 x 0.4 = 0.16 sq cm.
Full-time range; 1 s binning
Other quick-look light curves:
- 64 ms binning (zoomed)
- 16 ms binning (zoomed)
- 8 ms binning (zoomed)
- 2 ms binning (zoomed)
- SN=5 or 10 s binning (full-time range)
- Raw light curve
Spectra
- 64 ms binning (zoomed)
- 16 ms binning (zoomed)
- 8 ms binning (zoomed)
- 2 ms binning (zoomed)
- SN=5 or 10 s binning (full-time range)
- Raw light curve
Spectra
Notes:
- 1) The fitting includes the systematic errors.
- 2) When the burst includes telescope slew time periods, the fitting uses an average response file made from multiple 5-s response files through out the slew time plus single time preiod for the non-slew times, and weighted by the total counts in the corresponding time period using addrmf. An average response file is needed becuase a spectral fit using the pre-slew DRM will introduce some errors in both a spectral shape and a normalization if the PHA file contains a lot of the slew/post-slew time interval.
- 3) For fits to more complicated models (e.g. a power-law over a cutoff power-law), the BAT team has decided to require a chi-square improvement of more than 6 for each extra dof.
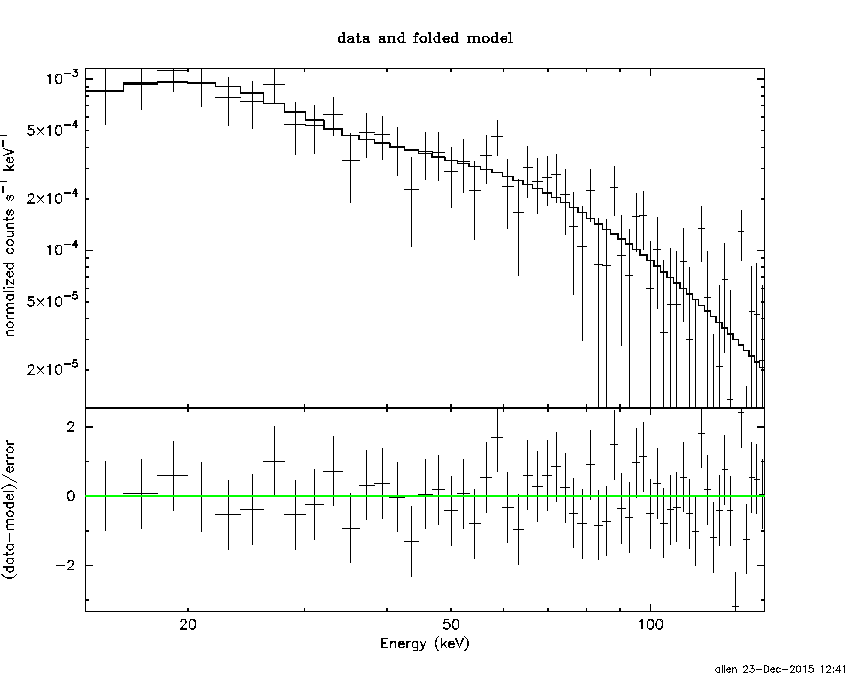
Time averaged spectrum fit using the average DRM
Power-law model

Time interval is from   -0.196 sec. to  120.176 sec.

Spectral model in power-law:
------------------------------------------------------------
Parameters  : value       lower 90%   higher 90%
Photon index: -1.55681     ( -0.164956   0.164168 )
Norm@50keV  : 2.35195E-03    ( -0.000216091   0.000215592 )
------------------------------------------------------------
#Fit statistic : Chi-Squared =          46.55 using 59 PHA bins.
# Reduced chi-squared =         0.8167 for     57 degrees of freedom
# Null hypothesis probability =   8.370117e-01

Photon flux (15-150 keV)    in 120.4 sec: 0.298341 ( -0.028845  0.029007 ) ph/cm2/s
Energy fluence (15-150 keV)             : 2.66365e-06 ( -2.59579e-07  2.61157e-07 ) ergs/cm2
Cutoff power-law model
Time interval is from   -0.196 sec. to  120.176 sec.
Spectral model in the cutoff power-law:
------------------------------------------------------------
Parameters  : value       lower 90%   higher 90%
Photon index: -1.55443     ( -1.05694   0.581167 )
Epeak [keV] : 9981.81      ( -9978.78 -9978.78 )
Norm@50keV  : 2.35830E-03    ( -0.00147435   0.00251309 )
------------------------------------------------------------
#Fit statistic : Chi-Squared =          46.55 using 59 PHA bins.
# Reduced chi-squared =         0.8312 for     56 degrees of freedom
# Null hypothesis probability =   8.118712e-01

Photon flux (15-150 keV)    in 120.4 sec: 0.297755 ( -0.030136  0.029443 ) ph/cm2/s
Energy fluence (15-150 keV)             : 2.65795e-06 ( -2.76199e-07  2.64764e-07 ) ergs/cm2
1-s peak spectrum fit
Power-law model
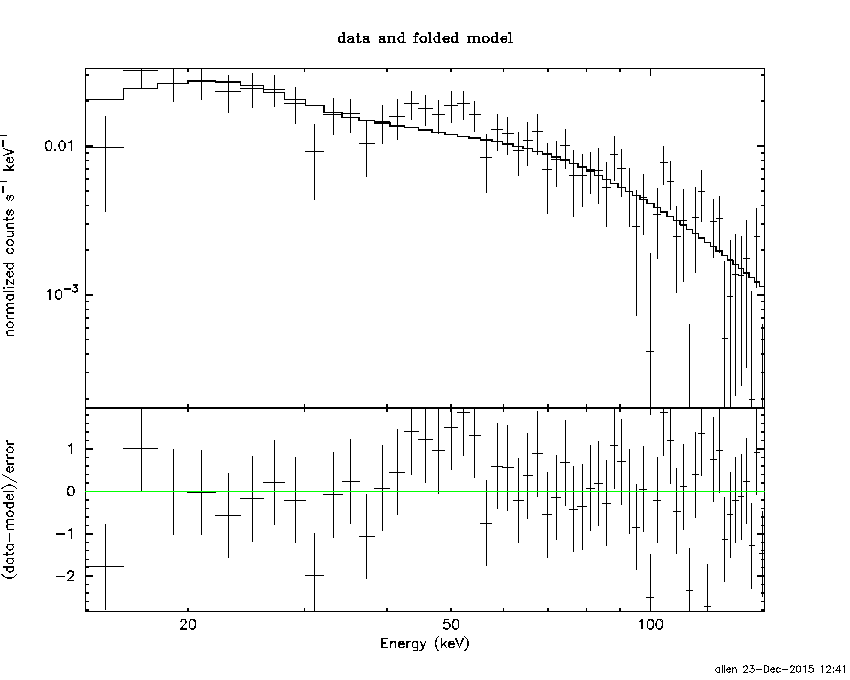
Time interval is from    0.004 sec. to    1.004 sec.

Spectral model in power-law:
------------------------------------------------------------
Parameters  : value       lower 90%   higher 90%
Photon index: -1.35842     ( -0.124748   0.124817 )
Norm@50keV  : 9.04534E-02    ( -0.00710032   0.00710019 )
------------------------------------------------------------
#Fit statistic : Chi-Squared =          61.81 using 59 PHA bins.
# Reduced chi-squared =          1.084 for     57 degrees of freedom
# Null hypothesis probability =   3.083586e-01

Photon flux (15-150 keV)    in 1 sec: 10.9163 ( -0.9055  0.9075 ) ph/cm2/s
Energy fluence (15-150 keV)             : 8.81881e-07 ( -7.2841e-08  7.30676e-08 ) ergs/cm2
Cutoff power-law model
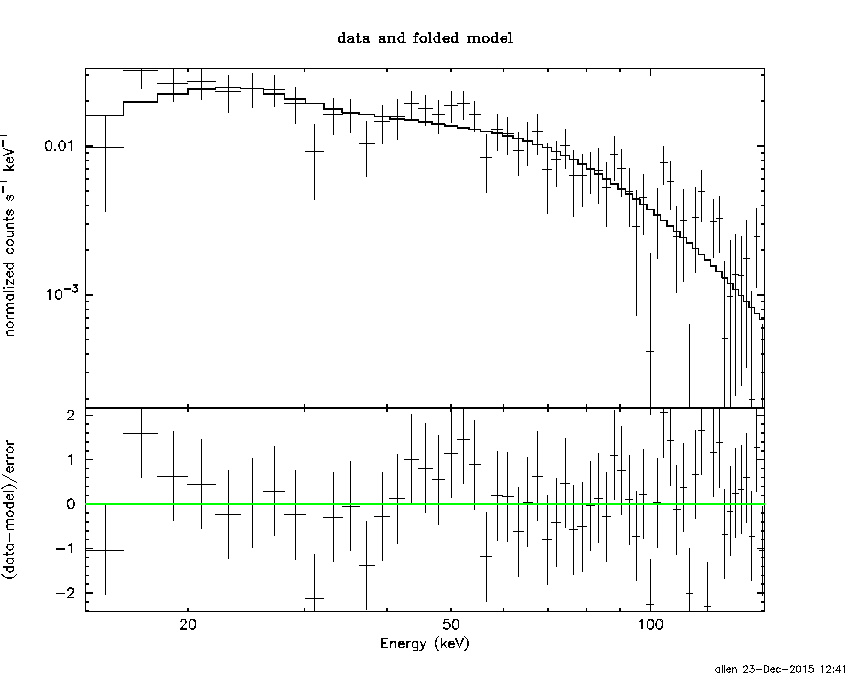
Time interval is from    0.004 sec. to    1.004 sec.
Spectral model in the cutoff power-law:
------------------------------------------------------------
Parameters  : value       lower 90%   higher 90%
Photon index: -0.529779     ( -0.560671   0.645502 )
Epeak [keV] : 100.377      ( -21.8836 88.1868 )
Norm@50keV  : 0.216936    ( -0.09521   0.200754 )
------------------------------------------------------------
#Fit statistic : Chi-Squared =          55.12 using 59 PHA bins.
# Reduced chi-squared =         0.9843 for     56 degrees of freedom
# Null hypothesis probability =   5.080341e-01

Photon flux (15-150 keV)    in 1 sec: 10.6416 ( -0.9238  0.9271 ) ph/cm2/s
Energy fluence (15-150 keV)             : 8.67022e-07 ( -7.53596e-08  7.51713e-08 ) ergs/cm2
Time-resolved spectra
Distribution
T90 vs. Hardness ratio plot
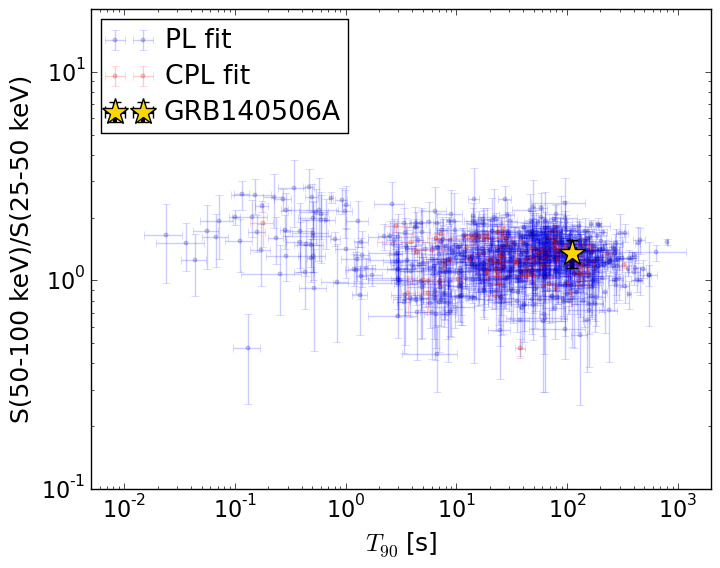
T90                                   = 111.104 sec.
Hardness ratio (energy fluence ratio) = 1.35962752986
S(15-50 keV) vs. S(50-150 keV) plot
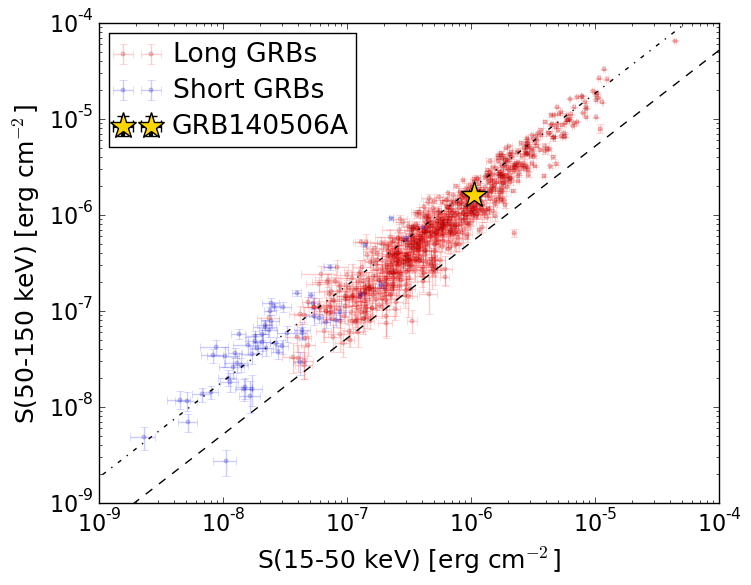
S(15-50 keV)  = 1.0583062e-06
S(50-150 keV) = 1.6053351e-06
The dash-dotted line and the dashed line traces the fluences calculated from the Band function with Epeak = 15 and 150 keV, respectively. Both lines assume a canonical values of alpha = -1 and beta = -2.5.
Mask shadow pattern
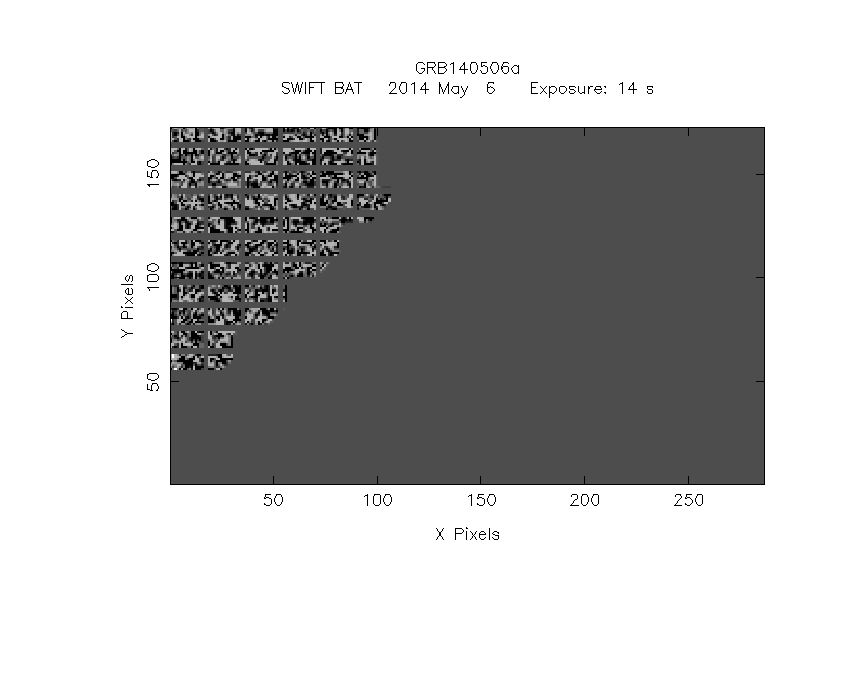
IMX = 1.201626225300685E+00, IMY = -3.047330864359771E-01
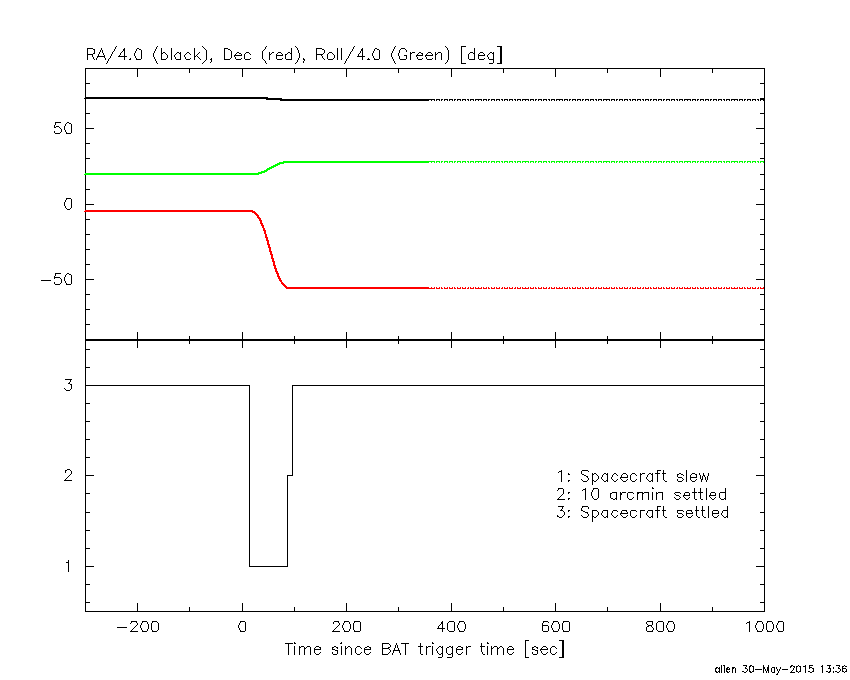
Spacecraft aspect plot
Bright source in the pre-burst/pre-slew/post-slew images
Pre-burst image of 15-350 keV band
Time interval of the image:
-239.800000 -0.196000

# RAcent  DECcent POSerr Theta    Phi  PeakCts   SNR AngSep     Name
#  [deg]    [deg]    ['] [deg]  [deg]                   [']
245.0185 -15.5481    1.0  37.3   81.2   8.2223  11.3    6.0	Sco X-1
254.4440  35.4139    2.9  47.3  160.9   2.5486   3.9    4.3	Her X-1
256.0467 -37.7470    1.2  40.4   42.3   5.2208  10.0    6.5	4U 1700-377
256.4653 -36.4078    5.8  39.1   43.3   0.9450   2.0    1.7	GX 349+2
262.9656 -24.8885    7.4  26.9   50.1   0.4649   1.6    8.9	GX 1+4
264.6541 -44.3550    6.3  42.4   28.7   0.8393   1.8    6.9	4U 1735-44
268.3678  -1.4734    7.4  13.3  114.1   0.3503   1.6    1.3	SW J1753.5-0127
270.3326 -25.0275    2.6  23.0   37.1   1.0874   4.4    4.1	GX 5-1
270.4489 -25.7466    4.2  23.6   36.0   0.6893   2.8    7.9	GRS 1758-258
274.1001 -13.9288    2.9  11.7   47.6   0.8769   4.0    8.5	GX 17+2
275.9258 -30.3615   11.3  26.3   21.5   0.2406   1.0    0.3	H1820-303
285.1716 -24.9622   14.8  20.7    1.0   0.1712   0.8    7.8	HT1900.1-2455
288.8222  11.0269    1.1  17.3 -143.4   2.5000  10.3    5.1	GRS 1915+105
299.6301  35.2796    0.8  43.4 -147.1   6.3977  14.3    5.1	Cyg X-1
308.1484  40.8270   32.8  51.6 -143.2   0.3652   0.4    7.7	Cyg X-3
262.8173 -33.8036    5.5  33.9   39.1  -0.7765  -2.1    8.8	GX 354-0
251.4174  -8.9725    2.4  30.0   90.9   1.9994   4.8 ------	UNKNOWN
309.1816  44.7055    9.6  55.3 -145.1   1.8582   1.2 ------	UNKNOWN
Pre-slew background subtracted image of 15-350 keV band
Time interval of the image:
-0.196000 14.300730

# RAcent  DECcent POSerr Theta    Phi  PeakCts   SNR AngSep     Name
#  [deg]    [deg]    ['] [deg]  [deg]                   [']
244.8321 -15.7173    4.3  37.5   81.0   0.4005   2.7    9.7	Sco X-1
254.5610  35.4731   12.3  47.2  161.1  -0.1135  -0.9    9.3	Her X-1
255.8226 -37.8679    7.7  40.6   42.4  -0.1732  -1.5    7.9	4U 1700-377
256.5127 -36.3734    7.4  39.1   43.3   0.1641   1.5    4.8	GX 349+2
262.8248 -24.6139    5.3  26.8   50.7   0.1257   2.2   12.8	GX 1+4
264.5278 -44.2996    0.0  42.4   28.8  -0.1098  -1.2   12.9	4U 1735-44
268.2333  -1.5508    8.9  13.4  113.6   0.0571   1.3   10.0	SW J1753.5-0127
270.1207 -25.0616   10.0  23.1   37.5  -0.0553  -1.2    8.9	GX 5-1
270.4302 -25.5850    0.0  23.4   36.2   0.0259   0.5   11.7	GRS 1758-258
274.0078 -14.1862    6.6  12.0   47.2  -0.0765  -1.7    9.0	GX 17+2
275.7837 -30.4405    5.4  26.4   21.7  -0.1079  -2.1    8.5	H1820-303
284.9187 -24.9485    5.0  20.7    1.6  -0.0995  -2.3    6.6	HT1900.1-2455
288.6995  10.7800   11.6  17.0 -143.4   0.0431   1.0   11.5	GRS 1915+105
299.5344  35.2021   17.0  43.3 -147.1   0.0543   0.7    2.7	Cyg X-1
307.9570  40.9336   10.5  51.6 -143.4   0.1739   1.1    7.0	Cyg X-3
262.9519 -33.8700    6.4  33.9   38.9   0.1336   1.8    2.8	GX 354-0
276.8075 -55.5562    0.7  51.1   14.2   2.5505  15.8 ------	UNKNOWN
295.6500  34.0154    2.5  40.9 -150.7   0.3036   4.7 ------	UNKNOWN
Post-slew image of 15-350 keV band
Time interval of the image:
86.700590 962.234000

# RAcent  DECcent POSerr Theta    Phi  PeakCts   SNR AngSep     Name
#  [deg]    [deg]    ['] [deg]  [deg]                   [']
170.6770 -60.5833    7.0  50.0   15.9   2.8106   1.7   10.9	Cen X-3
186.5134 -62.7928    4.5  42.8   20.2   2.9657   2.5    4.2	GX 301-2
255.9754 -37.8345    0.4  22.6  111.2  22.7705  30.1    0.8	4U 1700-377
256.4569 -36.4925    3.4  23.6  113.8   2.6884   3.4    4.3	GX 349+2
262.9999 -24.6710    5.1  32.6  134.3   2.3564   2.3    4.5	GX 1+4
264.7140 -44.6084    8.9  13.4  118.2   0.8495   1.3    9.6	4U 1735-44
270.3266 -25.0501    4.2  31.0  146.6   2.4592   2.7    2.9	GX 5-1
270.3533 -25.7905    2.2  30.2  146.4   4.7888   5.2    4.0	GRS 1758-258
274.0276 -14.0898    5.0  41.6  153.9   3.6029   2.3    3.4	GX 17+2
275.7394 -30.3838    6.8  25.3  155.9   1.2808   1.7    9.7	H1820-303
285.0031 -24.8830    5.0  31.4  172.4   1.7400   2.3    2.9	HT1900.1-2455
263.1737 -33.7577    7.2  23.8  129.0   1.1613   1.6   10.3	GX 354-0
266.1693 -28.7477    1.9  28.0  137.8   4.8197   5.9 ------	UNKNOWN
256.7784 -45.0019    2.6  16.5   99.7   2.8512   4.5 ------	UNKNOWN
277.3329 -23.8112    2.9  31.9  158.9   3.7237   4.0 ------	UNKNOWN
278.5908 -32.3578    3.2  23.3  161.9   2.4480   3.6 ------	UNKNOWN
181.3127 -73.4057    2.7  39.1    4.7   3.9804   4.2 ------	UNKNOWN
322.7008 -15.5385    4.0  53.2 -142.2  14.9497   2.9 ------	UNKNOWN