Analysis Summary
Notes:
- 1) No attempt has been made to eliminate the non-significant decimal places.
- 2) This batgrbproduct analysis is done using the HEASARC data.
- 3) This batgrbproduct analysis is using the flight position for the mask-weighting calculation.
======================================================================
                  BAT GRB EVENT DATA PROCESSING REPORT
    Process Script Ver: batgrbproduct v2.46
    Process Start Time: Sat Oct  4 22:58:09 EDT 2014
             Host Name: batevent1
   Current Working Dir: /local/data/batevent/batevent_reproc/trigger598819
======================================================================

  Trigger: 00598819      Segment: 000

  BAT Trigger Time: 421615921.216   [s; MET]
      Trigger Stop: 421615922.24   [s; MET]
               UTC: 2014-05-12T19:31:49.213860    [includes UTCF correction]
       Where From?: TDRSS position message

  BAT
    RA: 289.370983958512   Dec: -15.1000413136453  [deg; J2000]

     Catalogged Source?: NO
     Point Source?:      YES
     GRB Indicated?:     YES    [ by BAT flight software ]
     Image S/N Ratio:    9.32
     Image Trigger?:     NO
     Rate S/N Ratio:     38.262252939418  [ if not an image trigger ]
     Image S/N Ratio:    9.32

  Analysis Position:   [ source = BAT ]
    RA: 289.370983958512   Dec: -15.1000413136453  [deg; J2000]

  Refined Position:   [ source = BAT pre-slew burst ]
    RA: 289.367745296306   Dec: -15.087767583728  [deg; J2000]
        { 19h 17m 28.3s , -15d 05' 16.0" }
         +/- 1.08204657231282 [arcmin] (estimated 90% radius based on SNR)
         +/- 0.403694690422524 [arcmin] (formal 1-sigma fit error)
    SNR: 27.1766292143837

  Angular difference between the analysis and refined position is 0.759947 arcmin

  Partial Coding Fraction: 0.3515625    [ including projection effects ]

  Duration
     T90: 154.111999928951 +/- 4.65279486164575
        Measured from: -6.16000002622604
                   to: 147.951999902725     [s; relative to TRIGTIME]
     T50: 87.0079999566078 +/- 39.4964509467811
        Measured from: 39.8039999604225
                   to: 126.81199991703     [s; relative to TRIGTIME]


  Fluence
     Peak Flux  (peak 1 second)
        Measured from: 121.955999970436
                   to: 122.955999970436     [s; relative to TRIGTIME]
     Total Fluence
        Measured from: -22.8400000333786
                   to: 178.148000001907     [s; relative to TRIGTIME]

             Band 1     Band 2     Band 3     Band 4
              15-25      25-50     50-100    100-350     keV
 Total     5.085401   7.200180   6.160241   1.960332
           0.115467   0.114804   0.099383   0.081717 [error]
 Peak      0.171697   0.284736   0.249809   0.090281
           0.008516   0.009750   0.009623   0.007320 [error]

     [ fluence units of on-axis counts / fully illuminated detector ]

======================================================================


====== Table of the duration information =============================

        Value   tstart    tstop
T100  200.988  -22.840  178.148
T90   154.112   -6.160  147.952
T50    87.008   39.804  126.812
Peak    1.000  121.956  122.956


====== Spectral Analysis Summary =====================================

Model      : spectral model: simple power-law (PL) and cutoff power-law (CPL)
Ph_index   : photon index: E^{Ph_index}
Ph_90err   : 90% error of the photon index
Epeak      : Epeak in keV
Epeak_90err: 90% error of Epeak
Norm       : normalization at 50 keV in both the PL model and CPL model
Nomr_90err : 90% error of the normalization
chi2       : Chi-Squared
dof        : degree of freedo

=== Time-averaged spectral analysis ===
(Best model with acceptable fit: PL)

Model Ph_index Ph_90err_low Ph_90err_hi  Epeak  Epeak_90err_low  Epeak_90err_hi  Norm       Nomr_90err_low    Norm_90err_hi    chi2    dof
PL      -1.335    -0.040      0.040       -           -               -         6.62e-03     -1.36e-04          1.36e-04      47.430   57
CPL     -1.292    -0.079      0.001      982.496    -982.496      -982.496      6.91e-03     -3.96e-04          1.73e-04      49.120   56


=== 1-s peak spectral analysis ===
(Best model with acceptable fit: PL)

Model Ph_index Ph_90err_low Ph_90err_hi  Epeak  Epeak_90err_low  Epeak_90err_hi  Norm       Nomr_90err_low    Norm_90err_hi    chi2    dof
PL      -1.244     -0.070     0.070       -           -               -         5.12e-02     -2.01e-03          2.01e-03      57.070   57
CPL     -1.007     -0.257     0.294      224.843     -95.781      -224.843      6.63e-02     -1.59e-02          2.45e-02      54.950   56


=== Fluence/Peak Flux Summary ===

              Model    Band1     Band2     Band3     Band4     Band5     Total
                       15-25     25-50    50-100    100-350    15-150    15-350    keV
Fluence         PL   1.46e-06  2.96e-06  4.69e-06  1.65e-05  1.30e-05  2.56e-05   erg/cm2
      90%_error_low -6.68e-08 -7.83e-08 -1.06e-07 -9.00e-07 -2.69e-07 -9.31e-07   erg/cm2
      90%_error_hi   6.82e-08  7.82e-08  1.06e-07  9.38e-07  2.69e-07  9.61e-07   erg/cm2
Peak flux       PL   1.65e+00  1.93e+00  1.63e+00  2.34e+00  6.05e+00  7.55e+00   ph/cm2/s
      90%_error_low -1.23e-01 -8.73e-02 -7.72e-02 -2.28e-01 -2.42e-01 -3.14e-01   ph/cm2/s
      90%_error_hi   1.26e-01  8.69e-02  7.69e-02  2.44e-01  2.42e-01  3.17e-01   ph/cm2/s

Fluence        CPL   1.45e-06  2.95e-06  4.70e-06  1.64e-05  1.30e-05  2.57e-05   erg/cm2
      90%_error_low    N/A    -6.84e-08 -1.07e-07    N/A    -2.69e-07 -2.13e-06   erg/cm2
      90%_error_hi     N/A     8.81e-08  1.06e-07    N/A     2.69e-07  2.76e-07   erg/cm2
Peak flux      CPL   1.57e+00  1.97e+00  1.67e+00  1.79e+00  5.98e+00  6.99e+00   ph/cm2/s
      90%_error_low -1.54e-01 -9.59e-02 -8.89e-02 -4.66e-01 -2.56e-01 -5.43e-01   ph/cm2/s
      90%_error_hi   1.57e-01  9.70e-02  8.99e-02  6.20e-01  2.56e-01  6.96e-01   ph/cm2/s

======================================================================
Image
Pre-slew 15.0-350.0 keV image (Event data)
#   RAcent    DECcent   POSerr    Theta     Phi              Peak Cts       SNR   Name
  289.3677   -15.0878   0.0071    41.7138   163.9018         4.0752894     27.177 TRIG_00598819

Foreground time interval of the image:
-22.840  15.885 (delta_t =  38.725 [sec])
Background time interval of the image:
-239.216 -22.840 (delta_t = 216.376 [sec])
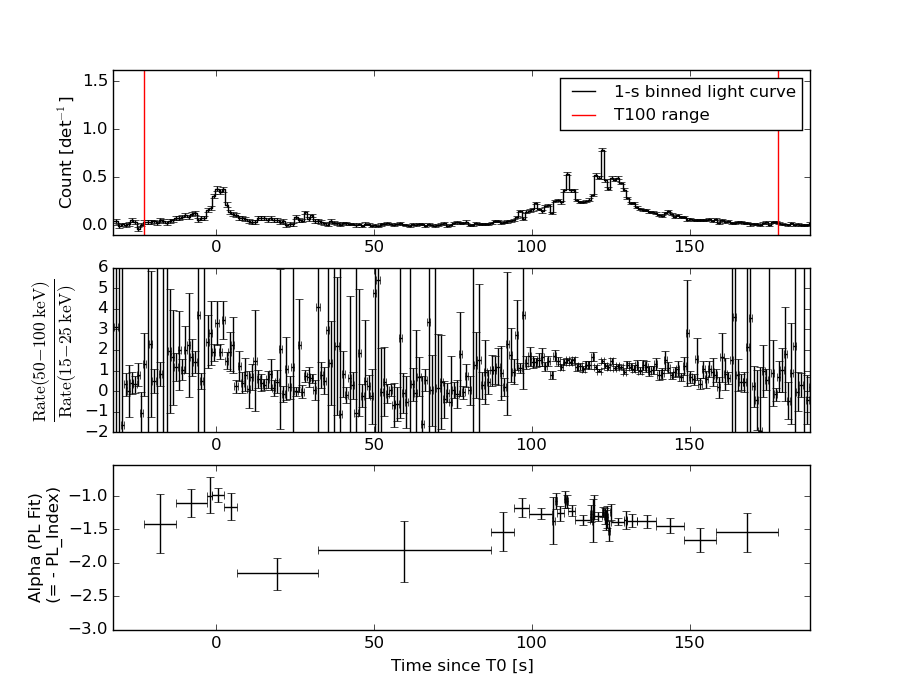
Light Curves
Note: The mask-weighted lightcurves have units of either count/det or counts/sec/det, where a det is 0.4 x 0.4 = 0.16 sq cm.
Full-time range; 1 s binning
Other quick-look light curves:
Spectra
Notes:
- 1) The fitting includes the systematic errors.
- 2) When the burst includes telescope slew time periods, the fitting uses an average response file made from multiple 5-s response files through out the slew time plus single time preiod for the non-slew times, and weighted by the total counts in the corresponding time period using addrmf. An average response file is needed becuase a spectral fit using the pre-slew DRM will introduce some errors in both a spectral shape and a normalization if the PHA file contains a lot of the slew/post-slew time interval.
- 3) For fits to more complicated models (e.g. a power-law over a cutoff power-law), the BAT team has decided to require a chi-square improvement of more than 6 for each extra dof.
Time averaged spectrum fit using the average DRM
Power-law model

Time interval is from  -22.840 sec. to  178.148 sec.

Spectral model in power-law:
------------------------------------------------------------
Parameters  : value       lower 90%   higher 90%
Photon index: -1.33528     ( -0.0399804   0.0401106 )
Norm@50keV  : 6.62100E-03    ( -0.000136079   0.000135857 )
------------------------------------------------------------
#Fit statistic : Chi-Squared =          47.43 using 59 PHA bins.
# Reduced chi-squared =         0.8322 for     57 degrees of freedom
# Null hypothesis probability =   8.127998e-01

Photon flux (15-150 keV)    in 201 sec: 0.795275 ( -0.018709  0.018781 ) ph/cm2/s
Energy fluence (15-150 keV)             : 1.3043e-05 ( -2.68976e-07  2.68827e-07 ) ergs/cm2
Cutoff power-law model
Time interval is from  -22.840 sec. to  178.148 sec.
Spectral model in the cutoff power-law:
------------------------------------------------------------
Parameters  : value       lower 90%   higher 90%
Photon index: -1.33192     ( -0.0397301   0.0409298 )
Epeak [keV] : 9999.28      ( -9999.36 -9999.36 )
Norm@50keV  : 6.64720E-03    ( -0.00013466   0.000434912 )
------------------------------------------------------------
#Fit statistic : Chi-Squared =          47.57 using 59 PHA bins.
# Reduced chi-squared =         0.8495 for     56 degrees of freedom
# Null hypothesis probability =   7.812485e-01

Photon flux (15-150 keV)    in 201 sec: 0.804841 ( -0.028534  0.008961 ) ph/cm2/s
Energy fluence (15-150 keV)             : 1.30397e-05 ( -2.68914e-07  2.68753e-07 ) ergs/cm2
1-s peak spectrum fit
Power-law model
Time interval is from  121.956 sec. to  122.956 sec.

Spectral model in power-law:
------------------------------------------------------------
Parameters  : value       lower 90%   higher 90%
Photon index: -1.24366     ( -0.070413   0.0703834 )
Norm@50keV  : 5.12170E-02    ( -0.00200799   0.0020073 )
------------------------------------------------------------
#Fit statistic : Chi-Squared =          57.07 using 59 PHA bins.
# Reduced chi-squared =          1.001 for     57 degrees of freedom
# Null hypothesis probability =   4.723094e-01

Photon flux (15-150 keV)    in 1 sec: 6.05145 ( -0.2421  0.24228 ) ph/cm2/s
Energy fluence (15-150 keV)             : 5.13499e-07 ( -2.28397e-08  2.29272e-08 ) ergs/cm2
Cutoff power-law model
Time interval is from  121.956 sec. to  122.956 sec.
Spectral model in the cutoff power-law:
------------------------------------------------------------
Parameters  : value       lower 90%   higher 90%
Photon index: -1.0074     ( -0.256629   0.294231 )
Epeak [keV] : 224.843      ( -95.7821 -224.844 )
Norm@50keV  : 6.63390E-02    ( -0.0158709   0.0244594 )
------------------------------------------------------------
#Fit statistic : Chi-Squared =          54.95 using 59 PHA bins.
# Reduced chi-squared =         0.9812 for     56 degrees of freedom
# Null hypothesis probability =   5.146848e-01

Photon flux (15-150 keV)    in 1 sec: 5.97986 ( -0.25587  0.25557 ) ph/cm2/s
Energy fluence (15-150 keV)             : 5.04871e-07 ( -2.52259e-08  2.5073e-08 ) ergs/cm2
Time-resolved spectra
Distribution
T90 vs. Hardness ratio plot
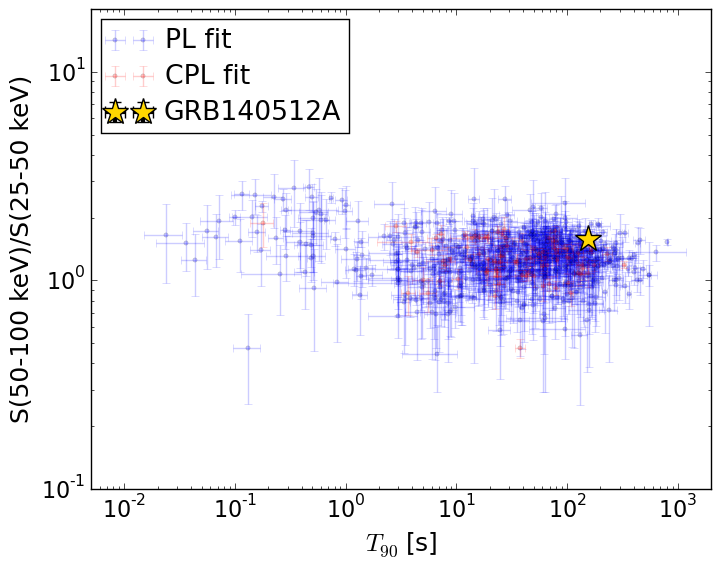
T90                                   = 154.112 sec.
Hardness ratio (energy fluence ratio) = 1.58529474849
S(15-50 keV) vs. S(50-150 keV) plot
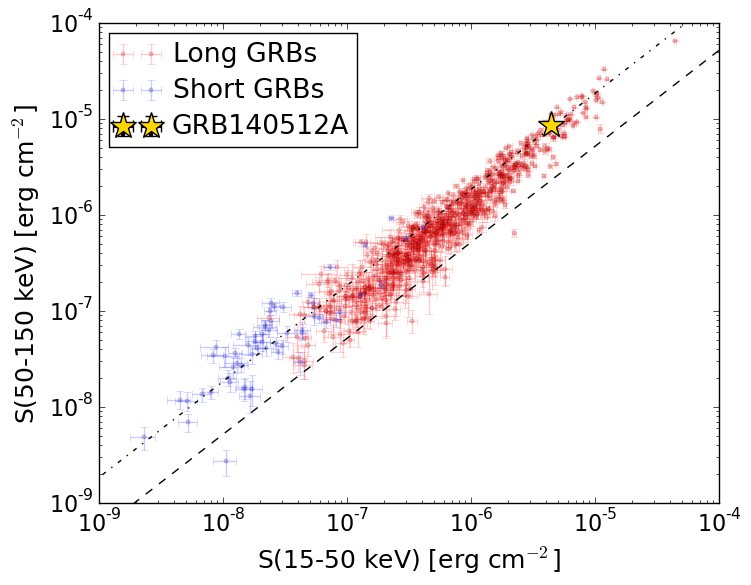
S(15-50 keV)  = 4.417094e-06
S(50-150 keV) = 8.62577e-06
The dash-dotted line and the dashed line traces the fluences calculated from the Band function with Epeak = 15 and 150 keV, respectively. Both lines assume a canonical values of alpha = -1 and beta = -2.5.
Mask shadow pattern
IMX = -8.564446874304327E-01, IMY = -2.471704571567579E-01
Spacecraft aspect plot
Bright source in the pre-burst/pre-slew/post-slew images
Pre-burst image of 15-350 keV band
Time interval of the image:
-239.216000 -22.840000

# RAcent  DECcent POSerr Theta    Phi  PeakCts   SNR AngSep     Name
#  [deg]    [deg]    ['] [deg]  [deg]                   [']
170.3244 -60.6096   11.8  50.1    3.2   0.4465   1.0    0.8	Cen X-3
186.7299 -62.7983    2.5  42.7    7.7   1.4707   4.6    2.6	GX 301-2
256.0208 -37.8326    1.8  22.6   98.8   1.7734   6.5    1.8	4U 1700-377
256.4436 -36.4107    4.5  23.7  101.3   0.7502   2.5    0.8	GX 349+2
262.8256 -24.7152    5.6  32.6  121.5  -0.7749  -2.1   10.2	GX 1+4
264.6517 -44.5791  111.3  13.5  105.6   0.0190   0.1    8.7	4U 1735-44
270.3416 -25.1413    3.6  30.9  134.1   0.9915   3.2    4.9	GX 5-1
270.3496 -25.6025    6.0  30.4  134.0   0.6063   2.0    8.8	GRS 1758-258
273.9621 -14.1687    3.8  41.5  141.3   1.6290   3.0    8.3	GX 17+2
275.9595 -30.5580    0.0  25.1  143.8   0.2650   1.2   11.6	H1820-303
285.1332 -25.0264   20.5  31.2  160.2   0.1565   0.6    8.3	HT1900.1-2455
262.7581 -33.8133    4.2  23.9  115.7  -0.7328  -2.8   11.6	GX 354-0
265.6340 -27.7539    1.5  29.0  124.8   2.2836   7.8 ------	UNKNOWN
311.0286 -11.7755    3.1  51.3 -169.7   2.1383   3.7 ------	UNKNOWN
 60.0640 -72.9153    2.3  49.0  -48.1   5.6383   5.1 ------	UNKNOWN
 29.3350 -70.9451    3.2  44.8  -59.9   4.1628   3.6 ------	UNKNOWN
Pre-slew background subtracted image of 15-350 keV band
Time interval of the image:
-22.840000 15.884600

# RAcent  DECcent POSerr Theta    Phi  PeakCts   SNR AngSep     Name
#  [deg]    [deg]    ['] [deg]  [deg]                   [']
170.4619 -60.6758    8.3  50.0    3.2   0.2385   1.4    5.3	Cen X-3
186.6552 -62.7708   61.3  42.8    7.7   0.0235   0.2    0.0	GX 301-2
255.9938 -37.8527  201.6  22.6   98.7  -0.0059  -0.1    0.6	4U 1700-377
256.4351 -36.4239   38.9  23.6  101.3   0.0307   0.3    0.1	GX 349+2
262.8435 -24.7948    5.2  32.5  121.5  -0.3225  -2.2    9.5	GX 1+4
264.9811 -44.4096    3.6  13.5  106.9  -0.2658  -3.2   10.5	4U 1735-44
270.1545 -25.1675    3.8  30.9  133.7   0.3719   3.0    8.8	GX 5-1
270.2801 -25.5591    0.0  30.5  133.9  -0.2480  -2.0   11.1	GRS 1758-258
274.1547 -14.0722    8.6  41.6  141.6   0.2781   1.3    8.9	GX 17+2
275.8653 -30.2044    5.1  25.5  143.7   0.2194   2.3   10.2	H1820-303
284.9841 -24.8000   37.6  31.4  159.9  -0.0319  -0.3    7.8	HT1900.1-2455
262.7779 -33.8635    8.1  23.8  115.7   0.1398   1.4   10.7	GX 354-0
233.0933 -30.2884    1.9  39.7   76.6   1.9005   6.0 ------	UNKNOWN
289.3678 -15.0878    0.4  41.7  163.9   4.0754  27.2 ------	UNKNOWN
314.9997 -50.8321    2.8  23.1 -120.5   0.3678   4.1 ------	UNKNOWN
319.1089 -13.4402    2.5  53.3 -159.8   1.0543   4.6 ------	UNKNOWN
Post-slew image of 15-350 keV band
Time interval of the image:
87.084590 962.831000

# RAcent  DECcent POSerr Theta    Phi  PeakCts   SNR AngSep     Name
#  [deg]    [deg]    ['] [deg]  [deg]                   [']
256.0008 -37.8519    2.2  37.2   58.4   7.6824   5.3    0.8	4U 1700-377
256.4330 -36.3229    5.3  36.2   60.4   3.2812   2.2    6.0	GX 349+2
263.0202 -24.8564    6.7  26.6   76.8   1.4153   1.7    6.7	GX 1+4
264.7205 -44.5187    5.9  36.1   42.8  -2.1901  -2.0    4.2	4U 1735-44
268.2106  -1.3403    0.0  25.0  133.9   0.7411   1.0   11.6	SW J1753.5-0127
270.3131 -25.0561    2.1  20.4   70.4   4.2024   5.6    2.1	GX 5-1
270.3642 -25.7431    3.4  20.7   68.6   2.4716   3.4    3.3	GRS 1758-258
274.0122 -13.9778    2.4  14.9  104.9   2.8332   4.8    3.5	GX 17+2
276.0382 -30.4226    4.2  19.6   48.8   1.6549   2.8    6.7	H1820-303
284.9790 -24.7784    4.9  10.5   34.9   1.6146   2.4    9.1	HT1900.1-2455
288.7988  10.9434    1.1  26.1 -168.8   7.0163  10.9    0.1	GRS 1915+105
299.5945  35.1887    0.9  51.2 -156.8  25.8510  13.2    0.8	Cyg X-1
262.8579 -33.9122   10.6  30.4   59.5   1.1301   1.1    8.0	GX 354-0
265.6515 -27.7351    1.0  25.4   68.7   9.4221  11.7 ------	UNKNOWN
277.3451 -23.8020    1.8  14.3   63.1   3.9439   6.5 ------	UNKNOWN
282.1905 -32.3210    2.2  18.4   32.0   3.1714   5.2 ------	UNKNOWN
279.9270   1.2949    2.9  18.9  162.0   2.3874   4.0 ------	UNKNOWN
289.3712 -15.0994    0.4   0.0  170.6  15.7951  25.8 ------	UNKNOWN
302.7586 -19.3199    2.4  13.4  -57.4   2.7460   4.7 ------	UNKNOWN
326.0010 -24.2911    3.9  35.6  -56.8   3.1924   3.0 ------	UNKNOWN
301.6130  41.6594    3.9  57.9 -156.8  14.5217   2.9 ------	UNKNOWN
	UNKNOWN
	UNKNOWN