Analysis Summary
Notes:
- 1) No attempt has been made to eliminate the non-significant decimal places.
- 2) This batgrbproduct analysis is done using the HEASARC data.
- 3) This batgrbproduct analysis is using the flight position for the mask-weighting calculation.
======================================================================
                  BAT GRB EVENT DATA PROCESSING REPORT
    Process Script Ver: batgrbproduct v2.46
    Process Start Time: Sat Oct  4 22:50:30 EDT 2014
             Host Name: batevent1
   Current Working Dir: /local/data/batevent/batevent_reproc/trigger599188
======================================================================

  Trigger: 00599188      Segment: 000

  BAT Trigger Time: 421965066.816   [s; MET]
      Trigger Stop: 421965066.944   [s; MET]
               UTC: 2014-05-16T20:30:54.797080    [includes UTCF correction]
       Where From?: TDRSS position message

  BAT
    RA: 252.98837333485   Dec: 39.9147098873568  [deg; J2000]

     Catalogged Source?: NO
     Point Source?:      YES
     GRB Indicated?:     YES    [ by BAT flight software ]
     Image S/N Ratio:    6.73
     Image Trigger?:     NO
     Rate S/N Ratio:     13.4164078649987  [ if not an image trigger ]
     Image S/N Ratio:    6.73

  Analysis Position:   [ source = BAT ]
    RA: 252.98837333485   Dec: 39.9147098873568  [deg; J2000]

  Refined Position:   [ source = BAT pre-slew burst ]
    RA: 252.975583345581   Dec: 39.960990449251  [deg; J2000]
        { 16h 51m 54.1s , +39d 57' 39.6" }
         +/- 2.57672214886108 [arcmin] (estimated 90% radius based on SNR)
         +/- 1.07774219289018 [arcmin] (formal 1-sigma fit error)
    SNR: 7.86826475610618

  Angular difference between the analysis and refined position is 2.838488 arcmin

  Partial Coding Fraction: 0.75    [ including projection effects ]

  Duration
     T90: 0.25600004196167 +/- 0.143108320705261
        Measured from: -0.0239999890327454
                   to: 0.232000052928925     [s; relative to TRIGTIME]
     T50: 0.0640000104904175 +/- 0.0905096828275688
        Measured from: 0.0400000214576721
                   to: 0.10400003194809     [s; relative to TRIGTIME]


  Fluence
     Peak Flux  (peak 1 second)
        Measured from: -0.331999957561493
                   to: 0.668000042438507     [s; relative to TRIGTIME]
     Total Fluence
        Measured from: -0.0239999890327454
                   to: 0.296000003814697     [s; relative to TRIGTIME]

             Band 1     Band 2     Band 3     Band 4
              15-25      25-50     50-100    100-350     keV
 Total     0.019503   0.024949   0.013815  -0.000407
           0.003840   0.004104   0.003534   0.002617 [error]
 Peak      0.014998   0.029519   0.011911  -0.006895
           0.006155   0.006406   0.005659   0.004406 [error]

     [ fluence units of on-axis counts / fully illuminated detector ]

======================================================================


====== Table of the duration information =============================

        Value   tstart    tstop
T100    0.320   -0.024    0.296
T90     0.256   -0.024    0.232
T50     0.064    0.040    0.104
Peak    1.000   -0.332    0.668


====== Spectral Analysis Summary =====================================

Model      : spectral model: simple power-law (PL) and cutoff power-law (CPL)
Ph_index   : photon index: E^{Ph_index}
Ph_90err   : 90% error of the photon index
Epeak      : Epeak in keV
Epeak_90err: 90% error of Epeak
Norm       : normalization at 50 keV in both the PL model and CPL model
Nomr_90err : 90% error of the normalization
chi2       : Chi-Squared
dof        : degree of freedo

=== Time-averaged spectral analysis ===
(Best model with acceptable fit: PL)

Model Ph_index Ph_90err_low Ph_90err_hi  Epeak  Epeak_90err_low  Epeak_90err_hi  Norm       Nomr_90err_low    Norm_90err_hi    chi2    dof
PL      -1.891    -0.341      0.307       -           -               -         1.02e-02     -2.47e-03          2.41e-03      66.510   57
CPL      0.489    -1.680      2.746       44.568      -8.920        16.054      2.31e-01     -2.31e-01          9.10e+00      59.780   56


=== 1-s peak spectral analysis ===
(Best model with acceptable fit: PL)

Model Ph_index Ph_90err_low Ph_90err_hi  Epeak  Epeak_90err_low  Epeak_90err_hi  Norm       Nomr_90err_low    Norm_90err_hi    chi2    dof
PL      -1.815     -0.562     0.483       -           -               -         3.61e-03     -1.32e-03          1.26e-03      67.410   57
CPL      0.260      N/A       N/A          48.054      N/A           N/A         4.99e-02        N/A               N/A         65.420   56


=== Fluence/Peak Flux Summary ===

              Model    Band1     Band2     Band3     Band4     Band5     Total
                       15-25     25-50    50-100    100-350    15-150    15-350    keV
Fluence         PL   6.05e-09  8.76e-09  9.45e-09  1.90e-08  3.01e-08  4.33e-08   erg/cm2
      90%_error_low -1.55e-09 -1.76e-09 -2.90e-09 -9.27e-09 -7.02e-09 -1.33e-08   erg/cm2
      90%_error_hi   1.61e-09  1.75e-09  2.99e-09  1.33e-08  7.23e-09  1.64e-08   erg/cm2
Peak flux       PL   2.01e-01  1.68e-01  9.56e-02  8.06e-02  5.01e-01  5.46e-01   ph/cm2/s
      90%_error_low -7.98e-02 -5.02e-02 -4.29e-02 -5.25e-02 -1.49e-01 -1.66e-01   ph/cm2/s
      90%_error_hi   8.63e-02  5.02e-02  4.40e-02  8.74e-02  1.49e-01  1.69e-01   ph/cm2/s

Fluence        CPL   4.88e-09  1.16e-08  9.04e-09  1.44e-09  2.68e-08  2.70e-08   erg/cm2
      90%_error_low -1.84e-09 -2.63e-09 -4.08e-09 -1.34e-09 -6.29e-09 -6.43e-09   erg/cm2
      90%_error_hi   1.86e-09  2.86e-09  3.92e-09  6.44e-09  7.15e-09  8.73e-09   erg/cm2
Peak flux      CPL   1.54e-01  2.10e-01  1.00e-01  1.19e-02  4.74e-01  4.76e-01   ph/cm2/s
      90%_error_low -1.54e-01 -7.05e-02 -5.39e-02 -1.19e-02 -1.56e-01 -1.57e-01   ph/cm2/s
      90%_error_hi   1.05e-01  7.73e-02  5.46e-02  9.57e-02  1.53e-01  1.62e-01   ph/cm2/s

======================================================================
Image
Pre-slew 15.0-350.0 keV image (Event data)
#   RAcent    DECcent   POSerr    Theta     Phi              Peak Cts       SNR   Name
  252.9756    39.9610   0.0244    22.6469    40.6295         0.0572317      7.868 TRIG_00599188

Foreground time interval of the image:
 -0.024   0.296 (delta_t =   0.320 [sec])
Background time interval of the image:
-315.915 -300.722 (delta_t =  15.193 [sec])
-239.816  -0.024 (delta_t = 239.792 [sec])
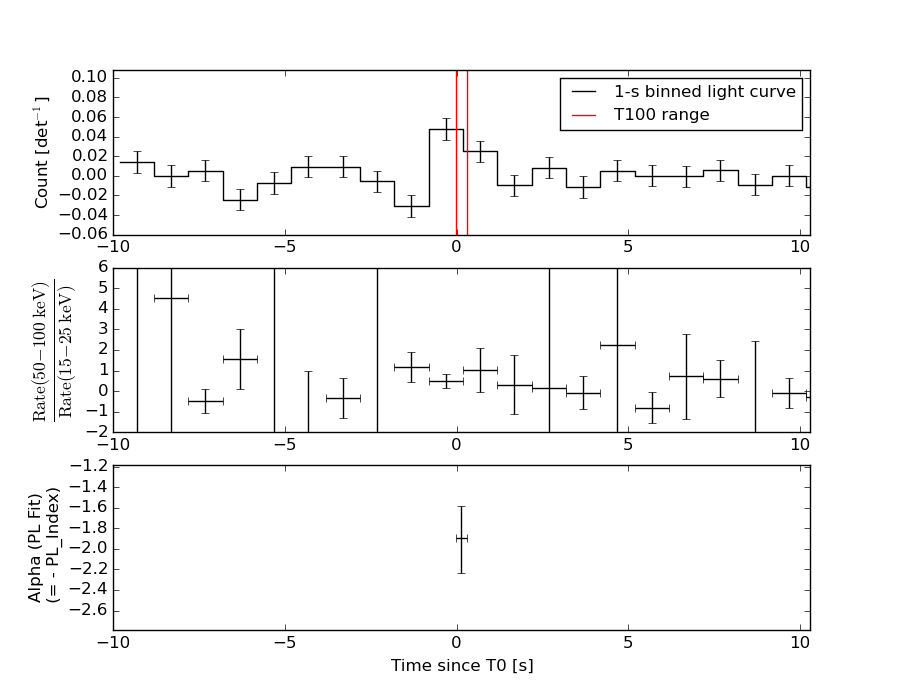
Light Curves
Note: The mask-weighted lightcurves have units of either count/det or counts/sec/det, where a det is 0.4 x 0.4 = 0.16 sq cm.
Full-time range; 1 s binning
Other quick-look light curves:
- 64 ms binning (zoomed)
- 16 ms binning (zoomed)
- 8 ms binning (zoomed)
- 2 ms binning (zoomed)
- SN=5 or 10 s binning (full-time range)
- Raw light curve
Spectra
- 64 ms binning (zoomed)
- 16 ms binning (zoomed)
- 8 ms binning (zoomed)
- 2 ms binning (zoomed)
- SN=5 or 10 s binning (full-time range)
- Raw light curve
Spectra
Notes:
- 1) The fitting includes the systematic errors.
- 2) When the burst includes telescope slew time periods, the fitting uses an average response file made from multiple 5-s response files through out the slew time plus single time preiod for the non-slew times, and weighted by the total counts in the corresponding time period using addrmf. An average response file is needed becuase a spectral fit using the pre-slew DRM will introduce some errors in both a spectral shape and a normalization if the PHA file contains a lot of the slew/post-slew time interval.
- 3) For fits to more complicated models (e.g. a power-law over a cutoff power-law), the BAT team has decided to require a chi-square improvement of more than 6 for each extra dof.
Time averaged spectrum fit using the average DRM
Power-law model
Time interval is from   -0.024 sec. to    0.296 sec.

Spectral model in power-law:
------------------------------------------------------------
Parameters  : value       lower 90%   higher 90%
Photon index: -1.89057     ( -0.340045   0.30734 )
Norm@50keV  : 1.02394E-02    ( -0.00247323   0.00241023 )
------------------------------------------------------------
#Fit statistic : Chi-Squared =          66.51 using 59 PHA bins.
# Reduced chi-squared =          1.167 for     57 degrees of freedom
# Null hypothesis probability =   1.822481e-01

Photon flux (15-150 keV)    in 0.32 sec: 1.46372 ( -0.2918  0.2918 ) ph/cm2/s
Energy fluence (15-150 keV)             : 3.01217e-08 ( -7.02131e-09  7.23251e-09 ) ergs/cm2
Cutoff power-law model
Time interval is from   -0.024 sec. to    0.296 sec.
Spectral model in the cutoff power-law:
------------------------------------------------------------
Parameters  : value       lower 90%   higher 90%
Photon index: 0.488963     ( -1.68099   2.74508 )
Epeak [keV] : 44.5679      ( -8.91917 16.0558 )
Norm@50keV  : 0.230707    ( -0.231081   9.09999 )
------------------------------------------------------------
#Fit statistic : Chi-Squared =          59.78 using 59 PHA bins.
# Reduced chi-squared =          1.068 for     56 degrees of freedom
# Null hypothesis probability =   3.400246e-01

Photon flux (15-150 keV)    in 0.32 sec: 1.41223 ( -0.28997  0.29155 ) ph/cm2/s
Energy fluence (15-150 keV)             : 2.6809e-08 ( -6.2945e-09  7.152e-09 ) ergs/cm2
1-s peak spectrum fit
Power-law model
Time interval is from   -0.332 sec. to    0.668 sec.

Spectral model in power-law:
------------------------------------------------------------
Parameters  : value       lower 90%   higher 90%
Photon index: -1.81491     ( -0.561778   0.482947 )
Norm@50keV  : 3.61151E-03    ( -0.00132002   0.00125856 )
------------------------------------------------------------
#Fit statistic : Chi-Squared =          67.41 using 59 PHA bins.
# Reduced chi-squared =          1.183 for     57 degrees of freedom
# Null hypothesis probability =   1.627446e-01

Photon flux (15-150 keV)    in 1 sec: 0.500589 ( -0.149475  0.14948 ) ph/cm2/s
Energy fluence (15-150 keV)             : 3.32392e-08 ( -1.1696e-08  1.23183e-08 ) ergs/cm2
Cutoff power-law model
Time interval is from   -0.332 sec. to    0.668 sec.
Spectral model in the cutoff power-law:
------------------------------------------------------------
Parameters  : value       lower 90%   higher 90%
Photon index: 0.259868     (       )
Epeak [keV] : 48.0544      (   )
Norm@50keV  : 4.98508E-02    (     )
------------------------------------------------------------
#Fit statistic : Chi-Squared =          65.42 using 59 PHA bins.
# Reduced chi-squared =          1.168 for     56 degrees of freedom
# Null hypothesis probability =   1.822262e-01

Photon flux (15-150 keV)    in 1 sec: 0.474376 ( -0.155996  0.153354 ) ph/cm2/s
Energy fluence (15-150 keV)             : 2.94517e-08 ( -1.02071e-08  1.26549e-08 ) ergs/cm2
Time-resolved spectra
Distribution
T90 vs. Hardness ratio plot
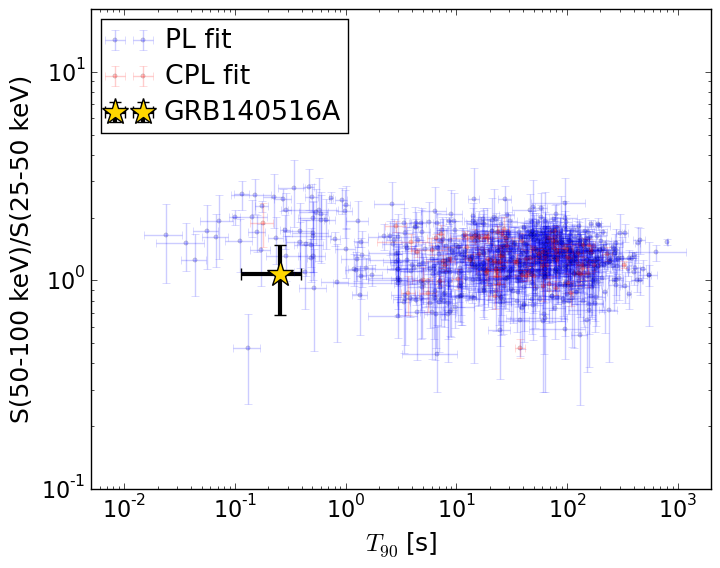
T90                                   = 0.256 sec.
Hardness ratio (energy fluence ratio) = 1.0785494289
S(15-50 keV) vs. S(50-150 keV) plot
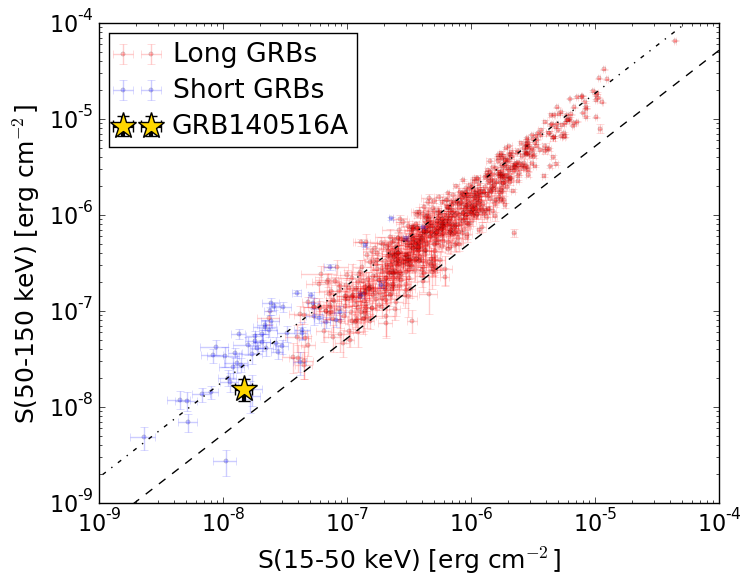
S(15-50 keV)  = 1.4806967e-08
S(50-150 keV) = 1.5315843e-08
The dash-dotted line and the dashed line traces the fluences calculated from the Band function with Epeak = 15 and 150 keV, respectively. Both lines assume a canonical values of alpha = -1 and beta = -2.5.
Mask shadow pattern
IMX = 3.166435238837305E-01, IMY = -2.716794441283923E-01
Spacecraft aspect plot
Bright source in the pre-burst/pre-slew/post-slew images
Pre-burst image of 15-350 keV band
Time interval of the image:
-315.915400 -300.722100
-239.816000 -0.024000

# RAcent  DECcent POSerr Theta    Phi  PeakCts   SNR AngSep     Name
#  [deg]    [deg]    ['] [deg]  [deg]                   [']
254.4156  35.4933   13.0  27.0   44.3   0.2238   0.9    9.3	Her X-1
299.5405  35.1397   11.0  51.0   -2.2  -0.4768  -1.0    4.4	Cyg X-1
308.1004  40.7658   11.7  51.5  -13.5   0.4930   1.0   11.2	Cyg X-3
187.3352  18.4573    3.0  49.0  151.4   3.1659   3.9 ------	UNKNOWN
157.9231  25.8009    2.6  58.4 -175.4   5.6920   4.4 ------	UNKNOWN
193.1117  76.1255    2.0  23.7 -105.8   1.2960   5.7 ------	UNKNOWN
323.9738  43.3958    3.6  57.6  -26.3   3.9030   3.2 ------	UNKNOWN
Pre-slew background subtracted image of 15-350 keV band
Time interval of the image:
-0.024000 0.296000

# RAcent  DECcent POSerr Theta    Phi  PeakCts   SNR AngSep     Name
#  [deg]    [deg]    ['] [deg]  [deg]                   [']
254.5399  35.2814    5.4  27.2   44.3   0.0183   2.1    5.4	Her X-1
299.6265  35.1397    4.1  51.0   -2.3  -0.0442  -2.8    4.1	Cyg X-1
307.9342  41.0150   26.2  51.2  -13.6  -0.0064  -0.4    8.8	Cyg X-3
201.3914  32.4282    2.4  30.5  145.0   0.0407   4.8 ------	UNKNOWN
252.9753  39.9625    1.5  22.6   40.6   0.0566   7.8 ------	UNKNOWN
291.9644  51.6983    2.1  36.0  -15.4   0.0431   5.6 ------	UNKNOWN
128.6122  63.4394    2.0  45.6 -123.3   0.1498   5.8 ------	UNKNOWN
Post-slew image of 15-350 keV band
Time interval of the image:
63.084600 962.277200

# RAcent  DECcent POSerr Theta    Phi  PeakCts   SNR AngSep     Name
#  [deg]    [deg]    ['] [deg]  [deg]                   [']
254.4557  35.3442   33.3   4.7   54.7   0.1897   0.3    0.1	Her X-1
268.4179  -1.6061    0.0  43.9   46.8   0.4092   0.2    9.7	SW J1753.5-0127
288.8032  10.9367    1.3  42.9   11.8   8.2479   9.0    0.6	GRS 1915+105
299.5882  35.1957    0.3  36.8  -28.5  29.9685  38.0    0.4	Cyg X-1
308.0853  40.9685    2.5  41.2  -40.7   4.7256   4.5    1.5	Cyg X-3
296.4533   0.6373    3.4  55.7   12.9  13.0637   3.4 ------	UNKNOWN
274.2783  12.7944    2.5  33.0   28.7   3.4745   4.5 ------	UNKNOWN
290.0202  23.7545    4.6  35.0   -4.5   1.7898   2.5 ------	UNKNOWN
251.6327  53.5484    2.3  13.7 -114.1   2.8699   5.1 ------	UNKNOWN
163.3687  62.2552    9.7  55.2 -145.2   5.5924   1.2 ------	UNKNOWN