Analysis Summary
Notes:
- 1) No attempt has been made to eliminate the non-significant decimal places.
- 2) This batgrbproduct analysis is done using the HEASARC data.
- 3) This batgrbproduct analysis is using the flight position for the mask-weighting calculation.
======================================================================
BAT GRB EVENT DATA PROCESSING REPORT
Process Script Ver: batgrbproduct v2.46
Process Start Time: Sat Oct 4 22:45:12 EDT 2014
Host Name: batevent1
Current Working Dir: /local/data/batevent/batevent_reproc/trigger599287
======================================================================
Trigger: 00599287 Segment: 000
BAT Trigger Time: 422097478.656 [s; MET]
Trigger Stop: 422097479.68 [s; MET]
UTC: 2014-05-18T09:17:46.630720 [includes UTCF correction]
Where From?: TDRSS position message
BAT
RA: 227.269331468707 Dec: 42.4156655750532 [deg; J2000]
Catalogged Source?: NO
Point Source?: YES
GRB Indicated?: YES [ by BAT flight software ]
Image S/N Ratio: 8.66
Image Trigger?: NO
Rate S/N Ratio: 13.7477270848675 [ if not an image trigger ]
Image S/N Ratio: 8.66
Analysis Position: [ source = BAT ]
RA: 227.269331468707 Dec: 42.4156655750532 [deg; J2000]
Refined Position: [ source = BAT pre-slew burst ]
RA: 227.221166823231 Dec: 42.3998493646802 [deg; J2000]
{ 15h 08m 53.1s , +42d 23' 59.5" }
+/- 1.72249157659234 [arcmin] (estimated 90% radius based on SNR)
+/- 0.824997164495074 [arcmin] (formal 1-sigma fit error)
SNR: 13.987853804574
Angular difference between the analysis and refined position is 2.335289 arcmin
Partial Coding Fraction: 0.890625 [ including projection effects ]
Duration
T90: 60.5239999294281 +/- 2.48237949745235
Measured from: -2.64800000190735
to: 57.8759999275208 [s; relative to TRIGTIME]
T50: 48.4039999246597 +/- 3.51867079527506
Measured from: 3.7960000038147
to: 52.1999999284744 [s; relative to TRIGTIME]
Fluence
Peak Flux (peak 1 second)
Measured from: 41.944000005722
to: 42.944000005722 [s; relative to TRIGTIME]
Total Fluence
Measured from: -3.98000001907349
to: 60.039999961853 [s; relative to TRIGTIME]
Band 1 Band 2 Band 3 Band 4
15-25 25-50 50-100 100-350 keV
Total 0.763584 0.884923 0.457812 0.007289
0.044780 0.046801 0.041729 0.038926 [error]
Peak 0.036478 0.054534 0.028957 0.005231
0.005941 0.006190 0.005503 0.004835 [error]
[ fluence units of on-axis counts / fully illuminated detector ]
======================================================================
====== Table of the duration information =============================
Value tstart tstop
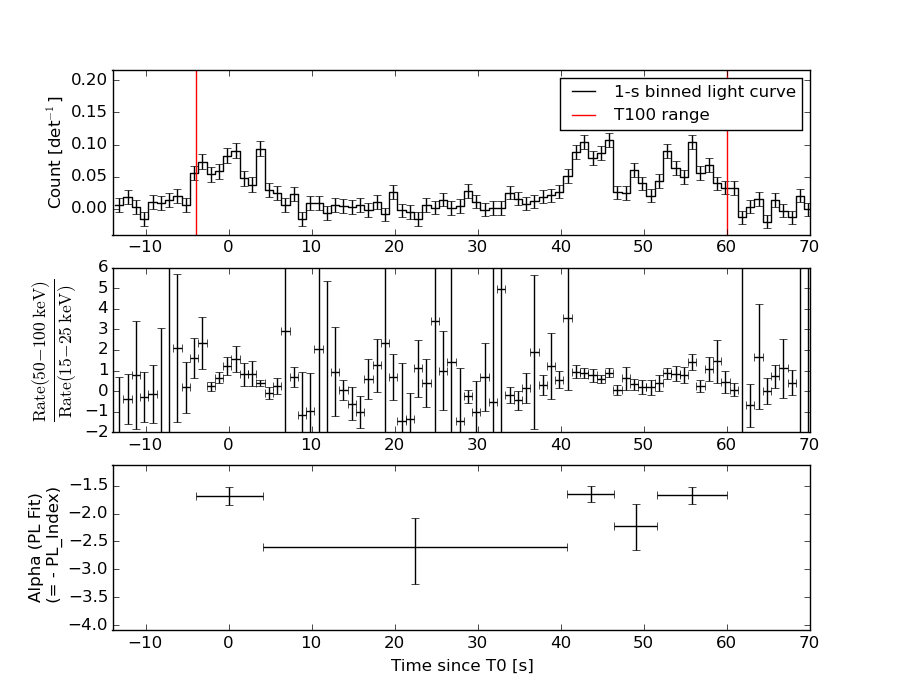
T100 64.020 -3.980 60.040
T90 60.524 -2.648 57.876
T50 48.404 3.796 52.200
Peak 1.000 41.944 42.944
====== Spectral Analysis Summary =====================================
Model : spectral model: simple power-law (PL) and cutoff power-law (CPL)
Ph_index : photon index: E^{Ph_index}
Ph_90err : 90% error of the photon index
Epeak : Epeak in keV
Epeak_90err: 90% error of Epeak
Norm : normalization at 50 keV in both the PL model and CPL model
Nomr_90err : 90% error of the normalization
chi2 : Chi-Squared
dof : degree of freedo
=== Time-averaged spectral analysis ===
(Best model with acceptable fit: CPL)
Model Ph_index Ph_90err_low Ph_90err_hi Epeak Epeak_90err_low Epeak_90err_hi Norm Nomr_90err_low Norm_90err_hi chi2 dof
PL -1.892 -0.123 0.120 - - - 1.99e-03 -1.55e-04 1.53e-04 61.540 57
CPL -0.977 -0.534 0.611 47.922 -7.115 12.667 6.48e-03 -3.18e-03 7.73e-03 52.190 56
=== 1-s peak spectral analysis ===
(Best model with acceptable fit: PL)
Model Ph_index Ph_90err_low Ph_90err_hi Epeak Epeak_90err_low Epeak_90err_hi Norm Nomr_90err_low Norm_90err_hi chi2 dof
PL -1.591 -0.233 0.226 - - - 7.55e-03 -1.18e-03 1.16e-03 56.200 57
CPL 0.253 -1.187 1.614 52.687 -9.532 22.807 8.20e-02 -8.20e-02 5.79e-01 48.120 56
=== Fluence/Peak Flux Summary ===
Model Band1 Band2 Band3 Band4 Band5 Total
15-25 25-50 50-100 100-350 15-150 15-350 keV
Fluence PL 2.35e-07 3.40e-07 3.67e-07 7.36e-07 1.17e-06 1.68e-06 erg/cm2
90%_error_low -2.23e-08 -2.18e-08 -3.90e-08 -1.47e-07 -8.94e-08 -1.89e-07 erg/cm2
90%_error_hi 2.28e-08 2.18e-08 3.95e-08 1.70e-07 9.07e-08 2.07e-07 erg/cm2
Peak flux PL 3.39e-01 3.23e-01 2.15e-01 2.22e-01 9.67e-01 1.10e+00 ph/cm2/s
90%_error_low -6.91e-02 -4.60e-02 -4.21e-02 -7.37e-02 -1.36e-01 -1.61e-01 ph/cm2/s
90%_error_hi 7.20e-02 4.60e-02 4.25e-02 9.36e-02 1.36e-01 1.63e-01 ph/cm2/s
Fluence CPL 2.13e-07 3.74e-07 3.54e-07 1.88e-07 1.06e-06 1.13e-06 erg/cm2
90%_error_low -2.61e-08 -2.92e-08 -4.67e-08 -9.58e-08 -9.96e-08 -1.40e-07 erg/cm2
90%_error_hi 2.62e-08 2.98e-08 4.53e-08 2.00e-07 1.05e-07 2.23e-07 erg/cm2
Peak flux CPL 2.77e-01 3.95e-01 2.14e-01 3.34e-02 9.14e-01 9.19e-01 ph/cm2/s
90%_error_low -8.24e-02 -6.48e-02 -5.68e-02 -3.34e-02 -1.38e-01 -1.41e-01 ph/cm2/s
90%_error_hi 8.38e-02 6.83e-02 5.34e-02 7.05e-02 1.39e-01 1.47e-01 ph/cm2/s
======================================================================
Image
Pre-slew 15.0-350.0 keV image (Event data)
#   RAcent    DECcent   POSerr    Theta     Phi              Peak Cts       SNR   Name
  227.2212    42.3998   0.0137    20.2239   -44.0843         0.6854120     13.988 TRIG_00599287

Foreground time interval of the image:
 -3.980  15.845 (delta_t =  19.825 [sec])
Background time interval of the image:
-347.555 -328.358 (delta_t =  19.197 [sec])
-239.656  -3.980 (delta_t = 235.676 [sec])
Light Curves
Note: The mask-weighted lightcurves have units of either count/det or counts/sec/det, where a det is 0.4 x 0.4 = 0.16 sq cm.
Full-time range; 1 s binning
Other quick-look light curves:
Spectra
Notes:
- 1) The fitting includes the systematic errors.
- 2) When the burst includes telescope slew time periods, the fitting uses an average response file made from multiple 5-s response files through out the slew time plus single time preiod for the non-slew times, and weighted by the total counts in the corresponding time period using addrmf. An average response file is needed becuase a spectral fit using the pre-slew DRM will introduce some errors in both a spectral shape and a normalization if the PHA file contains a lot of the slew/post-slew time interval.
- 3) For fits to more complicated models (e.g. a power-law over a cutoff power-law), the BAT team has decided to require a chi-square improvement of more than 6 for each extra dof.
Time averaged spectrum fit using the average DRM
Power-law model
Time interval is from   -3.980 sec. to   60.040 sec.

Spectral model in power-law:
------------------------------------------------------------
Parameters  : value       lower 90%   higher 90%
Photon index: -1.89241     ( -0.123189   0.11978 )
Norm@50keV  : 1.98641E-03    ( -0.000154752   0.000152903 )
------------------------------------------------------------
#Fit statistic : Chi-Squared =          61.54 using 59 PHA bins.
# Reduced chi-squared =          1.080 for     57 degrees of freedom
# Null hypothesis probability =   3.168509e-01

Photon flux (15-150 keV)    in 64.02 sec: 0.284174 ( -0.018357  0.018366 ) ph/cm2/s
Energy fluence (15-150 keV)             : 1.1693e-06 ( -8.93694e-08  9.07151e-08 ) ergs/cm2
Cutoff power-law model
Time interval is from   -3.980 sec. to   60.040 sec.
Spectral model in the cutoff power-law:
------------------------------------------------------------
Parameters  : value       lower 90%   higher 90%
Photon index: -0.976957     ( -0.533886   0.610629 )
Epeak [keV] : 47.9220      ( -7.11486 12.6666 )
Norm@50keV  : 6.47742E-03    ( -0.00318066   0.00772819 )
------------------------------------------------------------
#Fit statistic : Chi-Squared =          52.19 using 59 PHA bins.
# Reduced chi-squared =         0.9320 for     56 degrees of freedom
# Null hypothesis probability =   6.196861e-01

Photon flux (15-150 keV)    in 64.02 sec: 0.271789 ( -0.019498  0.019537 ) ph/cm2/s
Energy fluence (15-150 keV)             : 1.06394e-06 ( -9.95613e-08  1.04556e-07 ) ergs/cm2
1-s peak spectrum fit
Power-law model
Time interval is from   41.944 sec. to   42.944 sec.

Spectral model in power-law:
------------------------------------------------------------
Parameters  : value       lower 90%   higher 90%
Photon index: -1.59072     ( -0.233043   0.226079 )
Norm@50keV  : 7.54577E-03    ( -0.00117998   0.00116423 )
------------------------------------------------------------
#Fit statistic : Chi-Squared =          56.20 using 59 PHA bins.
# Reduced chi-squared =         0.9860 for     57 degrees of freedom
# Null hypothesis probability =   5.048981e-01

Photon flux (15-150 keV)    in 1 sec: 0.966930 ( -0.136394  0.13641 ) ph/cm2/s
Energy fluence (15-150 keV)             : 7.06627e-08 ( -1.17865e-08  1.2082e-08 ) ergs/cm2
Cutoff power-law model
Time interval is from   41.944 sec. to   42.944 sec.
Spectral model in the cutoff power-law:
------------------------------------------------------------
Parameters  : value       lower 90%   higher 90%
Photon index: 0.252708     ( -1.18739   1.61398 )
Epeak [keV] : 52.6871      ( -9.53155 22.8073 )
Norm@50keV  : 8.19976E-02    ( -0.0819987   0.57938 )
------------------------------------------------------------
#Fit statistic : Chi-Squared =          48.12 using 59 PHA bins.
# Reduced chi-squared =         0.8593 for     56 degrees of freedom
# Null hypothesis probability =   7.639405e-01

Photon flux (15-150 keV)    in 1 sec: 0.914342 ( -0.137996  0.138968 ) ph/cm2/s
Energy fluence (15-150 keV)             : 5.9826e-08 ( -1.13206e-08  1.29352e-08 ) ergs/cm2
Time-resolved spectra
Distribution
T90 vs. Hardness ratio plot
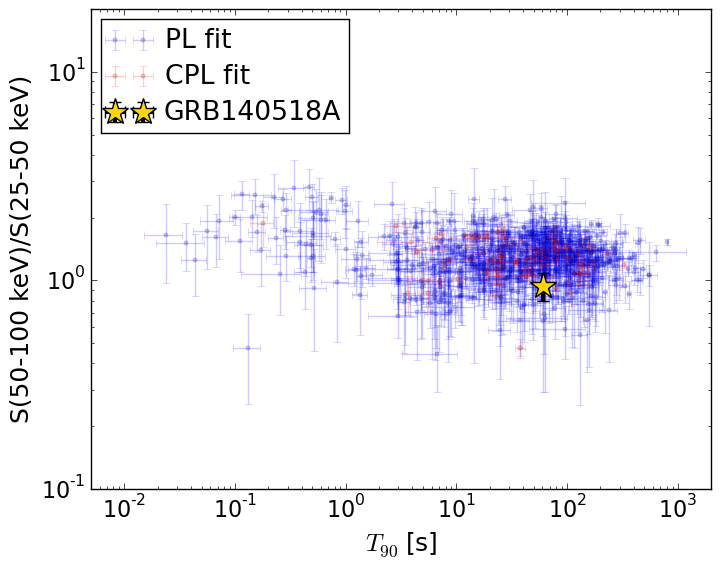
T90                                   = 60.524 sec.
Hardness ratio (energy fluence ratio) = 0.944691585381
S(15-50 keV) vs. S(50-150 keV) plot
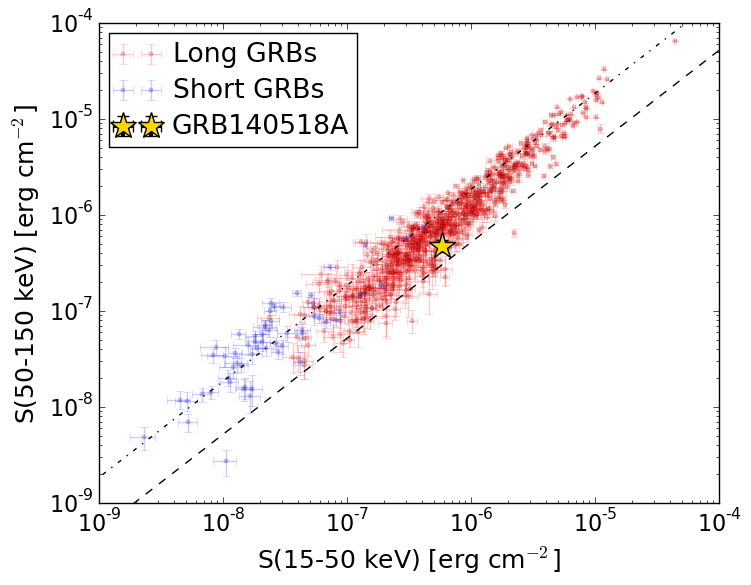
S(15-50 keV)  = 5.869978e-07
S(50-150 keV) = 4.76948e-07
The dash-dotted line and the dashed line traces the fluences calculated from the Band function with Epeak = 15 and 150 keV, respectively. Both lines assume a canonical values of alpha = -1 and beta = -2.5.
Mask shadow pattern
IMX = 2.646293617018872E-01, IMY = 2.563029369990332E-01
Spacecraft aspect plot
Bright source in the pre-burst/pre-slew/post-slew images
Pre-burst image of 15-350 keV band
Time interval of the image:
-347.555400 -328.357900
-239.656000 -3.980000

# RAcent  DECcent POSerr Theta    Phi  PeakCts   SNR AngSep     Name
#  [deg]    [deg]    ['] [deg]  [deg]                   [']
254.3948  35.2239 1020.3  35.7   -8.2  -0.0030  -0.0    7.7	Her X-1
231.1928 -10.9385    2.5  39.5   81.6   4.4701   4.6 ------	UNKNOWN
254.4651   3.2678    2.7  44.2   40.9   2.7306   4.2 ------	UNKNOWN
158.4590   2.6858    4.2  58.3 -175.3   3.5521   2.7 ------	UNKNOWN
169.3986  13.2584    2.8  44.0 -169.1   1.3999   4.2 ------	UNKNOWN
154.3536   9.4331    2.6  59.1 -166.2   6.0358   4.5 ------	UNKNOWN
236.9796  67.7238    3.6  44.8  -60.3   2.7937   3.2 ------	UNKNOWN
Pre-slew background subtracted image of 15-350 keV band
Time interval of the image:
-3.980000 15.844600

# RAcent  DECcent POSerr Theta    Phi  PeakCts   SNR AngSep     Name
#  [deg]    [deg]    ['] [deg]  [deg]                   [']
254.2741  35.3349   14.2  35.6   -8.4  -0.0494  -0.8    9.0	Her X-1
227.2211  42.3999    0.8  20.2  -44.1   0.6854  14.0 ------	UNKNOWN
273.4739  39.6407    2.0  50.9  -14.0   0.6817   5.6 ------	UNKNOWN
Post-slew image of 15-350 keV band
Time interval of the image:
57.244600 962.395800

# RAcent  DECcent POSerr Theta    Phi  PeakCts   SNR AngSep     Name
#  [deg]    [deg]    ['] [deg]  [deg]                   [']
254.3852  35.2431    7.9  22.2   18.3  -0.7762  -1.5    6.9	Her X-1
299.5846  35.1971    0.7  55.1   -9.8  28.3686  17.6    0.4	Cyg X-1
308.1136  41.1622   31.3  57.8  -20.1   0.9926   0.4   12.6	Cyg X-3
277.9196  19.1774    3.0  48.4   21.0   5.9025   3.9 ------	UNKNOWN
230.7646  32.5387    2.8  10.2   81.7   2.0016   4.1 ------	UNKNOWN
241.7830  34.8364    3.0  13.6   37.5   1.7633   3.9 ------	UNKNOWN
215.1020  53.3666    2.0  13.6 -113.8   2.9333   5.7 ------	UNKNOWN
305.9701  69.7094    3.9  46.9  -53.8   8.0414   3.0 ------	UNKNOWN