Analysis Summary
Notes:
- 1) No attempt has been made to eliminate the non-significant decimal places.
- 2) This batgrbproduct analysis is done using the HEASARC data.
- 3) This batgrbproduct analysis is using the flight position for the mask-weighting calculation.
==========================================================================
           BAT GROUND-DETECTED GRB DATA PROCESSING REPORT
            (This burst occurred during telescope slew)
    Process Script Ver: batgrbproduct v2.46
    Process Start Time: Fri Nov  7 18:57:26 EST 2014
             Host Name: bat1
   Current Working Dir: /local/data/bat1/alien/Swift_3rdBATcatalog/event/batevent_reproc/GRB140529A
======================================================================

  Trigger: 00091901      Segment: 003

  BAT Trigger Time: 423048493.169
               UTC: 2014-05-29T09:28:01.098   [includes UTCF correction]
       Where From?: Ground analysis (best_duration.txt)
  NOTE: BAT trigger time for ground-detected burst during slew is the T100 start time.

  Refined Position:   [ source = BAT mosaic image ]
    RA: 228.805098433427   Dec: -41.0524965320466  [deg; J2000]
        { 15h 15m 13.2s , -41d -3' -9.0" }
        +/- 1.37551948707 [arcmin] (estimated 90% radius based on SNR)
    SNR: 19.2914805073


  Angular difference between the analysis and refined position is Usage: arcmin

  Partial Coding Fraction: Unavailable because the burst occurred during slew.

  Duration
     T90: 8.14400005340576 +/- 1.51087789797795
        Measured from: 0.32
                   to: 8.464     [s; relative to TRIGTIME]
     T50: 2.08000004291534 +/- 0.364856138331901
        Measured from: 0.896
                   to: 2.976     [s; relative to TRIGTIME]


====== Table of the duration information =============================

        Value   tstart    tstop
T100   13.088    0.000   13.088
T90     8.144    0.320    8.464
T50     2.080    0.896    2.976
Peak    1.000    0.516    1.516


====== Spectral Analysis Summary =====================================

Model      : spectral model: simple power-law (PL) and cutoff power-law (CPL)
Ph_index   : photon index: E^{Ph_index}
Ph_90err   : 90% error of the photon index
Epeak      : Epeak in keV
Epeak_90err: 90% error of Epeak
Norm       : normalization at 50 keV in both the PL model and CPL model
Nomr_90err : 90% error of the normalization
chi2       : Chi-Squared
dof        : degree of freedo

=== Time-averaged spectral analysis ===
(Best model with acceptable fit: PL)

Model Ph_index Ph_90err_low Ph_90err_hi  Epeak  Epeak_90err_low  Epeak_90err_hi  Norm       Nomr_90err_low    Norm_90err_hi    chi2    dof
PL      -1.861    -0.105      0.104       -           -               -         1.87e-02     -1.16e-03          1.15e-03      68.720   57
CPL     -1.308    -0.422      0.468       60.044     -10.975        40.294      3.62e-02     -1.40e-02          2.65e-02      63.560   56


=== 1-s peak spectral analysis ===
(Best model with acceptable fit: CPL)

Model Ph_index Ph_90err_low Ph_90err_hi  Epeak  Epeak_90err_low  Epeak_90err_hi  Norm       Nomr_90err_low    Norm_90err_hi    chi2    dof
PL      -1.538     -0.095     0.094       -           -               -         8.86e-02     -5.55e-03          5.55e-03      75.050   57
CPL     -0.283     -0.454     0.502       71.789      -7.909        13.009      3.65e-01     -1.43e-01          2.63e-01      49.310   56


=== Fluence/Peak Flux Summary ===

              Model    Band1     Band2     Band3     Band4     Band5     Total
                       15-25     25-50    50-100    100-350    15-150    15-350    keV
Fluence         PL   4.40e-07  6.50e-07  7.15e-07  1.48e-06  2.26e-06  3.29e-06   erg/cm2
      90%_error_low -4.09e-08 -3.79e-08 -5.92e-08 -2.41e-07 -1.39e-07 -2.97e-07   erg/cm2
      90%_error_hi   4.21e-08  3.78e-08  5.92e-08  2.70e-07  1.40e-07  3.18e-07   erg/cm2
Peak flux       PL   3.78e+00  3.72e+00  2.56e+00  2.78e+00  1.12e+01  1.28e+01   ph/cm2/s
      90%_error_low -3.81e-01 -2.50e-01 -1.89e-01 -3.78e-01 -7.19e-01 -7.97e-01   ph/cm2/s
      90%_error_hi   3.92e-01  2.49e-01  1.88e-01  4.09e-01  7.20e-01  7.98e-01   ph/cm2/s

Fluence        CPL   4.03e-07  6.85e-07  7.29e-07  6.87e-07  2.16e-06  2.50e-06   erg/cm2
      90%_error_low -4.92e-08 -4.65e-08 -6.41e-08 -2.85e-07 -1.55e-07 -3.28e-07   erg/cm2
      90%_error_hi   5.01e-08  4.74e-08  6.46e-08  5.28e-07  1.56e-07  5.40e-07   erg/cm2
Peak flux      CPL   2.96e+00  4.17e+00  2.95e+00  1.05e+00  1.08e+01  1.11e+01   ph/cm2/s
      90%_error_low -4.59e-01 -3.07e-01 -2.42e-01 -2.98e-01 -7.32e-01 -7.97e-01   ph/cm2/s
      90%_error_hi   4.72e-01  3.12e-01  2.47e-01  4.01e-01  7.33e-01  8.17e-01   ph/cm2/s

======================================================================
Image
Note1: The mosaic image is made with timebin = 0.10 s; energybin = 15-350 keV
Note2: The mosaic image uses Galactic coordinate.
#RAcent DECcent POSerr Theta  Phi  Peak_Cts  SNR Name
228.805 -41.052 0.003 29.447 -153.237 0.182 19.291 UNKNOWN

Image time interval: 0.000 to 13.088 [sec]
Light Curves
Note: The mask-weighted lightcurves have units of either count/det or counts/sec/det, where a det is 0.4 x 0.4 = 0.16 sq cm.
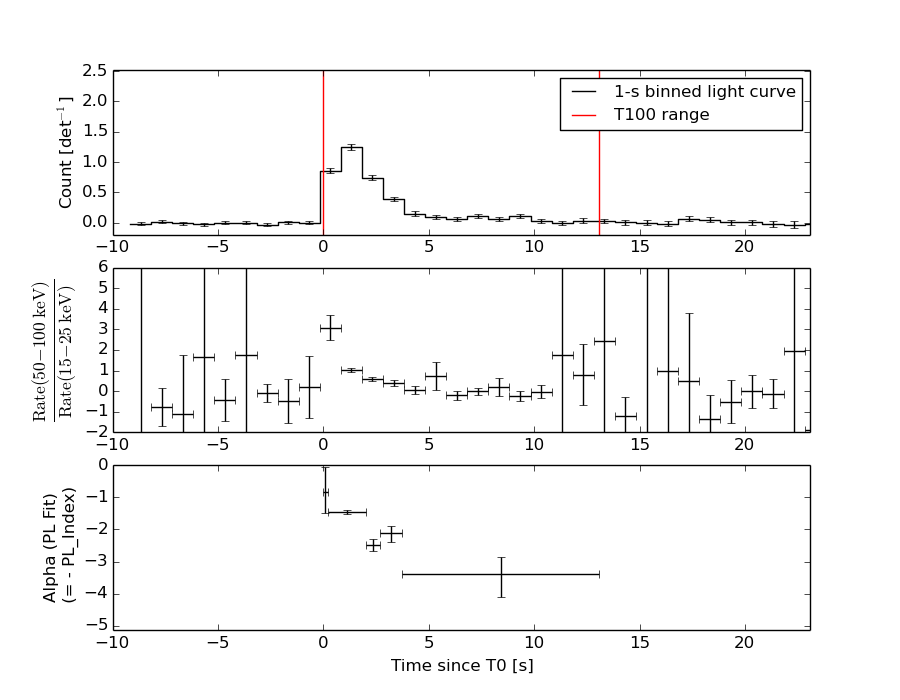
Best duration plot

Full-time range; 1 s binning
Other quick-look light curves:
- 64 ms binning (zoomed)
- 16 ms binning (zoomed)
- 8 ms binning (zoomed)
- 2 ms binning (zoomed)
- SN=5 or 10 s binning (full-time range)
- Raw light curve
Spectra
- 64 ms binning (zoomed)
- 16 ms binning (zoomed)
- 8 ms binning (zoomed)
- 2 ms binning (zoomed)
- SN=5 or 10 s binning (full-time range)
- Raw light curve
Spectra
Notes:
- 1) The fitting includes the systematic errors.
- 2) When the burst includes telescope slew time periods, the fitting uses an average response file made from multiple 5-s response files through out the slew time plus single time preiod for the non-slew times, and weighted by the total counts in the corresponding time period using addrmf. An average response file is needed becuase a spectral fit using the pre-slew DRM will introduce some errors in both a spectral shape and a normalization if the PHA file contains a lot of the slew/post-slew time interval.
- 3) For fits to more complicated models (e.g. a power-law over a cutoff power-law), the BAT team has decided to require a chi-square improvement of more than 6 for each extra dof.
Time averaged spectrum fit using the average DRM
Power-law model
Time interval is from    0.000 sec. to   13.088 sec.

Spectral model in power-law:
------------------------------------------------------------
Parameters  : value       lower 90%   higher 90%
Photon index: -1.86134     ( -0.105392   0.103582 )
Norm@50keV  : 1.87444E-02    ( -0.00115999   0.00115191 )
------------------------------------------------------------
#Fit statistic : Chi-Squared =          68.72 using 59 PHA bins.
# Reduced chi-squared =          1.206 for     57 degrees of freedom
# Null hypothesis probability =   1.374628e-01

Photon flux (15-150 keV)    in 13.09 sec: 2.64711 ( -0.15915  0.15959 ) ph/cm2/s
Energy fluence (15-150 keV)             : 2.25615e-06 ( -1.39403e-07  1.40194e-07 ) ergs/cm2
Cutoff power-law model
Time interval is from    0.000 sec. to   13.088 sec.
Spectral model in the cutoff power-law:
------------------------------------------------------------
Parameters  : value       lower 90%   higher 90%
Photon index: -1.30829     ( -0.422013   0.46808 )
Epeak [keV] : 60.0437      ( -10.9749 40.2941 )
Norm@50keV  : 3.62347E-02    ( -0.0140445   0.0264959 )
------------------------------------------------------------
#Fit statistic : Chi-Squared =          63.56 using 59 PHA bins.
# Reduced chi-squared =          1.135 for     56 degrees of freedom
# Null hypothesis probability =   2.274951e-01

Photon flux (15-150 keV)    in 13.09 sec: 2.56596 ( -0.16991  0.1704 ) ph/cm2/s
Energy fluence (15-150 keV)             : 2.16412e-06 ( -1.55488e-07  1.56105e-07 ) ergs/cm2
1-s peak spectrum fit
Power-law model
Time interval is from    0.516 sec. to    1.516 sec.

Spectral model in power-law:
------------------------------------------------------------
Parameters  : value       lower 90%   higher 90%
Photon index: -1.53839     ( -0.0949503   0.0942237 )
Norm@50keV  : 8.85856E-02    ( -0.00555237   0.00554569 )
------------------------------------------------------------
#Fit statistic : Chi-Squared =          75.05 using 59 PHA bins.
# Reduced chi-squared =          1.317 for     57 degrees of freedom
# Null hypothesis probability =   5.476264e-02

Photon flux (15-150 keV)    in 1 sec: 11.1775 ( -0.7192  0.7201 ) ph/cm2/s
Energy fluence (15-150 keV)             : 8.35468e-07 ( -5.51529e-08  5.53111e-08 ) ergs/cm2
Cutoff power-law model
Time interval is from    0.516 sec. to    1.516 sec.
Spectral model in the cutoff power-law:
------------------------------------------------------------
Parameters  : value       lower 90%   higher 90%
Photon index: -0.283102     ( -0.454045   0.501881 )
Epeak [keV] : 71.7894      ( -7.90907 13.0089 )
Norm@50keV  : 0.364900    ( -0.142839   0.263198 )
------------------------------------------------------------
#Fit statistic : Chi-Squared =          49.31 using 59 PHA bins.
# Reduced chi-squared =         0.8805 for     56 degrees of freedom
# Null hypothesis probability =   7.244107e-01

Photon flux (15-150 keV)    in 1 sec: 10.8305 ( -0.7316  0.7327 ) ph/cm2/s
Energy fluence (15-150 keV)             : 8.05972e-07 ( -5.67682e-08  5.69867e-08 ) ergs/cm2
Time-resolved spectra
Distribution
T90 vs. Hardness ratio plot
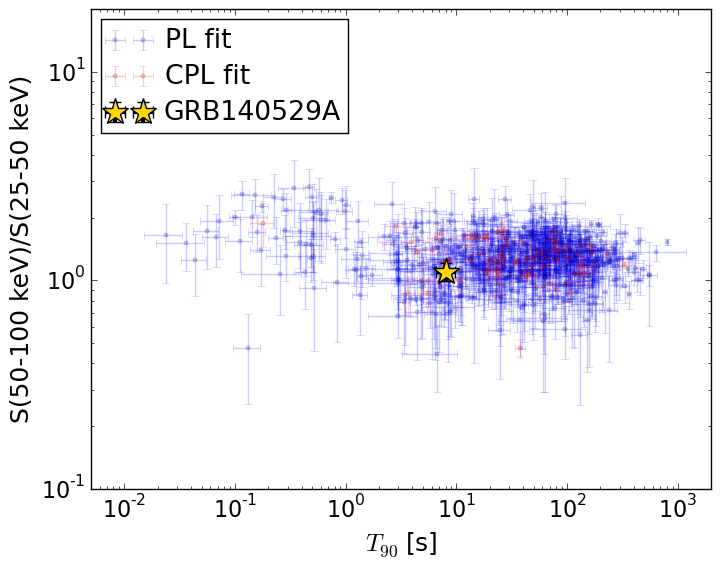
T90                                   = 8.144 sec.
Hardness ratio (energy fluence ratio) = 1.10090533071
S(15-50 keV) vs. S(50-150 keV) plot
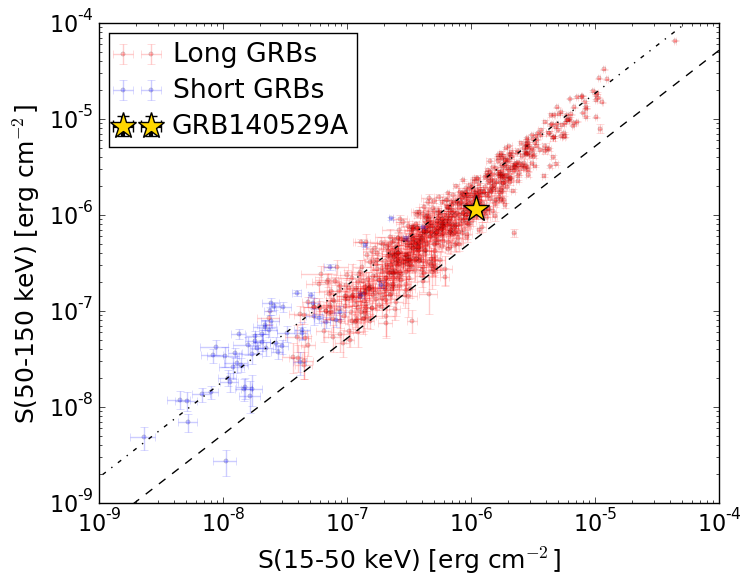
S(15-50 keV)  = 1.0898417e-06
S(50-150 keV) = 1.166345e-06
The dash-dotted line and the dashed line traces the fluences calculated from the Band function with Epeak = 15 and 150 keV, respectively. Both lines assume a canonical values of alpha = -1 and beta = -2.5.
Mask shadow pattern
Mask shadow pattern unavailable because this burst occurs during telescope slews.Spacecraft aspect plot