Analysis Summary
Notes:
- 1) No attempt has been made to eliminate the non-significant decimal places.
- 2) This batgrbproduct analysis is done using the HEASARC data.
- 3) This batgrbproduct analysis is using the flight position for the mask-weighting calculation.
======================================================================
BAT GRB EVENT DATA PROCESSING REPORT
Process Script Ver: batgrbproduct v2.46
Process Start Time: Sat Oct 4 22:36:58 EDT 2014
Host Name: batevent1
Current Working Dir: /local/data/batevent/batevent_reproc/trigger600951
======================================================================
Trigger: 00600951 Segment: 000
BAT Trigger Time: 423745105.6 [s; MET]
Trigger Stop: 423745105.728 [s; MET]
UTC: 2014-06-06T10:58:13.495520 [includes UTCF correction]
Where From?: TDRSS position message
BAT
RA: 201.807613565882 Dec: 37.5788694571298 [deg; J2000]
Catalogged Source?: NO
Point Source?: YES
GRB Indicated?: YES [ by BAT flight software ]
Image S/N Ratio: 7.42
Image Trigger?: NO
Rate S/N Ratio: 13.7477270848675 [ if not an image trigger ]
Image S/N Ratio: 7.42
Analysis Position: [ source = BAT ]
RA: 201.807613565882 Dec: 37.5788694571298 [deg; J2000]
Refined Position: [ source = BAT pre-slew burst ]
RA: 201.798922246996 Dec: 37.5988269157108 [deg; J2000]
{ 13h 27m 11.7s , +37d 35' 55.8" }
+/- 2.4185895417197 [arcmin] (estimated 90% radius based on SNR)
+/- 0.815123793905187 [arcmin] (formal 1-sigma fit error)
SNR: 8.6133564860637
Angular difference between the analysis and refined position is 1.266742 arcmin
Partial Coding Fraction: 0.8671875 [ including projection effects ]
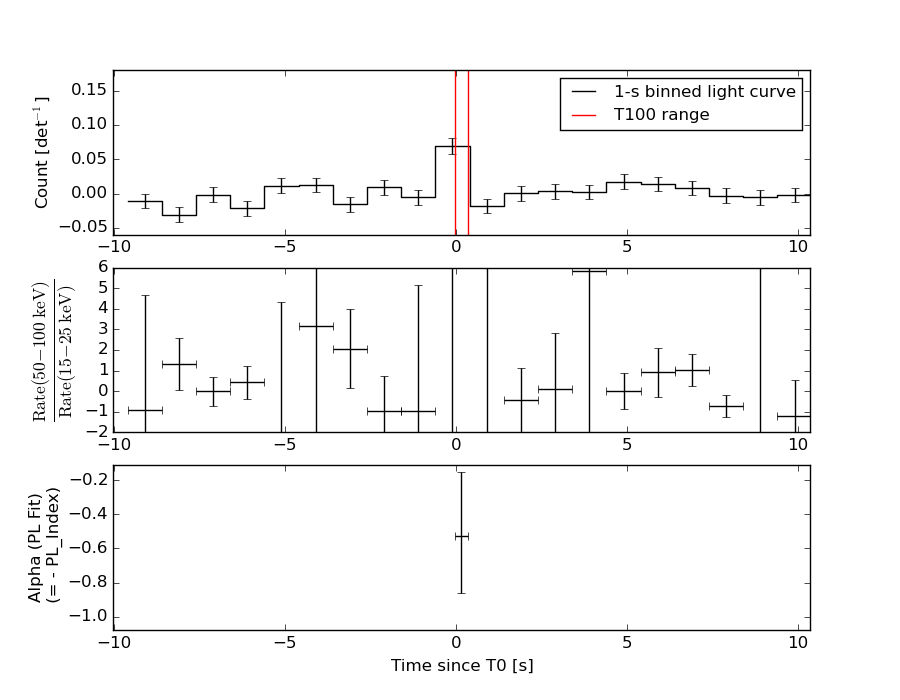
Duration
T90: 0.339999973773956 +/- 0.0944034143986181
Measured from: -0.0200000405311584
to: 0.319999933242798 [s; relative to TRIGTIME]
T50: 0.12799996137619 +/- 0.0950789192059972
Measured from: 0.0519999861717224
to: 0.179999947547913 [s; relative to TRIGTIME]
Fluence
Peak Flux (peak 1 second)
Measured from: -0.342000007629395
to: 0.657999992370605 [s; relative to TRIGTIME]
Total Fluence
Measured from: -0.0400000214576721
to: 0.351999998092651 [s; relative to TRIGTIME]
Band 1 Band 2 Band 3 Band 4
15-25 25-50 50-100 100-350 keV
Total 0.007116 0.015348 0.028451 0.022077
0.003747 0.004267 0.004405 0.003652 [error]
Peak 0.002890 0.009731 0.032100 0.022743
0.005702 0.006441 0.005997 0.005078 [error]
[ fluence units of on-axis counts / fully illuminated detector ]
======================================================================
====== Table of the duration information =============================
Value tstart tstop
T100 0.392 -0.040 0.352
T90 0.340 -0.020 0.320
T50 0.128 0.052 0.180
Peak 1.000 -0.342 0.658
====== Spectral Analysis Summary =====================================
Model : spectral model: simple power-law (PL) and cutoff power-law (CPL)
Ph_index : photon index: E^{Ph_index}
Ph_90err : 90% error of the photon index
Epeak : Epeak in keV
Epeak_90err: 90% error of Epeak
Norm : normalization at 50 keV in both the PL model and CPL model
Nomr_90err : 90% error of the normalization
chi2 : Chi-Squared
dof : degree of freedo
=== Time-averaged spectral analysis ===
(Best model with acceptable fit: PL)
Model Ph_index Ph_90err_low Ph_90err_hi Epeak Epeak_90err_low Epeak_90err_hi Norm Nomr_90err_low Norm_90err_hi chi2 dof
PL -0.525 -0.338 0.376 - - - 9.85e-03 -2.30e-03 2.22e-03 65.370 57
CPL 1.065 -1.696 2.974 134.245 -43.629 -134.245 3.51e-02 -3.51e-02 2.28e-01 63.120 56
=== 1-s peak spectral analysis ===
(Best model with acceptable fit: PL)
Model Ph_index Ph_90err_low Ph_90err_hi Epeak Epeak_90err_low Epeak_90err_hi Norm Nomr_90err_low Norm_90err_hi chi2 dof
PL -0.126 -0.493 0.624 - - - 3.60e-03 -1.42e-03 1.36e-03 53.790 57
CPL 1.299 -1.701 4.454 175.187 -175.187 -175.187 9.78e-03 -9.78e-03 1.31e-01 52.940 56
=== Fluence/Peak Flux Summary ===
Model Band1 Band2 Band3 Band4 Band5 Total
15-25 25-50 50-100 100-350 15-150 15-350 keV
Fluence PL 2.00e-09 6.72e-09 1.87e-08 1.56e-07 5.12e-08 1.83e-07 erg/cm2
90%_error_low -8.57e-10 -1.97e-09 -3.66e-09 -5.97e-08 -1.04e-08 -6.15e-08 erg/cm2
90%_error_hi 1.06e-09 1.97e-09 3.65e-09 8.41e-08 1.04e-08 8.36e-08 erg/cm2
Peak flux PL 4.04e-02 9.35e-02 1.71e-01 7.49e-01 4.65e-01 1.05e+00 ph/cm2/s
90%_error_low -2.63e-02 -4.59e-02 -4.66e-02 -3.25e-01 -1.29e-01 -3.24e-01 ph/cm2/s
90%_error_hi 4.10e-02 5.10e-02 4.51e-02 5.20e-01 1.33e-01 4.60e-01 ph/cm2/s
Fluence CPL 1.06e-09 6.39e-09 2.22e-08 4.69e-08 5.05e-08 7.65e-08 erg/cm2
90%_error_low -8.54e-10 -2.68e-09 -5.33e-09 N/A -1.09e-08 -3.13e-08 erg/cm2
90%_error_hi 1.43e-09 2.37e-09 5.64e-09 N/A 1.08e-08 1.30e-07 erg/cm2
Peak flux CPL 2.03e-02 8.15e-02 1.97e-01 3.34e-01 4.51e-01 6.33e-01 ph/cm2/s
90%_error_low -2.03e-02 -5.30e-02 -3.16e-02 -3.34e-01 -1.23e-01 -2.62e-01 ph/cm2/s
90%_error_hi 5.28e-02 5.83e-02 6.77e-02 8.12e-01 1.33e-01 6.99e-01 ph/cm2/s
======================================================================
Image
Pre-slew 15.0-350.0 keV image (Event data)
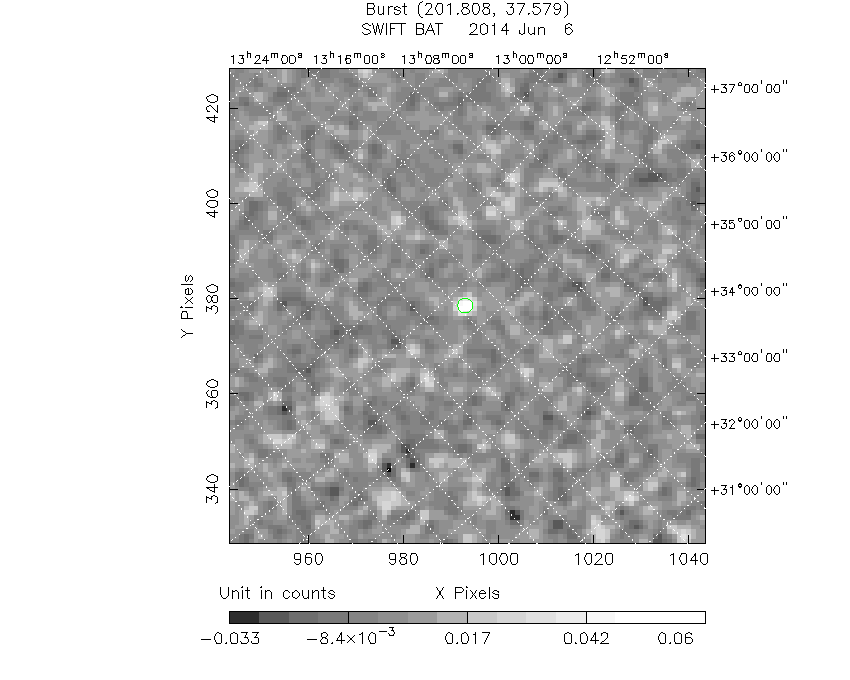
#   RAcent    DECcent   POSerr    Theta     Phi              Peak Cts       SNR   Name
  201.7989    37.5988   0.0224    17.4829   139.1656         0.0696343      8.613 TRIG_00600951

Foreground time interval of the image:
 -0.040   0.352 (delta_t =   0.392 [sec])
Background time interval of the image:
-87.899  -0.040 (delta_t =  87.859 [sec])
Light Curves
Note: The mask-weighted lightcurves have units of either count/det or counts/sec/det, where a det is 0.4 x 0.4 = 0.16 sq cm.
Full-time range; 1 s binning
Other quick-look light curves:
- 64 ms binning (zoomed)
- 16 ms binning (zoomed)
- 8 ms binning (zoomed)
- 2 ms binning (zoomed)
- SN=5 or 10 s binning (full-time range)
- Raw light curve
Spectra
- 64 ms binning (zoomed)
- 16 ms binning (zoomed)
- 8 ms binning (zoomed)
- 2 ms binning (zoomed)
- SN=5 or 10 s binning (full-time range)
- Raw light curve
Spectra
Notes:
- 1) The fitting includes the systematic errors.
- 2) When the burst includes telescope slew time periods, the fitting uses an average response file made from multiple 5-s response files through out the slew time plus single time preiod for the non-slew times, and weighted by the total counts in the corresponding time period using addrmf. An average response file is needed becuase a spectral fit using the pre-slew DRM will introduce some errors in both a spectral shape and a normalization if the PHA file contains a lot of the slew/post-slew time interval.
- 3) For fits to more complicated models (e.g. a power-law over a cutoff power-law), the BAT team has decided to require a chi-square improvement of more than 6 for each extra dof.
Time averaged spectrum fit using the average DRM
Power-law model

Time interval is from   -0.040 sec. to    0.352 sec.

Spectral model in power-law:
------------------------------------------------------------
Parameters  : value       lower 90%   higher 90%
Photon index: -0.525033     ( -0.337895   0.375533 )
Norm@50keV  : 9.85348E-03    ( -0.00230442   0.00221817 )
------------------------------------------------------------
#Fit statistic : Chi-Squared =          65.37 using 59 PHA bins.
# Reduced chi-squared =          1.147 for     57 degrees of freedom
# Null hypothesis probability =   2.089210e-01

Photon flux (15-150 keV)    in 0.392 sec: 1.16235 ( -0.237983  0.23992 ) ph/cm2/s
Energy fluence (15-150 keV)             : 5.12477e-08 ( -1.03559e-08  1.03814e-08 ) ergs/cm2
Cutoff power-law model
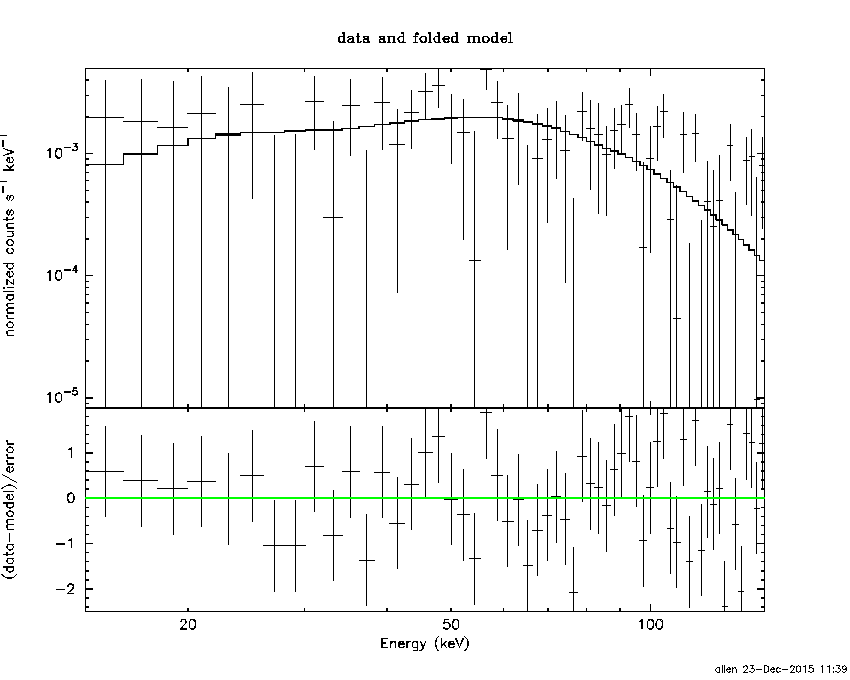
Time interval is from   -0.040 sec. to    0.352 sec.
Spectral model in the cutoff power-law:
------------------------------------------------------------
Parameters  : value       lower 90%   higher 90%
Photon index: 1.06455     ( -1.69615   2.97352 )
Epeak [keV] : 134.245      ( -43.6231 -134.239 )
Norm@50keV  : 3.50950E-02    ( -0.0350991   0.227845 )
------------------------------------------------------------
#Fit statistic : Chi-Squared =          63.12 using 59 PHA bins.
# Reduced chi-squared =          1.127 for     56 degrees of freedom
# Null hypothesis probability =   2.391524e-01

Photon flux (15-150 keV)    in 0.392 sec: 1.10558 ( -0.242598  0.24844 ) ph/cm2/s
Energy fluence (15-150 keV)             : 5.04586e-08 ( -1.09278e-08  1.07618e-08 ) ergs/cm2
1-s peak spectrum fit
Power-law model
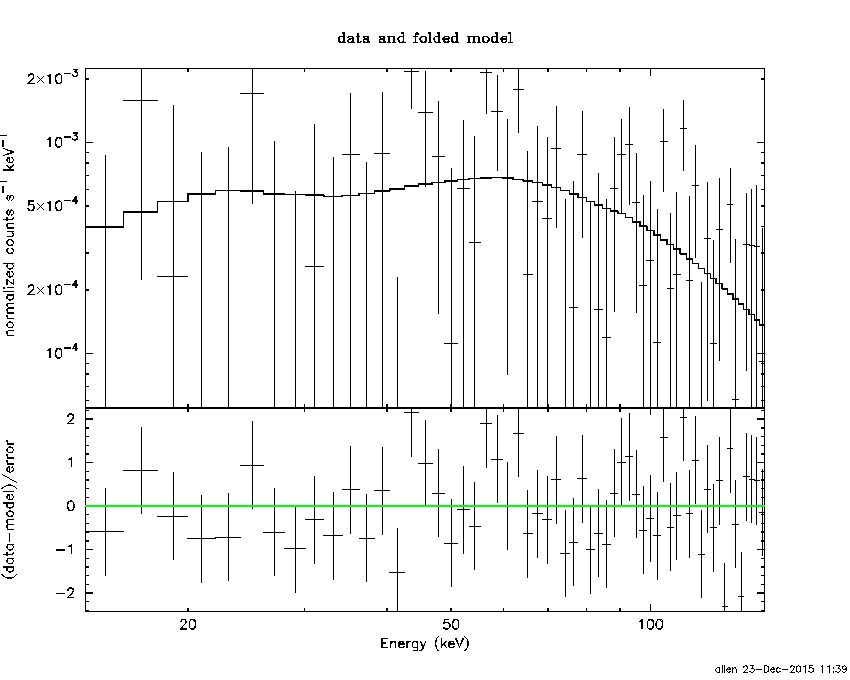
Time interval is from   -0.342 sec. to    0.658 sec.

Spectral model in power-law:
------------------------------------------------------------
Parameters  : value       lower 90%   higher 90%
Photon index: -0.126273     ( -0.492691   0.624273 )
Norm@50keV  : 3.59574E-03    ( -0.00142443   0.00135952 )
------------------------------------------------------------
#Fit statistic : Chi-Squared =          53.79 using 59 PHA bins.
# Reduced chi-squared =         0.9436 for     57 degrees of freedom
# Null hypothesis probability =   5.964388e-01

Photon flux (15-150 keV)    in 1 sec: 0.465484 ( -0.128917  0.132786 ) ph/cm2/s
Energy fluence (15-150 keV)             : 5.94128e-08 ( -1.48513e-08  1.48275e-08 ) ergs/cm2
Cutoff power-law model
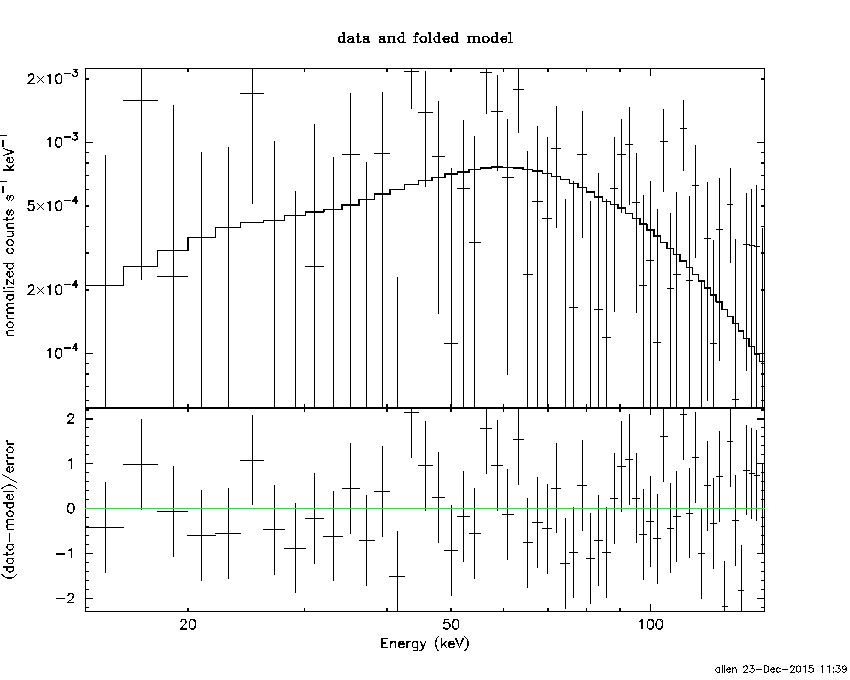
Time interval is from   -0.342 sec. to    0.658 sec.
Spectral model in the cutoff power-law:
------------------------------------------------------------
Parameters  : value       lower 90%   higher 90%
Photon index: 1.29943     ( -1.70097   4.45375 )
Epeak [keV] : 175.187      ( -175.197 -175.197 )
Norm@50keV  : 9.77773E-03    ( -0.00977693   0.13089 )
------------------------------------------------------------
#Fit statistic : Chi-Squared =          52.94 using 59 PHA bins.
# Reduced chi-squared =         0.9453 for     56 degrees of freedom
# Null hypothesis probability =   5.915685e-01

Photon flux (15-150 keV)    in 1 sec: 0.451061 ( -0.12332  0.132928 ) ph/cm2/s
Energy fluence (15-150 keV)             : 5.93581e-08 ( -1.55898e-08  1.5194e-08 ) ergs/cm2
Time-resolved spectra
Distribution
T90 vs. Hardness ratio plot
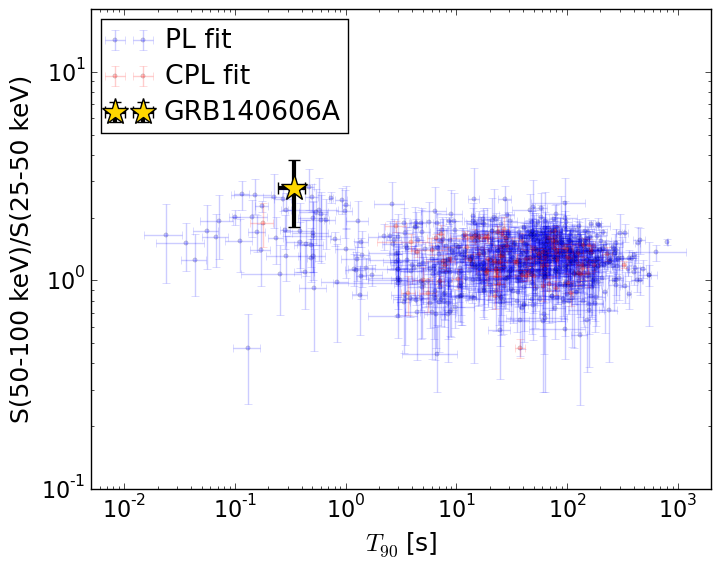
T90                                   = 0.34 sec.
Hardness ratio (energy fluence ratio) = 2.77977746425
S(15-50 keV) vs. S(50-150 keV) plot
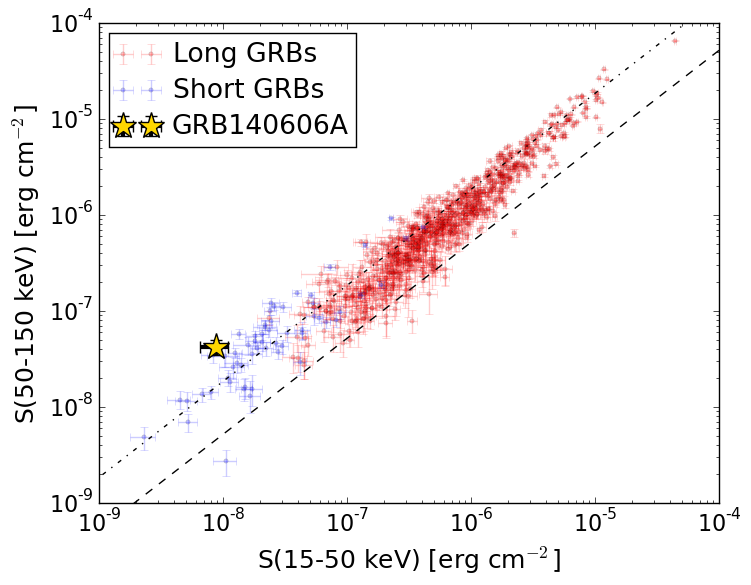
S(15-50 keV)  = 8.71295e-09
S(50-150 keV) = 4.253526e-08
The dash-dotted line and the dashed line traces the fluences calculated from the Band function with Epeak = 15 and 150 keV, respectively. Both lines assume a canonical values of alpha = -1 and beta = -2.5.
Mask shadow pattern
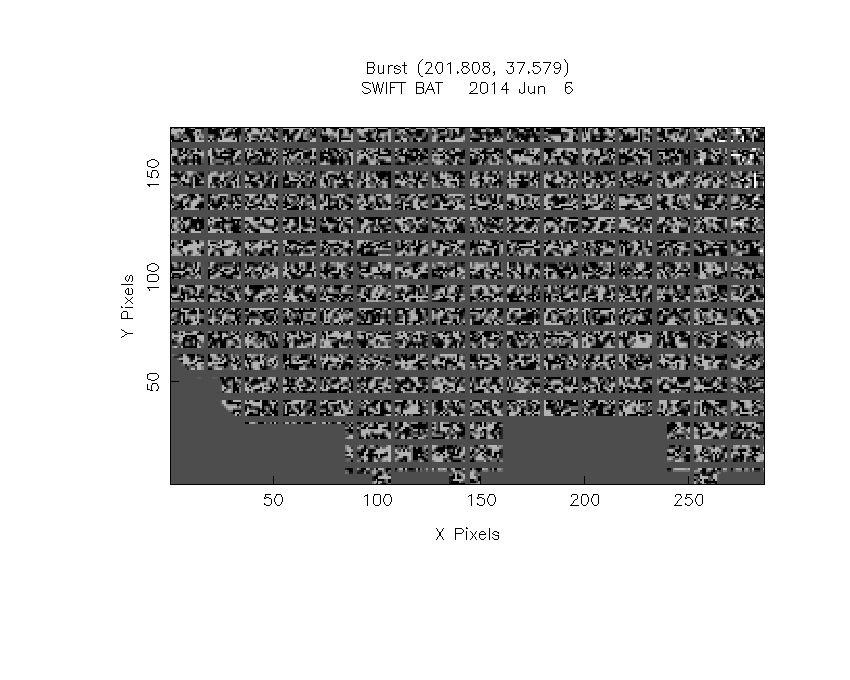
IMX = -2.383069636509457E-01, IMY = -2.059508394812140E-01
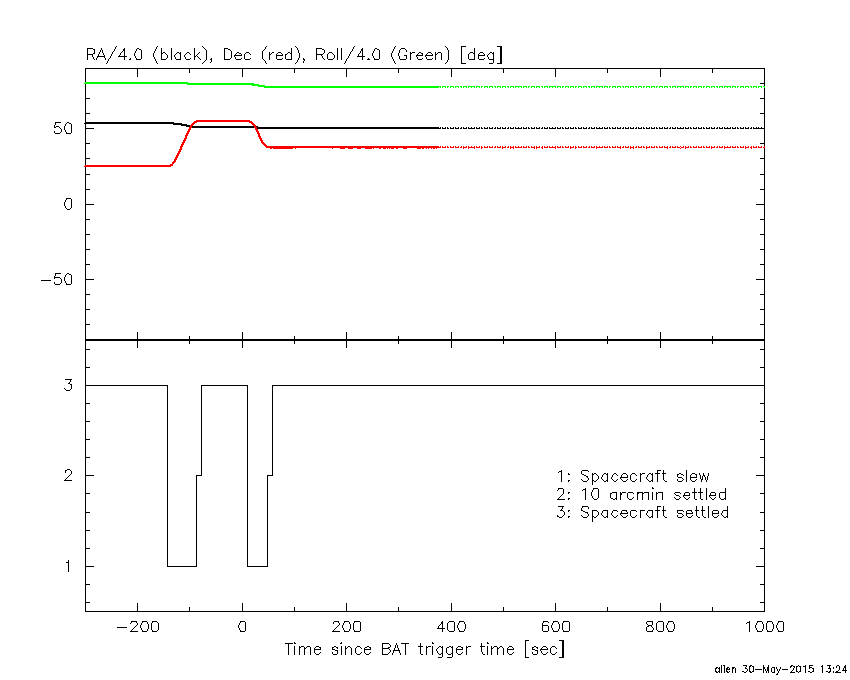
Spacecraft aspect plot
Bright source in the pre-burst/pre-slew/post-slew images
Pre-burst image of 15-350 keV band
Time interval of the image:
-87.899390 -0.040000

# RAcent  DECcent POSerr Theta    Phi  PeakCts   SNR AngSep     Name
#  [deg]    [deg]    ['] [deg]  [deg]                   [']
254.6195  35.3750    4.3  39.3   50.8   0.7178   2.7    8.2	Her X-1
172.2052  14.7761    2.6  47.3  176.7   1.0760   4.4 ------	UNKNOWN
147.7925  16.5925    3.3  57.6 -156.3   2.3723   3.5 ------	UNKNOWN
140.2915  28.8165    3.0  52.1 -140.5   2.0541   3.9 ------	UNKNOWN
Pre-slew background subtracted image of 15-350 keV band
Time interval of the image:
-0.040000 0.352000

# RAcent  DECcent POSerr Theta    Phi  PeakCts   SNR AngSep     Name
#  [deg]    [deg]    ['] [deg]  [deg]                   [']
254.6122  35.2948   23.8  39.4   50.9   0.0098   0.5    8.1	Her X-1
201.7989  37.5988    1.3  17.5  139.2   0.0696   8.6 ------	UNKNOWN
Post-slew image of 15-350 keV band
Time interval of the image:
48.500590 962.466100
1325.400000 1465.093700

# RAcent  DECcent POSerr Theta    Phi  PeakCts   SNR AngSep     Name
#  [deg]    [deg]    ['] [deg]  [deg]                   [']
254.5725  35.4153    8.2  41.9   35.1   1.6664   1.4    7.1	Her X-1
246.8055  67.5193    2.7  38.9  -15.7   3.1465   4.3 ------	UNKNOWN
184.5726  40.3347    3.1  13.6 -114.3   2.2567   3.7 ------	UNKNOWN
164.2212  36.1712    3.0  29.9 -122.3   2.9754   3.8 ------	UNKNOWN
152.7545  -0.0592    5.3  58.8 -159.2  12.6602   2.2 ------	UNKNOWN
155.1087  17.1648    3.1  45.6 -144.7   5.8526   3.7 ------	UNKNOWN
310.2279  76.7469    3.6  57.6  -26.3  12.6000   3.3 ------	UNKNOWN
314.3524  75.9210    3.3  58.8  -26.0  16.3225   3.5 ------	UNKNOWN