Analysis Summary
Notes:
- 1) No attempt has been made to eliminate the non-significant decimal places.
- 2) This batgrbproduct analysis is done using the HEASARC data.
- 3) This batgrbproduct analysis is using the flight position for the mask-weighting calculation.
======================================================================
                  BAT GRB EVENT DATA PROCESSING REPORT
    Process Script Ver: batgrbproduct v2.46
    Process Start Time: Mon Jun  8 19:02:52 EDT 2015
             Host Name: bat1
   Current Working Dir: /local/data/bat1/alien/Swift_3rdBATcatalog/event/batevent_reproc/trigger601646
======================================================================

  Trigger: 00601646      Segment: 000

  BAT Trigger Time: 424400712   [s; MET]
      Trigger Stop: 424400776   [s; MET]
               UTC: 2014-06-14T01:04:59.863980    [includes UTCF correction]
       Where From?: TDRSS position message

  BAT
    RA: 231.231943297946   Dec: -79.0949444262299  [deg; J2000]

     Catalogged Source?: NO
     Point Source?:      YES
     GRB Indicated?:     YES    [ by BAT flight software ]
     Image S/N Ratio:    10.09
     Image Trigger?:     YES
     Rate S/N Ratio:     0  [ if not an image trigger ]
     Image S/N Ratio:    10.09

  Analysis Position:   [ source = BAT ]
    RA: 231.231943297946   Dec: -79.0949444262299  [deg; J2000]

  Refined Position:   [ source = BAT pre-slew burst ]
    RA: 231.202561740872   Dec: -79.115805193322  [deg; J2000]
        { 15h 24m 48.6s , -79d 06' 56.9" }
         +/- 2.36554660928276 [arcmin] (estimated 90% radius based on SNR)
         +/- 1.02379070569814 [arcmin] (formal 1-sigma fit error)
    SNR: 8.89058849547418

  Angular difference between the analysis and refined position is 1.295236 arcmin

  Partial Coding Fraction: 0.9765625    [ including projection effects ]

  Duration
     T90: 77.3919999599457 +/- 15.8909127857189
        Measured from: 10.4160000085831
                   to: 87.8079999685287     [s; relative to TRIGTIME]
     T50: 37.2399999499321 +/- 10.0319738298158
        Measured from: 36.6560000181198
                   to: 73.8959999680519     [s; relative to TRIGTIME]


  Fluence
     Peak Flux  (peak 1 second)
        Measured from: 53.1200000047684
                   to: 54.1200000047684     [s; relative to TRIGTIME]
     Total Fluence
        Measured from: -4.46399998664856
                   to: 92.3560000061989     [s; relative to TRIGTIME]

             Band 1     Band 2     Band 3     Band 4
              15-25      25-50     50-100    100-350     keV
 Total     0.486922   0.639116   0.481830   0.167918
           0.055349   0.057172   0.050689   0.045662 [error]
 Peak      0.018920   0.004930   0.020576   0.014926
           0.005632   0.005769   0.005314   0.004542 [error]

     [ fluence units of on-axis counts / fully illuminated detector ]

======================================================================


====== Table of the duration information =============================

        Value   tstart    tstop
T100   96.820   -4.464   92.356
T90    77.392   10.416   87.808
T50    37.240   36.656   73.896
Peak    1.000   53.120   54.120


====== Spectral Analysis Summary =====================================

Model      : spectral model: simple power-law (PL) and cutoff power-law (CPL)
Ph_index   : photon index: E^{Ph_index}
Ph_90err   : 90% error of the photon index
Epeak      : Epeak in keV
Epeak_90err: 90% error of Epeak
Norm       : normalization at 50 keV in both the PL model and CPL model
Nomr_90err : 90% error of the normalization
chi2       : Chi-Squared
dof        : degree of freedo

=== Time-averaged spectral analysis ===
(Best model with acceptable fit: PL)

Model Ph_index Ph_90err_low Ph_90err_hi  Epeak  Epeak_90err_low  Epeak_90err_hi  Norm       Nomr_90err_low    Norm_90err_hi    chi2    dof
PL      -1.497    -0.180      0.178       -           -               -         1.13e-03     -1.14e-04          1.13e-04      55.360   57
CPL     -1.424    -0.934      0.618      389.691    -389.691      -389.691      1.23e-03     -7.75e-04          1.25e-03      55.410   56


=== 1-s peak spectral analysis ===
(Best model with acceptable fit: N/A)

Model Ph_index Ph_90err_low Ph_90err_hi  Epeak  Epeak_90err_low  Epeak_90err_hi  Norm       Nomr_90err_low    Norm_90err_hi    chi2    dof
PL      -0.775     -0.944     1.359       -           -               -         2.82e-03     -1.62e-03          1.12e-03      62.500   57
CPL     -0.873      0.873     0.993     9999.360      N/A           N/A         2.90e-03        N/A               N/A         62.550   56


=== Fluence/Peak Flux Summary ===

              Model    Band1     Band2     Band3     Band4     Band5     Total
                       15-25     25-50    50-100    100-350    15-150    15-350    keV
Fluence         PL   1.39e-07  2.55e-07  3.62e-07  1.08e-06  1.03e-06  1.84e-06   erg/cm2
      90%_error_low -2.23e-08 -2.52e-08 -4.96e-08 -2.88e-07 -1.17e-07 -3.32e-07   erg/cm2
      90%_error_hi   2.33e-08  2.51e-08  4.94e-08  3.54e-07  1.19e-07  3.88e-07   erg/cm2
Peak flux       PL   5.79e-02  9.02e-02  1.06e-01  2.40e-01  3.24e-01  4.93e-01   ph/cm2/s
      90%_error_low -5.07e-02 -9.02e-02 -4.49e-02 -1.80e-01 -3.24e-01 -2.01e-01   ph/cm2/s
      90%_error_hi   8.26e-02  5.41e-02  3.92e-02  5.44e-01  1.31e-01  1.16e+00   ph/cm2/s

Fluence        CPL   1.39e-07  2.55e-07  3.62e-07  1.08e-06  1.04e-06  1.70e-06   erg/cm2
      90%_error_low -2.65e-08 -2.46e-08 -4.09e-08 -7.03e-07 -1.34e-07 -5.79e-07   erg/cm2
      90%_error_hi   1.77e-08  3.08e-08  5.19e-08  1.96e-07  9.24e-08  2.33e-07   erg/cm2
Peak flux      CPL   5.83e-02  3.82e-02  1.71e-02  1.25e-02  1.19e-01  1.26e-01   ph/cm2/s
      90%_error_low -5.83e-02 -3.82e-02 -1.71e-02 -1.25e-02     N/A       N/A     ph/cm2/s
      90%_error_hi   8.76e-02  5.97e-02  3.09e-02  3.26e-02     N/A       N/A     ph/cm2/s

======================================================================
Image
Pre-slew 15.0-350.0 keV image (Event data)
#   RAcent    DECcent   POSerr    Theta     Phi              Peak Cts       SNR   Name
  231.2026   -79.1158   0.0216    11.2532    49.0415         1.0457368      8.891 TRIG_00601646

Foreground time interval of the image:
 -4.464  74.301 (delta_t =  78.765 [sec])
Background time interval of the image:
-141.699  -4.464 (delta_t = 137.235 [sec])
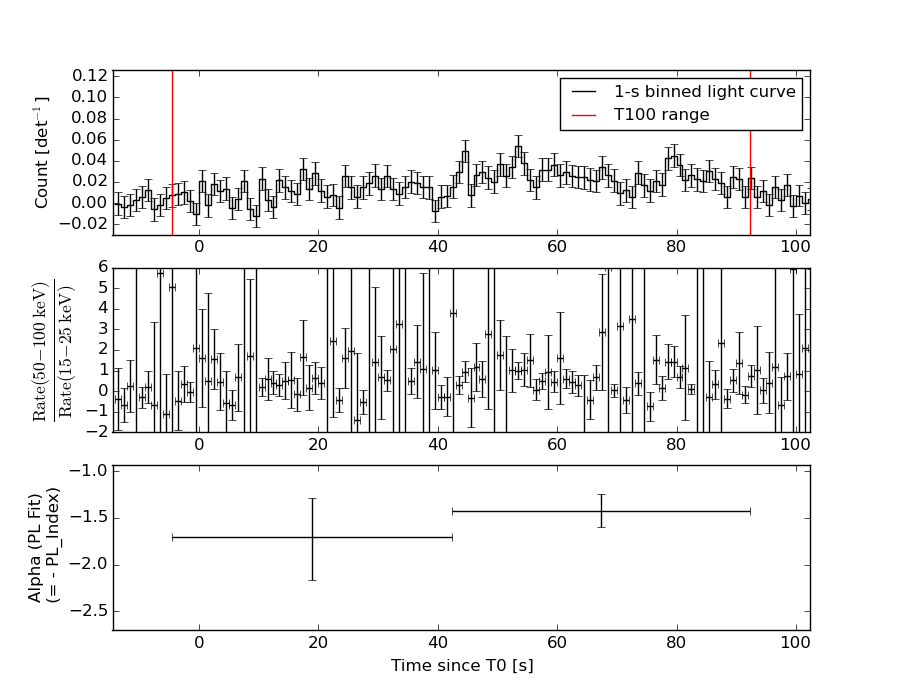
Light Curves
Note: The mask-weighted lightcurves have units of either count/det or counts/sec/det, where a det is 0.4 x 0.4 = 0.16 sq cm.
Full-time range; 1 s binning
Other quick-look light curves:
- 64 ms binning (zoomed)
- 16 ms binning (zoomed)
- 8 ms binning (zoomed)
- 2 ms binning (zoomed)
- SN=5 or 10 s binning (full-time range)
- Raw light curve
Spectra
- 64 ms binning (zoomed)
- 16 ms binning (zoomed)
- 8 ms binning (zoomed)
- 2 ms binning (zoomed)
- SN=5 or 10 s binning (full-time range)
- Raw light curve
Spectra
Notes:
- 1) The fitting includes the systematic errors.
- 2) When the burst includes telescope slew time periods, the fitting uses an average response file made from multiple 5-s response files through out the slew time plus single time preiod for the non-slew times, and weighted by the total counts in the corresponding time period using addrmf. An average response file is needed becuase a spectral fit using the pre-slew DRM will introduce some errors in both a spectral shape and a normalization if the PHA file contains a lot of the slew/post-slew time interval.
- 3) For fits to more complicated models (e.g. a power-law over a cutoff power-law), the BAT team has decided to require a chi-square improvement of more than 6 for each extra dof.
Time averaged spectrum fit using the average DRM
Power-law model
Time interval is from   -4.464 sec. to   92.356 sec.

Spectral model in power-law:
------------------------------------------------------------
Parameters  : value       lower 90%   higher 90%
Photon index: -1.49674     ( -0.18038   0.177741 )
Norm@50keV  : 1.12576E-03    ( -0.000114167   0.000112954 )
------------------------------------------------------------
#Fit statistic : Chi-Squared =          55.36 using 59 PHA bins.
# Reduced chi-squared =         0.9712 for     57 degrees of freedom
# Null hypothesis probability =   5.367886e-01

Photon flux (15-150 keV)    in 96.82 sec: 0.140420 ( -0.013522  0.013537 ) ph/cm2/s
Energy fluence (15-150 keV)             : 1.03468e-06 ( -1.16862e-07  1.18631e-07 ) ergs/cm2
Cutoff power-law model

Time interval is from   -4.464 sec. to   92.356 sec.
Spectral model in the cutoff power-law:
------------------------------------------------------------
Parameters  : value       lower 90%   higher 90%
Photon index: -1.49427     ( -0.927256   0.625071 )
Epeak [keV] : 9997.37      ( -9997.65 -9997.65 )
Norm@50keV  : 1.12914E-03    ( -0.000677655   0.00134556 )
------------------------------------------------------------
#Fit statistic : Chi-Squared =          55.36 using 59 PHA bins.
# Reduced chi-squared =         0.9886 for     56 degrees of freedom
# Null hypothesis probability =   4.989724e-01

Photon flux (15-150 keV)    in 96.82 sec: 0.140553 ( -0.014144  0.013481 ) ph/cm2/s
Energy fluence (15-150 keV)             : 1.03616e-06 ( -1.3385e-07  9.24032e-08 ) ergs/cm2
1-s peak spectrum fit
Power-law model
Time interval is from   53.120 sec. to   54.120 sec.

Spectral model in power-law:
------------------------------------------------------------
Parameters  : value       lower 90%   higher 90%
Photon index: -0.775289     ( -0.947265   1.35635 )
Norm@50keV  : 2.82082E-03    ( -0.00161925   0.00112687 )
------------------------------------------------------------
#Fit statistic : Chi-Squared =          62.50 using 59 PHA bins.
# Reduced chi-squared =          1.096 for     57 degrees of freedom
# Null hypothesis probability =   2.873511e-01

Photon flux (15-150 keV)    in 1 sec: 0.324171 ( -0.324171  0.131341 ) ph/cm2/s
Energy fluence (15-150 keV)             : 3.33511e-08 ( -1.36391e-08  1.33944e-08 ) ergs/cm2
Cutoff power-law model
Time interval is from   53.120 sec. to   54.120 sec.
Spectral model in the cutoff power-law:
------------------------------------------------------------
Parameters  : value       lower 90%   higher 90%
Photon index: -3.82568     ( 3.86004   3.98024 )
Epeak [keV] : 429.423      (   )
Norm@50keV  : 1.63118E-04    (     )
------------------------------------------------------------
#Fit statistic : Chi-Squared =          60.98 using 59 PHA bins.
# Reduced chi-squared =          1.089 for     56 degrees of freedom
# Null hypothesis probability =   3.014301e-01

Photon flux (15-150 keV)    in 1 sec: 0.119266 (    ) ph/cm2/s
Energy fluence (15-150 keV)             : 3.31444e-08 ( -1.34728e-08  1.35742e-08 ) ergs/cm2
Time-resolved spectra
Distribution
T90 vs. Hardness ratio plot
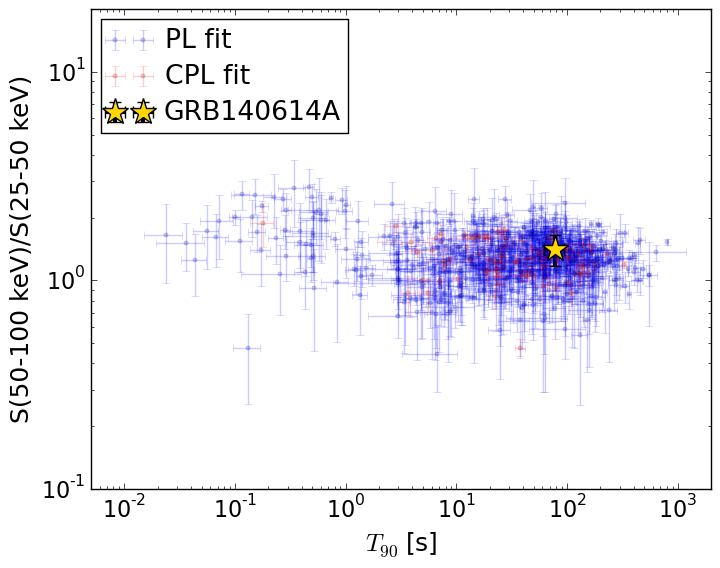
T90                                   = 77.392 sec.
Hardness ratio (energy fluence ratio) = 1.41742493336
S(15-50 keV) vs. S(50-150 keV) plot
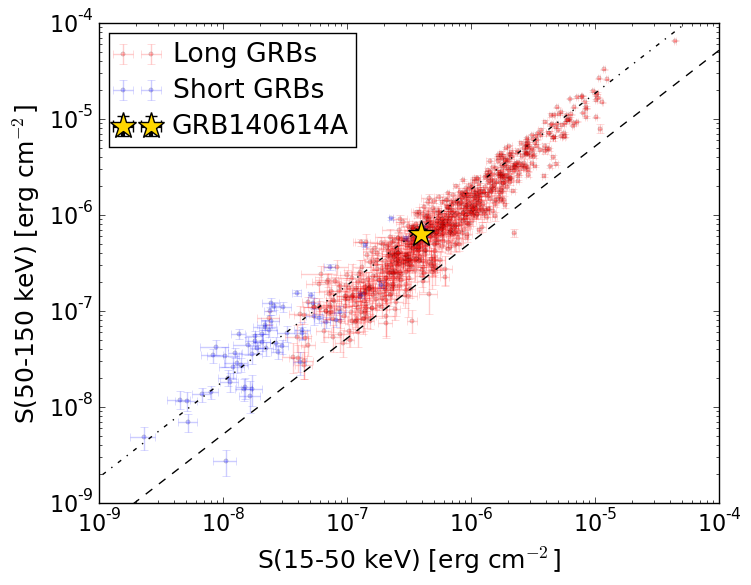
S(15-50 keV)  = 3.942269e-07
S(50-150 keV) = 6.404535e-07
The dash-dotted line and the dashed line traces the fluences calculated from the Band function with Epeak = 15 and 150 keV, respectively. Both lines assume a canonical values of alpha = -1 and beta = -2.5.
Mask shadow pattern
IMX = 1.304282376318495E-01, IMY = -1.502599801490593E-01
Spacecraft aspect plot
Bright source in the pre-burst/pre-slew/post-slew images
Pre-burst image of 15-350 keV band
Time interval of the image:
-141.699420 -4.464000

# RAcent  DECcent POSerr Theta    Phi  PeakCts   SNR AngSep     Name
#  [deg]    [deg]    ['] [deg]  [deg]                   [']
135.4939 -40.4719    2.9  53.2  -27.7   1.7935   3.9    5.2	Vela X-1
170.4295 -60.7672  128.7  32.4    3.9  -0.0162  -0.1    9.3	Cen X-3
186.7396 -62.8021    2.0  29.7   18.5   0.9902   5.7    3.0	GX 301-2
234.8103 -56.2682    2.6  33.4   66.0   1.2397   4.5 ------	UNKNOWN
342.9842 -30.3354    2.2  56.3 -179.3   4.0328   5.2 ------	UNKNOWN
159.8901 -54.3858    2.5  39.0   -5.2   0.9497   4.6 ------	UNKNOWN
 96.1326 -69.7157    2.4  23.2  -61.4   0.8116   4.8 ------	UNKNOWN
 20.4764 -36.4363    2.4  52.0 -140.3   3.8059   4.9 ------	UNKNOWN
Pre-slew background subtracted image of 15-350 keV band
Time interval of the image:
-4.464000 74.300590

# RAcent  DECcent POSerr Theta    Phi  PeakCts   SNR AngSep     Name
#  [deg]    [deg]    ['] [deg]  [deg]                   [']
135.5615 -40.5749    5.9  53.1  -27.6   0.7916   2.0    1.9	Vela X-1
170.5804 -60.6357   14.2  32.5    4.1   0.1160   0.8    7.8	Cen X-3
186.8592 -62.7846    7.7  29.7   18.6  -0.2244  -1.5    5.6	GX 301-2
256.1229 -51.8064    2.4  36.5   88.5   1.7021   4.8 ------	UNKNOWN
231.2026 -79.1158    1.3  11.3   49.0   1.0456   8.9 ------	UNKNOWN
Post-slew image of 15-350 keV band
Time interval of the image:
111.300600 963.008400

# RAcent  DECcent POSerr Theta    Phi  PeakCts   SNR AngSep     Name
#  [deg]    [deg]    ['] [deg]  [deg]                   [']
170.0605 -60.4748    0.0  25.9  -24.9  -0.5511  -1.6   11.7	Cen X-3
186.6071 -62.7757    3.1  20.8   -8.7   1.3691   3.7    1.4	GX 301-2
264.6794 -44.5769    4.0  36.7   97.1   2.9993   2.9    8.1	4U 1735-44
252.3901 -40.4841    2.5  39.5   81.6   6.9616   4.6 ------	UNKNOWN
210.4336 -42.8751    3.0  37.1   30.5   2.0621   3.8 ------	UNKNOWN
220.9276 -65.6962    2.9  13.7   37.9   1.3052   4.0 ------	UNKNOWN
245.9761 -75.7859    3.4   4.6  107.6   1.1159   3.4 ------	UNKNOWN
132.2683 -84.2832    2.5  13.1  -98.2   1.5422   4.6 ------	UNKNOWN
 11.2361 -39.9181    7.2  58.7 -159.2   5.7149   1.6 ------	UNKNOWN
 55.9311 -64.6578    3.4  36.2 -120.6   2.1145   3.4 ------	UNKNOWN
142.6672 -39.3606    2.5  51.2  -41.4   9.4273   4.5 ------	UNKNOWN
 43.5522 -52.3509    2.7  48.5 -130.2   8.3757   4.3 ------	UNKNOWN