Analysis Summary
Notes:
- 1) No attempt has been made to eliminate the non-significant decimal places.
- 2) This batgrbproduct analysis is done using the HEASARC data.
- 3) This batgrbproduct analysis is using the flight position for the mask-weighting calculation.
======================================================================
BAT GRB EVENT DATA PROCESSING REPORT
Process Script Ver: batgrbproduct v2.46
Process Start Time: Sat Oct 4 22:14:23 EDT 2014
Host Name: batevent1
Current Working Dir: /local/data/batevent/batevent_reproc/trigger601662
======================================================================
Trigger: 00601662 Segment: 000
BAT Trigger Time: 424420703.936 [s; MET]
Trigger Stop: 424420720.32 [s; MET]
UTC: 2014-06-14T06:38:11.799000 [includes UTCF correction]
Where From?: TDRSS position message
BAT
RA: 322.625366627712 Dec: 14.9204847784049 [deg; J2000]
Catalogged Source?: NO
Point Source?: YES
GRB Indicated?: YES [ by BAT flight software ]
Image S/N Ratio: 9.7
Image Trigger?: NO
Rate S/N Ratio: 13.2664991614216 [ if not an image trigger ]
Image S/N Ratio: 9.7
Analysis Position: [ source = BAT ]
RA: 322.625366627712 Dec: 14.9204847784049 [deg; J2000]
Refined Position: [ source = BAT pre-slew burst ]
RA: 322.635989321396 Dec: 14.8961097076857 [deg; J2000]
{ 21h 30m 32.6s , +14d 53' 46.0" }
+/- 2.02565998374233 [arcmin] (estimated 90% radius based on SNR)
+/- 0.834388085219816 [arcmin] (formal 1-sigma fit error)
SNR: 11.0959928282915
Angular difference between the analysis and refined position is 1.586903 arcmin
Partial Coding Fraction: 0.7109375 [ including projection effects ]
Duration
T90: 49.8719999194145 +/- 7.994274206225
Measured from: -1.16799998283386
to: 48.7039999365807 [s; relative to TRIGTIME]
T50: 24.2519999742508 +/- 8.85475168263233
Measured from: 6.12000000476837
to: 30.3719999790192 [s; relative to TRIGTIME]
Fluence
Peak Flux (peak 1 second)
Measured from: 6.92800003290176
to: 7.92800003290176 [s; relative to TRIGTIME]
Total Fluence
Measured from: -3.283999979496
to: 55.6759999990463 [s; relative to TRIGTIME]
Band 1 Band 2 Band 3 Band 4
15-25 25-50 50-100 100-350 keV
Total 0.437566 0.472962 0.192335 0.051573
0.051140 0.052825 0.045236 0.038633 [error]
Peak 0.024563 0.019651 0.013317 0.007901
0.006803 0.007248 0.006171 0.005114 [error]
[ fluence units of on-axis counts / fully illuminated detector ]
======================================================================
====== Table of the duration information =============================
Value tstart tstop
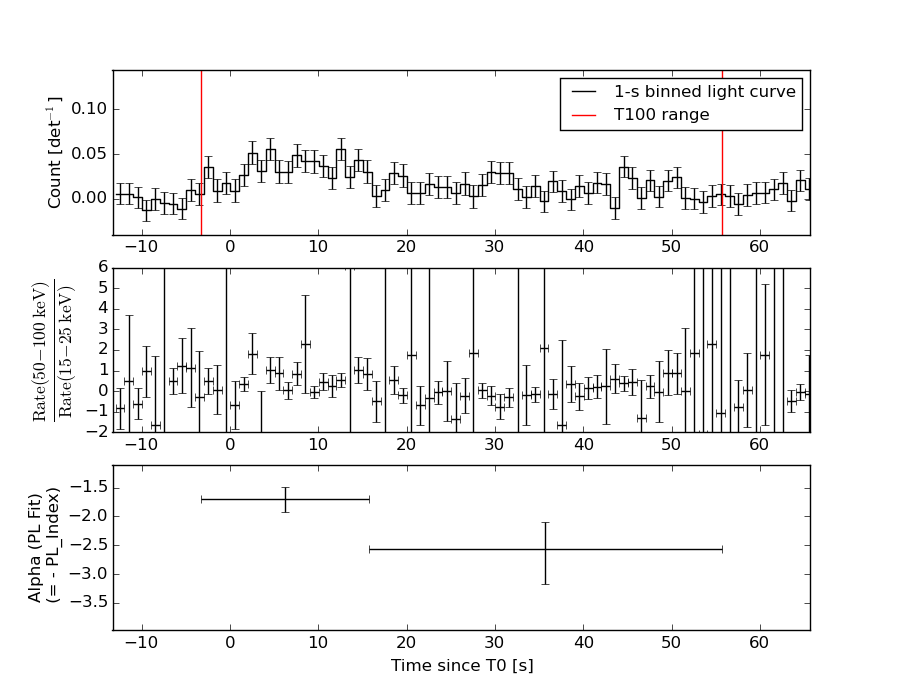
T100 58.960 -3.284 55.676
T90 49.872 -1.168 48.704
T50 24.252 6.120 30.372
Peak 1.000 6.928 7.928
====== Spectral Analysis Summary =====================================
Model : spectral model: simple power-law (PL) and cutoff power-law (CPL)
Ph_index : photon index: E^{Ph_index}
Ph_90err : 90% error of the photon index
Epeak : Epeak in keV
Epeak_90err: 90% error of Epeak
Norm : normalization at 50 keV in both the PL model and CPL model
Nomr_90err : 90% error of the normalization
chi2 : Chi-Squared
dof : degree of freedo
=== Time-averaged spectral analysis ===
(Best model with acceptable fit: PL)
Model Ph_index Ph_90err_low Ph_90err_hi Epeak Epeak_90err_low Epeak_90err_hi Norm Nomr_90err_low Norm_90err_hi chi2 dof
PL -2.055 -0.263 0.242 - - - 1.07e-03 -1.92e-04 1.86e-04 54.930 57
CPL -0.946 -0.818 1.490 38.758 N/A N/A 4.76e-03 N/A N/A 52.140 56
=== 1-s peak spectral analysis ===
(Best model with acceptable fit: N/A)
Model Ph_index Ph_90err_low Ph_90err_hi Epeak Epeak_90err_low Epeak_90err_hi Norm Nomr_90err_low Norm_90err_hi chi2 dof
PL -1.802 -0.721 0.652 - - - 3.67e-03 -1.58e-03 1.43e-03 54.240 57
CPL -2.325 -1.182 1.701 118.350 N/A N/A 1.89e-03 N/A N/A 53.670 56
=== Fluence/Peak Flux Summary ===
Model Band1 Band2 Band3 Band4 Band5 Total
15-25 25-50 50-100 100-350 15-150 15-350 keV
Fluence PL 1.36e-07 1.79e-07 1.72e-07 2.95e-07 5.84e-07 7.81e-07 erg/cm2
90%_error_low -2.36e-08 -2.41e-08 -4.09e-08 -1.17e-07 -9.43e-08 -1.71e-07 erg/cm2
90%_error_hi 2.42e-08 2.39e-08 4.23e-08 1.60e-07 9.73e-08 2.04e-07 erg/cm2
Peak flux PL 2.02e-01 1.70e-01 9.76e-02 8.32e-02 5.06e-01 5.53e-01 ph/cm2/s
90%_error_low -9.56e-02 -5.44e-02 -9.76e-02 -8.32e-02 -1.62e-01 -1.83e-01 ph/cm2/s
90%_error_hi 9.89e-02 5.43e-02 5.41e-02 1.31e-01 1.62e-01 1.89e-01 ph/cm2/s
Fluence CPL 1.24e-07 2.03e-07 1.60e-07 5.74e-08 5.30e-07 5.45e-07 erg/cm2
90%_error_low -2.80e-08 -3.43e-08 -5.12e-08 N/A -9.45e-08 -1.08e-07 erg/cm2
90%_error_hi 2.75e-08 3.57e-08 4.92e-08 N/A 1.08e-07 2.59e-07 erg/cm2
Peak flux CPL 1.82e-01 1.14e-01 4.80e-02 3.30e-02 3.58e-01 3.78e-01 ph/cm2/s
90%_error_low -1.11e-01 -6.97e-02 -4.80e-02 -3.30e-02 N/A -2.30e-01 ph/cm2/s
90%_error_hi 1.11e-01 1.04e-01 9.42e-02 4.09e-02 N/A 3.14e-01 ph/cm2/s
======================================================================
Image
Pre-slew 15.0-350.0 keV image (Event data)
#   RAcent    DECcent   POSerr    Theta     Phi              Peak Cts       SNR   Name
  322.6360    14.8961   0.0173    20.1491   111.8494         1.1290962     11.096 TRIG_00601662

Foreground time interval of the image:
 -3.284  55.676 (delta_t =  58.960 [sec])
Background time interval of the image:
-239.936  -3.284 (delta_t = 236.652 [sec])
Light Curves
Note: The mask-weighted lightcurves have units of either count/det or counts/sec/det, where a det is 0.4 x 0.4 = 0.16 sq cm.
Full-time range; 1 s binning
Other quick-look light curves:
- 64 ms binning (zoomed)
- 16 ms binning (zoomed)
- 8 ms binning (zoomed)
- 2 ms binning (zoomed)
- SN=5 or 10 s binning (full-time range)
- Raw light curve
Spectra
- 64 ms binning (zoomed)
- 16 ms binning (zoomed)
- 8 ms binning (zoomed)
- 2 ms binning (zoomed)
- SN=5 or 10 s binning (full-time range)
- Raw light curve
Spectra
Notes:
- 1) The fitting includes the systematic errors.
- 2) When the burst includes telescope slew time periods, the fitting uses an average response file made from multiple 5-s response files through out the slew time plus single time preiod for the non-slew times, and weighted by the total counts in the corresponding time period using addrmf. An average response file is needed becuase a spectral fit using the pre-slew DRM will introduce some errors in both a spectral shape and a normalization if the PHA file contains a lot of the slew/post-slew time interval.
- 3) For fits to more complicated models (e.g. a power-law over a cutoff power-law), the BAT team has decided to require a chi-square improvement of more than 6 for each extra dof.
Time averaged spectrum fit using the average DRM
Power-law model
Time interval is from   -3.284 sec. to   55.676 sec.

Spectral model in power-law:
------------------------------------------------------------
Parameters  : value       lower 90%   higher 90%
Photon index: -2.0548     ( -0.26344   0.242162 )
Norm@50keV  : 1.07003E-03    ( -0.000191719   0.000186348 )
------------------------------------------------------------
#Fit statistic : Chi-Squared =          54.93 using 59 PHA bins.
# Reduced chi-squared =         0.9636 for     57 degrees of freedom
# Null hypothesis probability =   5.532161e-01

Photon flux (15-150 keV)    in 58.96 sec: 0.164698 ( -0.021475  0.021476 ) ph/cm2/s
Energy fluence (15-150 keV)             : 5.83979e-07 ( -9.42599e-08  9.72722e-08 ) ergs/cm2
Cutoff power-law model
Time interval is from   -3.284 sec. to   55.676 sec.
Spectral model in the cutoff power-law:
------------------------------------------------------------
Parameters  : value       lower 90%   higher 90%
Photon index: -0.94605     ( -0.817924   1.49022 )
Epeak [keV] : 38.7575      (   )
Norm@50keV  : 4.75907E-03    (     )
------------------------------------------------------------
#Fit statistic : Chi-Squared =          52.14 using 59 PHA bins.
# Reduced chi-squared =         0.9310 for     56 degrees of freedom
# Null hypothesis probability =   6.218533e-01

Photon flux (15-150 keV)    in 58.96 sec: 0.158842 ( -0.022127  0.022204 ) ph/cm2/s
Energy fluence (15-150 keV)             : 5.30063e-07 ( -9.45034e-08  1.07712e-07 ) ergs/cm2
1-s peak spectrum fit
Power-law model
Time interval is from    6.928 sec. to    7.928 sec.

Spectral model in power-law:
------------------------------------------------------------
Parameters  : value       lower 90%   higher 90%
Photon index: -1.80184     ( -0.721411   0.651967 )
Norm@50keV  : 3.67202E-03    ( -0.00158419   0.00143481 )
------------------------------------------------------------
#Fit statistic : Chi-Squared =          54.24 using 59 PHA bins.
# Reduced chi-squared =         0.9515 for     57 degrees of freedom
# Null hypothesis probability =   5.793410e-01

Photon flux (15-150 keV)    in 1 sec: 0.506384 ( -0.161657  0.161657 ) ph/cm2/s
Energy fluence (15-150 keV)             : 3.38073e-08 ( -1.35846e-08  1.46869e-08 ) ergs/cm2
Cutoff power-law model
Time interval is from    6.928 sec. to    7.928 sec.
Spectral model in the cutoff power-law:
------------------------------------------------------------
Parameters  : value       lower 90%   higher 90%
Photon index: -2.38414     ( -1.12159   1.76058 )
Epeak [keV] : 136.913      (   )
Norm@50keV  : 1.77720E-03    (     )
------------------------------------------------------------
#Fit statistic : Chi-Squared =          53.65 using 59 PHA bins.
# Reduced chi-squared =         0.9580 for     56 degrees of freedom
# Null hypothesis probability =   5.644477e-01

Photon flux (15-150 keV)    in 1 sec: 0.358208 (    ) ph/cm2/s
Energy fluence (15-150 keV)             : 3.3614e-08 ( -1.35097e-08  1.4313e-08 ) ergs/cm2
Time-resolved spectra
Distribution
T90 vs. Hardness ratio plot
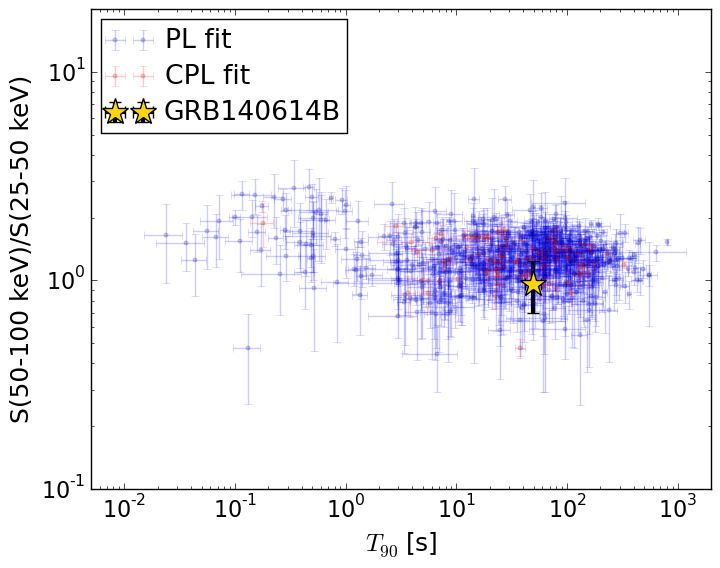
T90                                   = 49.872 sec.
Hardness ratio (energy fluence ratio) = 0.962786068203
S(15-50 keV) vs. S(50-150 keV) plot
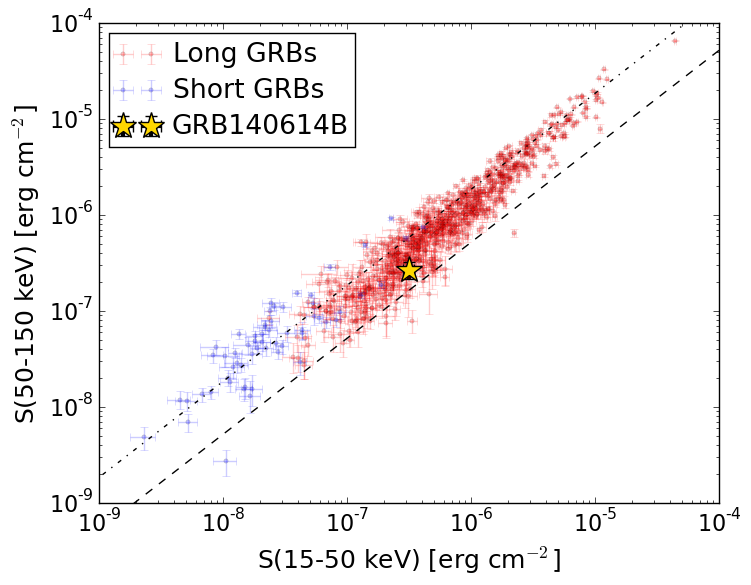
S(15-50 keV)  = 3.14529e-07
S(50-150 keV) = 2.6944999e-07
The dash-dotted line and the dashed line traces the fluences calculated from the Band function with Epeak = 15 and 150 keV, respectively. Both lines assume a canonical values of alpha = -1 and beta = -2.5.
Mask shadow pattern
IMX = -1.365559274131149E-01, IMY = -3.405622276047429E-01
Spacecraft aspect plot
Bright source in the pre-burst/pre-slew/post-slew images
Pre-burst image of 15-350 keV band
Time interval of the image:
-239.936000 -3.284000

# RAcent  DECcent POSerr Theta    Phi  PeakCts   SNR AngSep     Name
#  [deg]    [deg]    ['] [deg]  [deg]                   [']
299.6037  35.2009    1.3  43.5  147.1   5.2074   8.6    0.7	Cyg X-1
308.0906  40.9639    3.2  39.3  158.9   1.4372   3.6    1.1	Cyg X-3
326.1802  38.1588   13.3  26.8  171.2   0.1924   0.9    9.8	Cyg X-2
348.1354 -28.7665    3.0  45.1   16.8   1.5232   3.9 ------	UNKNOWN
333.0485  -0.0235    2.2  19.2   56.1   1.2143   5.2 ------	UNKNOWN
357.2748 -26.3206    2.3  44.5    4.8   1.7691   5.0 ------	UNKNOWN
Pre-slew background subtracted image of 15-350 keV band
Time interval of the image:
-3.284000 55.676000

# RAcent  DECcent POSerr Theta    Phi  PeakCts   SNR AngSep     Name
#  [deg]    [deg]    ['] [deg]  [deg]                   [']
299.6385  35.2033    4.9  43.4  147.1   0.5786   2.4    2.4	Cyg X-1
308.1002  40.7514    7.9  39.2  158.6  -0.2212  -1.5   12.1	Cyg X-3
326.0575  38.4424   11.9  27.1  171.4   0.0966   1.0    9.0	Cyg X-2
322.6360  14.8961    1.0  20.1  111.8   1.1290  11.1 ------	UNKNOWN
296.2171  62.7380    2.5  56.9  178.8   2.4376   4.6 ------	UNKNOWN
358.5949 -13.8842    2.2  33.5   -4.7   0.5700   5.2 ------	UNKNOWN
 20.4564 -26.1890    2.6  55.5  -18.3   1.2941   4.3 ------	UNKNOWN
 21.1069  -5.8838    1.9  43.2  -39.9   1.0273   6.1 ------	UNKNOWN
Post-slew image of 15-350 keV band
Time interval of the image:
114.564580 962.097400

# RAcent  DECcent POSerr Theta    Phi  PeakCts   SNR AngSep     Name
#  [deg]    [deg]    ['] [deg]  [deg]                   [']
288.8101  10.9509    0.6  33.2  119.5  20.7546  18.4    0.8	GRS 1915+105
299.5887  35.2025    0.3  29.0  170.9  25.4872  39.0    0.1	Cyg X-1
308.1329  40.9619    1.3  28.9 -170.8   5.4914   9.2    1.2	Cyg X-3
326.1003  38.1466    9.6  23.4 -140.9   0.7087   1.2   11.0	Cyg X-2
293.1212 -11.6990    3.7  39.6   81.6   8.0152   3.1 ------	UNKNOWN