Analysis Summary
Notes:
- 1) No attempt has been made to eliminate the non-significant decimal places.
- 2) This batgrbproduct analysis is done using the HEASARC data.
- 3) This batgrbproduct analysis is using the flight position for the mask-weighting calculation.
======================================================================
                  BAT GRB EVENT DATA PROCESSING REPORT
    Process Script Ver: batgrbproduct v2.46
    Process Start Time: Sat Oct  4 22:08:24 EDT 2014
             Host Name: batevent1
   Current Working Dir: /local/data/batevent/batevent_reproc/trigger602080
======================================================================

  Trigger: 00602080      Segment: 000

  BAT Trigger Time: 424870728   [s; MET]
      Trigger Stop: 424870792   [s; MET]
               UTC: 2014-06-19T11:38:35.841160    [includes UTCF correction]
       Where From?: TDRSS position message

  BAT
    RA: 27.092354772269   Dec: -39.2614499007029  [deg; J2000]

     Catalogged Source?: NO
     Point Source?:      YES
     GRB Indicated?:     YES    [ by BAT flight software ]
     Image S/N Ratio:    7.08
     Image Trigger?:     YES
     Rate S/N Ratio:     0  [ if not an image trigger ]
     Image S/N Ratio:    7.08

  Analysis Position:   [ source = BAT ]
    RA: 27.092354772269   Dec: -39.2614499007029  [deg; J2000]

  Refined Position:   [ source = BAT pre-slew burst ]
    RA: 27.0990030177594   Dec: -39.2494495994421  [deg; J2000]
        { 01h 48m 23.8s , -39d 14' 58.0" }
         +/- 1.78397912338527 [arcmin] (estimated 90% radius based on SNR)
         +/- 1.02951059353024 [arcmin] (formal 1-sigma fit error)
    SNR: 13.3042421303934

  Angular difference between the analysis and refined position is 0.783474 arcmin

  Partial Coding Fraction: 0.4179688    [ including projection effects ]

  Duration
     T90: 233.047999978065 +/- 13.5465538223676
        Measured from: 79.1119999885559
                   to: 312.159999966621     [s; relative to TRIGTIME]
     T50: 66.2039999365807 +/- 2.15011814222922
        Measured from: 171.040000021458
                   to: 237.243999958038     [s; relative to TRIGTIME]


  Fluence
     Peak Flux  (peak 1 second)
        Measured from: 219.519999980927
                   to: 220.519999980927     [s; relative to TRIGTIME]
     Total Fluence
        Measured from: 32.3080000281334
                   to: 335.987999975681     [s; relative to TRIGTIME]

             Band 1     Band 2     Band 3     Band 4
              15-25      25-50     50-100    100-350     keV
 Total    10.319227  13.379472   9.629057   2.472457
           0.124616   0.136213   0.120473   0.113025 [error]
 Peak      0.138839   0.194099   0.172107   0.041713
           0.007866   0.008901   0.008305   0.006411 [error]

     [ fluence units of on-axis counts / fully illuminated detector ]

======================================================================


====== Table of the duration information =============================

        Value   tstart    tstop
T100  303.680   32.308  335.988
T90   233.048   79.112  312.160
T50    66.204  171.040  237.244
Peak    1.000  219.520  220.520


====== Spectral Analysis Summary =====================================

Model      : spectral model: simple power-law (PL) and cutoff power-law (CPL)
Ph_index   : photon index: E^{Ph_index}
Ph_90err   : 90% error of the photon index
Epeak      : Epeak in keV
Epeak_90err: 90% error of Epeak
Norm       : normalization at 50 keV in both the PL model and CPL model
Nomr_90err : 90% error of the normalization
chi2       : Chi-Squared
dof        : degree of freedo

=== Time-averaged spectral analysis ===
(Best model with acceptable fit: PL)

Model Ph_index Ph_90err_low Ph_90err_hi  Epeak  Epeak_90err_low  Epeak_90err_hi  Norm       Nomr_90err_low    Norm_90err_hi    chi2    dof
PL      -1.557    -0.034      0.034       -           -               -         7.43e-03     -1.24e-04          1.24e-04      39.020   57
CPL     -1.528    -0.043      0.114      919.773    -919.773      -919.773      7.65e-03     -3.27e-04          8.87e-04      39.070   56


=== 1-s peak spectral analysis ===
(Best model with acceptable fit: PL)

Model Ph_index Ph_90err_low Ph_90err_hi  Epeak  Epeak_90err_low  Epeak_90err_hi  Norm       Nomr_90err_low    Norm_90err_hi    chi2    dof
PL      -1.320     -0.089     0.089       -           -               -         3.50e-02     -1.75e-03          1.75e-03      52.570   57
CPL     -1.059     -0.298     0.373      194.308     -84.049      -194.308      4.65e-02     -1.25e-02          2.26e-02      50.940   56


=== Fluence/Peak Flux Summary ===

              Model    Band1     Band2     Band3     Band4     Band5     Total
                       15-25     25-50    50-100    100-350    15-150    15-350    keV
Fluence         PL   3.04e-06  5.40e-06  7.33e-06  2.06e-05  2.12e-05  3.63e-05   erg/cm2
      90%_error_low -1.12e-07 -1.14e-07 -1.43e-07 -9.57e-07 -3.57e-07 -1.00e-06   erg/cm2
      90%_error_hi   1.14e-07  1.13e-07  1.43e-07  9.91e-07  3.57e-07  1.03e-06   erg/cm2
Peak flux       PL   1.21e+00  1.36e+00  1.09e+00  1.45e+00  4.19e+00  5.11e+00   ph/cm2/s
      90%_error_low -1.11e-01 -7.63e-02 -6.64e-02 -1.79e-01 -2.13e-01 -2.64e-01   ph/cm2/s
      90%_error_hi   1.15e-01  7.59e-02  6.60e-02  1.94e-01  2.13e-01  2.66e-01   ph/cm2/s

Fluence        CPL   3.06e-06  5.41e-06  7.35e-06  2.05e-05  2.12e-05  3.60e-05   erg/cm2
      90%_error_low -1.87e-07 -1.30e-07 -1.56e-07 -3.35e-06 -4.16e-07 -4.02e-06   erg/cm2
      90%_error_hi   7.15e-08  1.10e-07  1.37e-07  5.87e-07  3.76e-07  1.66e-06   erg/cm2
Peak flux      CPL   1.14e+00  1.38e+00  1.12e+00  1.09e+00  4.14e+00  4.74e+00   ph/cm2/s
      90%_error_low -1.41e-01 -8.37e-02 -7.68e-02 -3.31e-01 -2.25e-01 -4.15e-01   ph/cm2/s
      90%_error_hi   1.45e-01  8.49e-02  7.80e-02  4.18e-01  2.24e-01  5.09e-01   ph/cm2/s

======================================================================
Image
Pre-slew 15.0-350.0 keV image (Event data)
#   RAcent    DECcent   POSerr    Theta     Phi              Peak Cts       SNR   Name
   27.0990   -39.2494   0.0145    34.1475    37.3346         1.4865868     13.304 TRIG_00602080

Foreground time interval of the image:
 32.308  72.701 (delta_t =  40.393 [sec])
Background time interval of the image:
-399.899 -380.879 (delta_t =  19.021 [sec])
-239.000  32.308 (delta_t = 271.308 [sec])
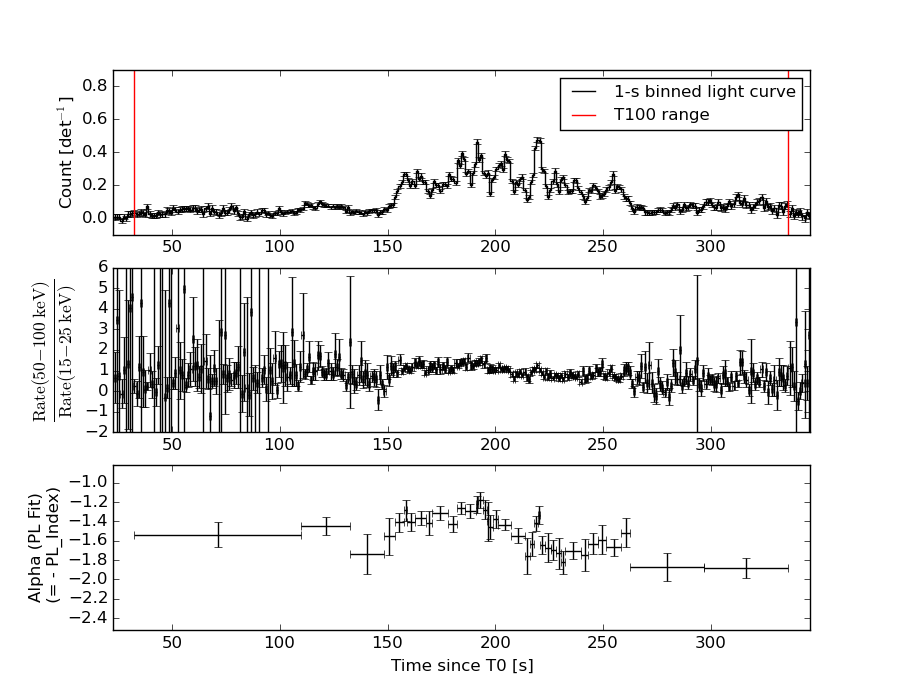
Light Curves
Note: The mask-weighted lightcurves have units of either count/det or counts/sec/det, where a det is 0.4 x 0.4 = 0.16 sq cm.
Full-time range; 1 s binning
Other quick-look light curves:
- 64 ms binning (zoomed)
- 16 ms binning (zoomed)
- 8 ms binning (zoomed)
- 2 ms binning (zoomed)
- SN=5 or 10 s binning (full-time range)
- Raw light curve
Spectra
- 64 ms binning (zoomed)
- 16 ms binning (zoomed)
- 8 ms binning (zoomed)
- 2 ms binning (zoomed)
- SN=5 or 10 s binning (full-time range)
- Raw light curve
Spectra
Notes:
- 1) The fitting includes the systematic errors.
- 2) When the burst includes telescope slew time periods, the fitting uses an average response file made from multiple 5-s response files through out the slew time plus single time preiod for the non-slew times, and weighted by the total counts in the corresponding time period using addrmf. An average response file is needed becuase a spectral fit using the pre-slew DRM will introduce some errors in both a spectral shape and a normalization if the PHA file contains a lot of the slew/post-slew time interval.
- 3) For fits to more complicated models (e.g. a power-law over a cutoff power-law), the BAT team has decided to require a chi-square improvement of more than 6 for each extra dof.
Time averaged spectrum fit using the average DRM
Power-law model
Time interval is from   32.308 sec. to  335.988 sec.

Spectral model in power-law:
------------------------------------------------------------
Parameters  : value       lower 90%   higher 90%
Photon index: -1.55714     ( -0.0335458   0.0335867 )
Norm@50keV  : 7.43143E-03    ( -0.000124101   0.000124056 )
------------------------------------------------------------
#Fit statistic : Chi-Squared =          39.02 using 59 PHA bins.
# Reduced chi-squared =         0.6845 for     57 degrees of freedom
# Null hypothesis probability =   9.670312e-01

Photon flux (15-150 keV)    in 303.7 sec: 0.942758 ( -0.019096  0.019182 ) ph/cm2/s
Energy fluence (15-150 keV)             : 2.12283e-05 ( -3.56711e-07  3.57367e-07 ) ergs/cm2
Cutoff power-law model
Time interval is from   32.308 sec. to  335.988 sec.
Spectral model in the cutoff power-law:
------------------------------------------------------------
Parameters  : value       lower 90%   higher 90%
Photon index: -1.55458     ( -0.0413304   0.115665 )
Epeak [keV] : 9998.30      ( -9998.26 -9998.26 )
Norm@50keV  : 7.45091E-03    ( -0.000123668   0.00109044 )
------------------------------------------------------------
#Fit statistic : Chi-Squared =          39.01 using 59 PHA bins.
# Reduced chi-squared =         0.6966 for     56 degrees of freedom
# Null hypothesis probability =   9.590193e-01

Photon flux (15-150 keV)    in 303.7 sec: 0.941796 ( -0.02308  0.020427 ) ph/cm2/s
Energy fluence (15-150 keV)             : 2.12141e-05 ( -4.16436e-07  3.75993e-07 ) ergs/cm2
1-s peak spectrum fit
Power-law model
Time interval is from  219.520 sec. to  220.520 sec.

Spectral model in power-law:
------------------------------------------------------------
Parameters  : value       lower 90%   higher 90%
Photon index: -1.31991     ( -0.0888283   0.0885364 )
Norm@50keV  : 3.50139E-02    ( -0.00174747   0.00174548 )
------------------------------------------------------------
#Fit statistic : Chi-Squared =          52.57 using 59 PHA bins.
# Reduced chi-squared =         0.9224 for     57 degrees of freedom
# Null hypothesis probability =   6.416465e-01

Photon flux (15-150 keV)    in 1 sec: 4.19301 ( -0.21303  0.21323 ) ph/cm2/s
Energy fluence (15-150 keV)             : 3.4439e-07 ( -1.93102e-08  1.94077e-08 ) ergs/cm2
Cutoff power-law model
Time interval is from  219.520 sec. to  220.520 sec.
Spectral model in the cutoff power-law:
------------------------------------------------------------
Parameters  : value       lower 90%   higher 90%
Photon index: -1.05917     ( -0.298052   0.372743 )
Epeak [keV] : 194.308      ( -84.0472 -194.306 )
Norm@50keV  : 4.65320E-02    ( -0.0124931   0.0225767 )
------------------------------------------------------------
#Fit statistic : Chi-Squared =          50.94 using 59 PHA bins.
# Reduced chi-squared =         0.9096 for     56 degrees of freedom
# Null hypothesis probability =   6.664640e-01

Photon flux (15-150 keV)    in 1 sec: 4.13909 ( -0.22454  0.22436 ) ph/cm2/s
Energy fluence (15-150 keV)             : 3.3879e-07 ( -2.08977e-08  2.08103e-08 ) ergs/cm2
Time-resolved spectra
Distribution
T90 vs. Hardness ratio plot
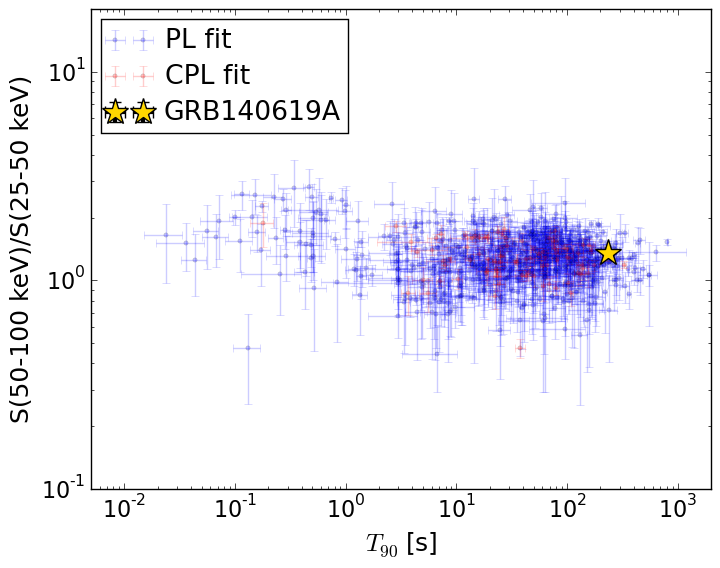
T90                                   = 233.048 sec.
Hardness ratio (energy fluence ratio) = 1.35931494597
S(15-50 keV) vs. S(50-150 keV) plot
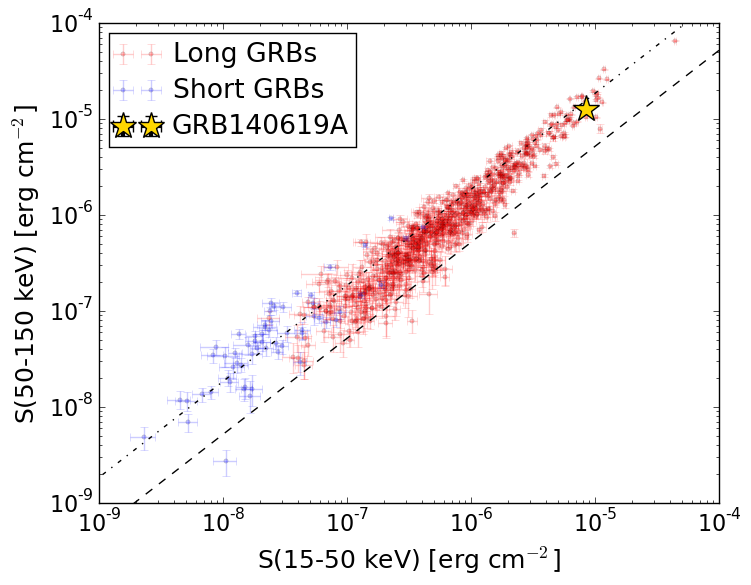
S(15-50 keV)  = 8.4363e-06
S(50-150 keV) = 1.2792042e-05
The dash-dotted line and the dashed line traces the fluences calculated from the Band function with Epeak = 15 and 150 keV, respectively. Both lines assume a canonical values of alpha = -1 and beta = -2.5.
Mask shadow pattern
IMX = 5.392903072956995E-01, IMY = -4.113437548703612E-01
Spacecraft aspect plot
Bright source in the pre-burst/pre-slew/post-slew images
Pre-burst image of 15-350 keV band
Time interval of the image:
-399.899410 -380.878800
-239.000000 32.308000

# RAcent  DECcent POSerr Theta    Phi  PeakCts   SNR AngSep     Name
#  [deg]    [deg]    ['] [deg]  [deg]                   [']
 28.5877 -56.5679    2.8  51.0   31.2   5.2330   4.2 ------	UNKNOWN
352.5879  30.8539    2.5  54.3  162.0   6.2409   4.6 ------	UNKNOWN
 38.2576   0.6988    3.2   7.4 -123.2   0.7249   3.6 ------	UNKNOWN
 25.8410  52.4591    4.2  58.7 -159.2   4.9519   2.8 ------	UNKNOWN
Pre-slew background subtracted image of 15-350 keV band
Time interval of the image:
32.308000 72.700600

# RAcent  DECcent POSerr Theta    Phi  PeakCts   SNR AngSep     Name
#  [deg]    [deg]    ['] [deg]  [deg]                   [']
 27.0991 -39.2495    0.9  34.1   37.3   1.4861  13.3 ------	UNKNOWN
Post-slew image of 15-350 keV band
Time interval of the image:
127.900620 483.100000

# RAcent  DECcent POSerr Theta    Phi  PeakCts   SNR AngSep     Name
#  [deg]    [deg]    ['] [deg]  [deg]                   [']
 15.8778 -76.2744    5.2  37.4   40.9   8.8980   2.2 ------	UNKNOWN
116.3950 -67.3164    4.5  54.0    8.1  19.6127   2.6 ------	UNKNOWN
 27.1283 -39.2365    0.7   0.0 -132.0  33.1574  15.7 ------	UNKNOWN
107.4425 -46.4956    2.8  56.7  -17.7  39.9484   4.2 ------	UNKNOWN