Analysis Summary
Notes:
- 1) No attempt has been made to eliminate the non-significant decimal places.
- 2) This batgrbproduct analysis is done using the HEASARC data.
- 3) This batgrbproduct analysis is using the flight position for the mask-weighting calculation.
======================================================================
                  BAT GRB EVENT DATA PROCESSING REPORT
    Process Script Ver: batgrbproduct v2.46
    Process Start Time: Sat Oct  4 22:03:00 EDT 2014
             Host Name: batevent1
   Current Working Dir: /local/data/batevent/batevent_reproc/trigger602604
======================================================================

  Trigger: 00602604      Segment: 000

  BAT Trigger Time: 425435593.984   [s; MET]
      Trigger Stop: 425435602.176   [s; MET]
               UTC: 2014-06-26T00:33:01.797720    [includes UTCF correction]
       Where From?: TDRSS position message

  BAT
    RA: 77.3504863959002   Dec: -82.6298888891504  [deg; J2000]

     Catalogged Source?: NO
     Point Source?:      YES
     GRB Indicated?:     YES    [ by BAT flight software ]
     Image S/N Ratio:    11.59
     Image Trigger?:     NO
     Rate S/N Ratio:     15.9687194226713  [ if not an image trigger ]
     Image S/N Ratio:    11.59

  Analysis Position:   [ source = BAT ]
    RA: 77.3504863959002   Dec: -82.6298888891504  [deg; J2000]

  Refined Position:   [ source = BAT pre-slew burst ]
    RA: 77.1620136909233   Dec: -82.6236753841851  [deg; J2000]
        { 05h 08m 38.9s , -82d 37' 25.2" }
         +/- 1.50289262898903 [arcmin] (estimated 90% radius based on SNR)
         +/- 0.520444879200264 [arcmin] (formal 1-sigma fit error)
    SNR: 16.9966824039363

  Angular difference between the analysis and refined position is 1.498346 arcmin

  Partial Coding Fraction: 1.015625    [ including projection effects ]

  Duration
     T90: 16.1599999666214 +/- 1.23416207233031
        Measured from: -7.87200003862381
                   to: 8.28799992799759     [s; relative to TRIGTIME]
     T50: 8.99199992418289 +/- 2.40738281438328
        Measured from: -3.22000002861023
                   to: 5.77199989557266     [s; relative to TRIGTIME]


  Fluence
     Peak Flux  (peak 1 second)
        Measured from: 5.68399995565414
                   to: 6.68399995565414     [s; relative to TRIGTIME]
     Total Fluence
        Measured from: -8.46000003814697
                   to: 9.08399999141693     [s; relative to TRIGTIME]

             Band 1     Band 2     Band 3     Band 4
              15-25      25-50     50-100    100-350     keV
 Total     0.245107   0.321828   0.150311   0.030122
           0.024086   0.024707   0.021295   0.018850 [error]
 Peak      0.025760   0.032175   0.018566   0.008031
           0.006015   0.006278   0.005232   0.004644 [error]

     [ fluence units of on-axis counts / fully illuminated detector ]

======================================================================


====== Table of the duration information =============================

        Value   tstart    tstop
T100   17.544   -8.460    9.084
T90    16.160   -7.872    8.288
T50     8.992   -3.220    5.772
Peak    1.000    5.684    6.684


====== Spectral Analysis Summary =====================================

Model      : spectral model: simple power-law (PL) and cutoff power-law (CPL)
Ph_index   : photon index: E^{Ph_index}
Ph_90err   : 90% error of the photon index
Epeak      : Epeak in keV
Epeak_90err: 90% error of Epeak
Norm       : normalization at 50 keV in both the PL model and CPL model
Nomr_90err : 90% error of the normalization
chi2       : Chi-Squared
dof        : degree of freedo

=== Time-averaged spectral analysis ===
(Best model with acceptable fit: PL)

Model Ph_index Ph_90err_low Ph_90err_hi  Epeak  Epeak_90err_low  Epeak_90err_hi  Norm       Nomr_90err_low    Norm_90err_hi    chi2    dof
PL      -1.893    -0.176      0.168       -           -               -         2.46e-03     -2.88e-04          2.83e-04      55.770   57
CPL     -0.617    -0.797      0.951       45.667      -7.527        12.859      1.31e-02     -1.31e-02          3.25e-02      47.640   56


=== 1-s peak spectral analysis ===
(Best model with acceptable fit: PL)

Model Ph_index Ph_90err_low Ph_90err_hi  Epeak  Epeak_90err_low  Epeak_90err_hi  Norm       Nomr_90err_low    Norm_90err_hi    chi2    dof
PL      -1.830     -0.412     0.372       -           -               -         4.72e-03     -1.27e-03          1.21e-03      55.850   57
CPL     -1.473     -0.736     1.887       63.729     -63.605       -63.729      7.56e-03     -7.56e-03          8.52e-02      55.670   56


=== Fluence/Peak Flux Summary ===

              Model    Band1     Band2     Band3     Band4     Band5     Total
                       15-25     25-50    50-100    100-350    15-150    15-350    keV
Fluence         PL   7.96e-08  1.15e-07  1.24e-07  2.49e-07  3.96e-07  5.68e-07   erg/cm2
      90%_error_low -1.05e-08 -1.10e-08 -1.95e-08 -6.96e-08 -4.53e-08 -9.27e-08   erg/cm2
      90%_error_hi   1.08e-08  1.10e-08  1.98e-08  8.56e-08  4.62e-08  1.05e-07   erg/cm2
Peak flux       PL   2.67e-01  2.21e-01  1.25e-01  1.04e-01  6.59e-01  7.17e-01   ph/cm2/s
      90%_error_low -7.90e-02 -4.70e-02 -4.22e-02 -5.48e-02 -1.40e-01 -1.56e-01   ph/cm2/s
      90%_error_hi   8.28e-02  4.70e-02  4.28e-02  8.16e-02  1.40e-01  1.58e-01   ph/cm2/s

Fluence        CPL   7.06e-08  1.33e-07  1.18e-07  4.26e-08  3.53e-07  3.64e-07   erg/cm2
      90%_error_low -1.24e-08 -1.53e-08 -2.42e-08 -2.74e-08 -4.58e-08 -5.36e-08   erg/cm2
      90%_error_hi   1.24e-08  1.57e-08  2.35e-08  7.26e-08  4.99e-08  8.44e-08   erg/cm2
Peak flux      CPL   2.59e-01  2.32e-01  1.25e-01  6.28e-02  6.52e-01  6.79e-01   ph/cm2/s
      90%_error_low -8.99e-02 -5.53e-02 -4.68e-02 -6.28e-02 -1.42e-01     N/A     ph/cm2/s
      90%_error_hi   8.88e-02  6.64e-02  4.59e-02  6.31e-02  1.42e-01     N/A     ph/cm2/s

======================================================================
Image
Pre-slew 15.0-350.0 keV image (Event data)
#   RAcent    DECcent   POSerr    Theta     Phi              Peak Cts       SNR   Name
   77.1620   -82.6237   0.0112    13.5753    -9.1241         0.8102696     16.997 TRIG_00602604

Foreground time interval of the image:
 -8.460   9.084 (delta_t =  17.544 [sec])
Background time interval of the image:
-239.984  -8.460 (delta_t = 231.524 [sec])
Light Curves
Note: The mask-weighted lightcurves have units of either count/det or counts/sec/det, where a det is 0.4 x 0.4 = 0.16 sq cm.
Full-time range; 1 s binning
Other quick-look light curves:
- 64 ms binning (zoomed)
- 16 ms binning (zoomed)
- 8 ms binning (zoomed)
- 2 ms binning (zoomed)
- SN=5 or 10 s binning (full-time range)
- Raw light curve
Spectra
- 64 ms binning (zoomed)
- 16 ms binning (zoomed)
- 8 ms binning (zoomed)
- 2 ms binning (zoomed)
- SN=5 or 10 s binning (full-time range)
- Raw light curve
Spectra
Notes:
- 1) The fitting includes the systematic errors.
- 2) When the burst includes telescope slew time periods, the fitting uses an average response file made from multiple 5-s response files through out the slew time plus single time preiod for the non-slew times, and weighted by the total counts in the corresponding time period using addrmf. An average response file is needed becuase a spectral fit using the pre-slew DRM will introduce some errors in both a spectral shape and a normalization if the PHA file contains a lot of the slew/post-slew time interval.
- 3) For fits to more complicated models (e.g. a power-law over a cutoff power-law), the BAT team has decided to require a chi-square improvement of more than 6 for each extra dof.
Time averaged spectrum fit using the average DRM
Power-law model
Time interval is from   -8.460 sec. to    9.084 sec.

Spectral model in power-law:
------------------------------------------------------------
Parameters  : value       lower 90%   higher 90%
Photon index: -1.89254     ( -0.17557   0.167795 )
Norm@50keV  : 2.45608E-03    ( -0.000287754   0.000283001 )
------------------------------------------------------------
#Fit statistic : Chi-Squared =          55.77 using 59 PHA bins.
# Reduced chi-squared =         0.9784 for     57 degrees of freedom
# Null hypothesis probability =   5.214297e-01

Photon flux (15-150 keV)    in 17.54 sec: 0.351384 ( -0.033391  0.033397 ) ph/cm2/s
Energy fluence (15-150 keV)             : 3.96113e-07 ( -4.53128e-08  4.62204e-08 ) ergs/cm2
Cutoff power-law model
Time interval is from   -8.460 sec. to    9.084 sec.
Spectral model in the cutoff power-law:
------------------------------------------------------------
Parameters  : value       lower 90%   higher 90%
Photon index: -0.617218     ( -0.797244   0.950894 )
Epeak [keV] : 45.6669      ( -7.52718 12.8594 )
Norm@50keV  : 1.31175E-02    ( -0.0131175   0.0324608 )
------------------------------------------------------------
#Fit statistic : Chi-Squared =          47.64 using 59 PHA bins.
# Reduced chi-squared =         0.8508 for     56 degrees of freedom
# Null hypothesis probability =   7.790281e-01

Photon flux (15-150 keV)    in 17.54 sec: 0.335548 ( -0.034351  0.034489 ) ph/cm2/s
Energy fluence (15-150 keV)             : 3.5311e-07 ( -4.58475e-08  4.98571e-08 ) ergs/cm2
1-s peak spectrum fit
Power-law model
Time interval is from    5.684 sec. to    6.684 sec.

Spectral model in power-law:
------------------------------------------------------------
Parameters  : value       lower 90%   higher 90%
Photon index: -1.82984     ( -0.412039   0.371696 )
Norm@50keV  : 4.72449E-03    ( -0.00126582   0.00120564 )
------------------------------------------------------------
#Fit statistic : Chi-Squared =          55.85 using 59 PHA bins.
# Reduced chi-squared =         0.9797 for     57 degrees of freedom
# Null hypothesis probability =   5.184696e-01

Photon flux (15-150 keV)    in 1 sec: 0.658746 ( -0.139789  0.139789 ) ph/cm2/s
Energy fluence (15-150 keV)             : 4.3463e-08 ( -1.12886e-08  1.17066e-08 ) ergs/cm2
Cutoff power-law model

Time interval is from    5.684 sec. to    6.684 sec.
Spectral model in the cutoff power-law:
------------------------------------------------------------
Parameters  : value       lower 90%   higher 90%
Photon index: -1.47334     ( -0.735541   1.88732 )
Epeak [keV] : 63.7290      ( -63.6044 -63.7288 )
Norm@50keV  : 7.56181E-03    ( -0.00756185   0.0851739 )
------------------------------------------------------------
#Fit statistic : Chi-Squared =          55.67 using 59 PHA bins.
# Reduced chi-squared =         0.9942 for     56 degrees of freedom
# Null hypothesis probability =   4.871498e-01

Photon flux (15-150 keV)    in 1 sec: 0.652500 ( -0.14198  0.142019 ) ph/cm2/s
Energy fluence (15-150 keV)             : 4.19943e-08 ( -1.21728e-08  1.07724e-08 ) ergs/cm2
Time-resolved spectra
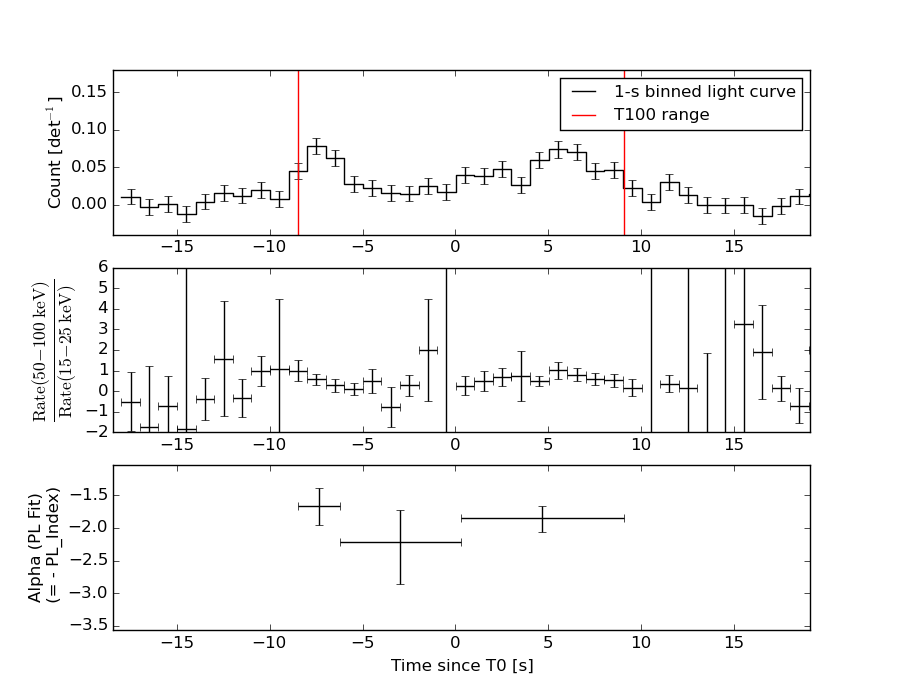
Distribution
T90 vs. Hardness ratio plot
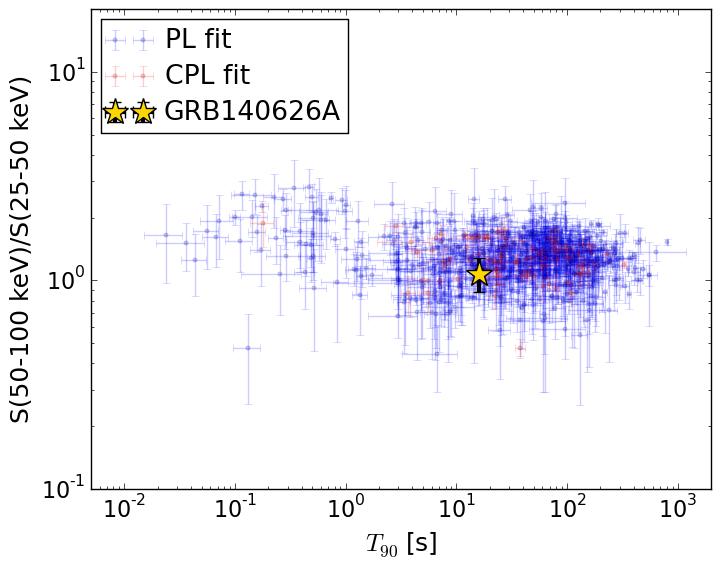
T90                                   = 16.16 sec.
Hardness ratio (energy fluence ratio) = 1.07740738781
S(15-50 keV) vs. S(50-150 keV) plot
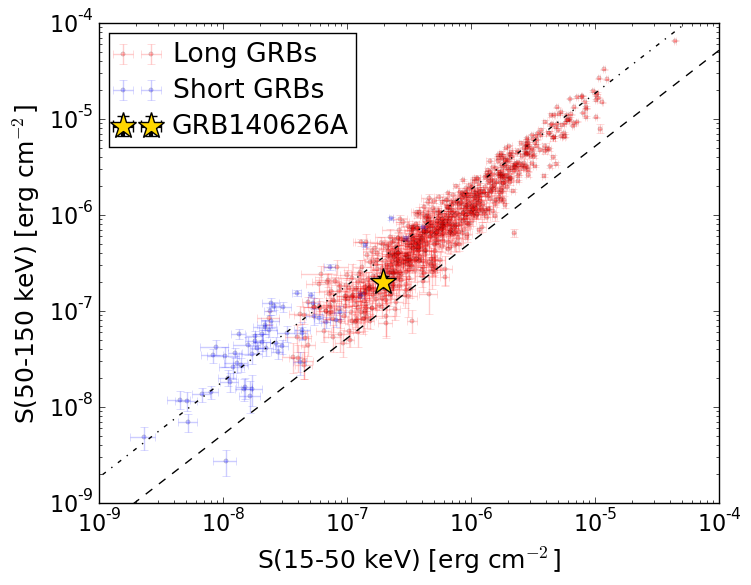
S(15-50 keV)  = 1.9488426e-07
S(50-150 keV) = 2.0123811e-07
The dash-dotted line and the dashed line traces the fluences calculated from the Band function with Epeak = 15 and 150 keV, respectively. Both lines assume a canonical values of alpha = -1 and beta = -2.5.
Mask shadow pattern
IMX = 2.384144820168048E-01, IMY = 3.829060910223910E-02
Spacecraft aspect plot
Bright source in the pre-burst/pre-slew/post-slew images
Pre-burst image of 15-350 keV band
Time interval of the image:
-239.984000 -8.460000

# RAcent  DECcent POSerr Theta    Phi  PeakCts   SNR AngSep     Name
#  [deg]    [deg]    ['] [deg]  [deg]                   [']
170.4324 -60.7942    0.0  44.0   -4.2   0.5226   1.6   10.8	Cen X-3
186.5085 -62.9151    3.6  43.1    7.1   1.0143   3.2    9.6	GX 301-2
328.9629 -84.1305    3.3  13.7   37.7   0.6701   3.5 ------	UNKNOWN
177.4262 -50.1501    2.9  55.1   -1.6   2.5945   3.9 ------	UNKNOWN
 25.0685 -14.8405   13.7  58.8 -159.3   1.3490   0.8 ------	UNKNOWN
Pre-slew background subtracted image of 15-350 keV band
Time interval of the image:
-8.460000 9.084000

# RAcent  DECcent POSerr Theta    Phi  PeakCts   SNR AngSep     Name
#  [deg]    [deg]    ['] [deg]  [deg]                   [']
170.2455 -60.5871    9.8  44.1   -4.4  -0.0971  -1.2    3.0	Cen X-3
186.8997 -62.7859    6.1  43.3    7.4  -0.1626  -1.9    6.7	GX 301-2
324.1964 -43.3592    2.4  39.9  123.4   0.7041   4.7 ------	UNKNOWN
348.6538 -36.4605    2.1  40.6  154.4   0.5319   5.7 ------	UNKNOWN
 77.1620 -82.6237    0.7  13.6   -9.1   0.8103  17.0 ------	UNKNOWN
149.8328 -52.1494    2.3  49.4  -22.3   0.5323   5.1 ------	UNKNOWN
Post-slew image of 15-350 keV band
Time interval of the image:
84.116600 962.153500

# RAcent  DECcent POSerr Theta    Phi  PeakCts   SNR AngSep     Name
#  [deg]    [deg]    ['] [deg]  [deg]                   [']
135.5363 -40.5444    2.7  45.9  -42.4   7.1643   4.2    0.7	Vela X-1
170.2188 -60.6553    3.3  30.5   -0.9   2.4305   3.5    3.4	Cen X-3
186.6210 -62.7083    5.3  30.5   14.9   1.4849   2.2    3.8	GX 301-2
210.5788 -44.2018    3.0  51.1   31.4  14.0461   3.8 ------	UNKNOWN
202.8947 -61.7611    2.8  33.0   28.6   3.2041   4.1 ------	UNKNOWN
173.5079 -45.1136    2.8  46.1   -3.1   4.0640   4.1 ------	UNKNOWN
 27.7086 -26.6513    4.4  58.7 -159.3  13.8707   2.6 ------	UNKNOWN