Analysis Summary
Notes:
- 1) No attempt has been made to eliminate the non-significant decimal places.
- 2) This batgrbproduct analysis is done using the HEASARC data.
- 3) This batgrbproduct analysis is using the flight position for the mask-weighting calculation.
======================================================================
BAT GRB EVENT DATA PROCESSING REPORT
Process Script Ver: batgrbproduct v2.46
Process Start Time: Sat Oct 4 21:59:07 EDT 2014
Host Name: batevent1
Current Working Dir: /local/data/batevent/batevent_reproc/trigger602803
======================================================================
Trigger: 00602803 Segment: 000
BAT Trigger Time: 425655349.568 [s; MET]
Trigger Stop: 425655350.08 [s; MET]
UTC: 2014-06-28T13:35:37.371060 [includes UTCF correction]
Where From?: TDRSS position message
BAT
RA: 40.6610673055839 Dec: -0.366404468200361 [deg; J2000]
Catalogged Source?: NO
Point Source?: YES
GRB Indicated?: YES [ by BAT flight software ]
Image S/N Ratio: 9.01
Image Trigger?: NO
Rate S/N Ratio: 17.0880074906351 [ if not an image trigger ]
Image S/N Ratio: 9.01
Analysis Position: [ source = BAT ]
RA: 40.6610673055839 Dec: -0.366404468200361 [deg; J2000]
Refined Position: [ source = BAT pre-slew burst ]
RA: 40.6699823981067 Dec: -0.378926012908259 [deg; J2000]
{ 02h 42m 40.8s , -00d 22' 44.1" }
+/- 0.95685680221616 [arcmin] (estimated 90% radius based on SNR)
+/- 0.320143748950345 [arcmin] (formal 1-sigma fit error)
SNR: 32.395141556453
Angular difference between the analysis and refined position is 0.922254 arcmin
Partial Coding Fraction: 0.734375 [ including projection effects ]
Duration
T90: 10.539999961853 +/- 0.873768858932836
Measured from: -0.364000022411346
to: 10.1759999394417 [s; relative to TRIGTIME]
T50: 4.93199992179871 +/- 0.616116891997613
Measured from: 1.26399999856949
to: 6.19599992036819 [s; relative to TRIGTIME]
Fluence
Peak Flux (peak 1 second)
Measured from: 0.944000005722046
to: 1.94400000572205 [s; relative to TRIGTIME]
Total Fluence
Measured from: -1.24000000953674
to: 11.1159999966621 [s; relative to TRIGTIME]
Band 1 Band 2 Band 3 Band 4
15-25 25-50 50-100 100-350 keV
Total 0.573056 0.826016 0.600934 0.111912
0.029662 0.032887 0.031437 0.032799 [error]
Peak 0.071550 0.128438 0.117457 0.027142
0.008949 0.010282 0.009828 0.009398 [error]
[ fluence units of on-axis counts / fully illuminated detector ]
======================================================================
====== Table of the duration information =============================
Value tstart tstop
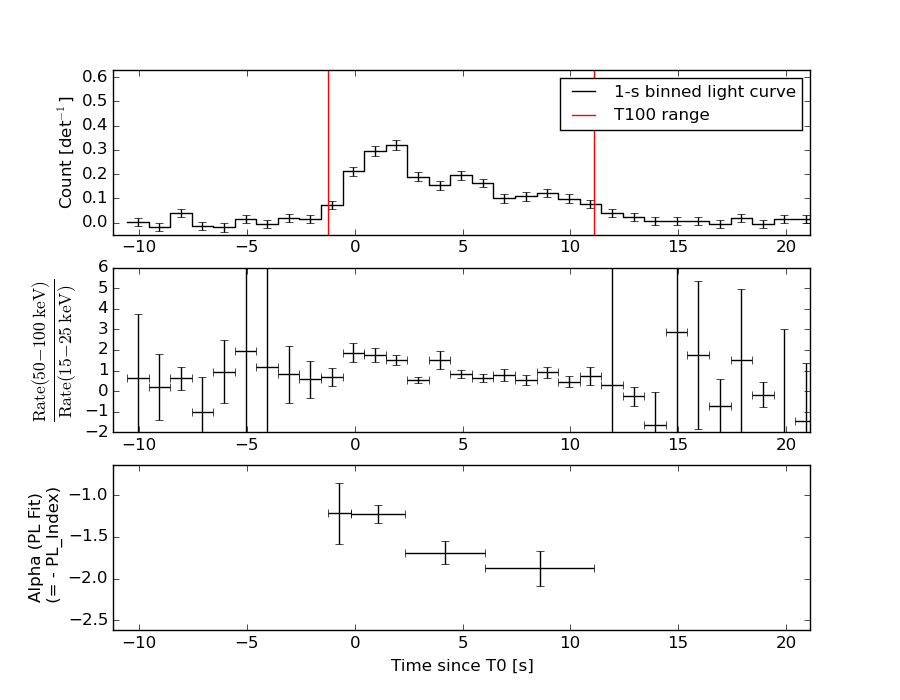
T100 12.356 -1.240 11.116
T90 10.540 -0.364 10.176
T50 4.932 1.264 6.196
Peak 1.000 0.944 1.944
====== Spectral Analysis Summary =====================================
Model : spectral model: simple power-law (PL) and cutoff power-law (CPL)
Ph_index : photon index: E^{Ph_index}
Ph_90err : 90% error of the photon index
Epeak : Epeak in keV
Epeak_90err: 90% error of Epeak
Norm : normalization at 50 keV in both the PL model and CPL model
Nomr_90err : 90% error of the normalization
chi2 : Chi-Squared
dof : degree of freedo
=== Time-averaged spectral analysis ===
(Best model with acceptable fit: PL)
Model Ph_index Ph_90err_low Ph_90err_hi Epeak Epeak_90err_low Epeak_90err_hi Norm Nomr_90err_low Norm_90err_hi chi2 dof
PL -1.556 -0.089 0.088 - - - 1.14e-02 -5.78e-04 5.75e-04 48.390 57
CPL -1.147 -0.356 0.390 100.068 -27.837 284.552 1.86e-02 -6.31e-03 1.08e-02 44.500 56
=== 1-s peak spectral analysis ===
(Best model with acceptable fit: CPL)
Model Ph_index Ph_90err_low Ph_90err_hi Epeak Epeak_90err_low Epeak_90err_hi Norm Nomr_90err_low Norm_90err_hi chi2 dof
PL -1.234 -0.141 0.142 - - - 2.36e-02 -2.06e-03 2.05e-03 59.680 57
CPL 0.154 -0.716 0.860 79.390 -13.420 31.910 1.14e-01 -6.21e-02 1.77e-01 47.070 56
=== Fluence/Peak Flux Summary ===
Model Band1 Band2 Band3 Band4 Band5 Total
15-25 25-50 50-100 100-350 15-150 15-350 keV
Fluence PL 1.90e-07 3.38e-07 4.59e-07 1.29e-06 1.33e-06 2.28e-06 erg/cm2
90%_error_low -1.55e-08 -1.68e-08 -3.12e-08 -1.79e-07 -7.36e-08 -2.05e-07 erg/cm2
90%_error_hi 1.59e-08 1.67e-08 3.12e-08 1.98e-07 7.42e-08 2.21e-07 erg/cm2
Peak flux PL 7.54e-01 8.89e-01 7.56e-01 1.09e+00 2.79e+00 3.49e+00 ph/cm2/s
90%_error_low -1.12e-01 -8.55e-02 -7.83e-02 -2.14e-01 -2.44e-01 -3.22e-01 ph/cm2/s
90%_error_hi 1.17e-01 8.49e-02 7.79e-02 2.44e-01 2.44e-01 3.27e-01 ph/cm2/s
Fluence CPL 1.78e-07 3.52e-07 4.65e-07 6.78e-07 1.28e-06 1.67e-06 erg/cm2
90%_error_low -1.84e-08 -2.07e-08 -3.31e-08 -2.72e-07 -8.71e-08 -2.85e-07 erg/cm2
90%_error_hi 1.87e-08 2.11e-08 3.33e-08 4.98e-07 8.73e-08 5.00e-07 erg/cm2
Peak flux CPL 5.73e-01 9.93e-01 8.40e-01 3.23e-01 2.64e+00 2.73e+00 ph/cm2/s
90%_error_low -1.38e-01 -1.06e-01 -9.48e-02 -1.42e-01 -2.56e-01 -2.95e-01 ph/cm2/s
90%_error_hi 1.44e-01 1.08e-01 9.64e-02 2.43e-01 2.55e-01 3.34e-01 ph/cm2/s
======================================================================
Image
Pre-slew 15.0-350.0 keV image (Event data)
#   RAcent    DECcent   POSerr    Theta     Phi              Peak Cts       SNR   Name
   40.6700    -0.3789   0.0059    30.1014   170.3466         2.1455205     32.395 TRIG_00602803

Foreground time interval of the image:
 -1.240   9.933 (delta_t =  11.173 [sec])
Background time interval of the image:
-119.568  -1.240 (delta_t = 118.328 [sec])
Light Curves
Note: The mask-weighted lightcurves have units of either count/det or counts/sec/det, where a det is 0.4 x 0.4 = 0.16 sq cm.
Full-time range; 1 s binning
Other quick-look light curves:
- 64 ms binning (zoomed)
- 16 ms binning (zoomed)
- 8 ms binning (zoomed)
- 2 ms binning (zoomed)
- SN=5 or 10 s binning (full-time range)
- Raw light curve
Spectra
- 64 ms binning (zoomed)
- 16 ms binning (zoomed)
- 8 ms binning (zoomed)
- 2 ms binning (zoomed)
- SN=5 or 10 s binning (full-time range)
- Raw light curve
Spectra
Notes:
- 1) The fitting includes the systematic errors.
- 2) When the burst includes telescope slew time periods, the fitting uses an average response file made from multiple 5-s response files through out the slew time plus single time preiod for the non-slew times, and weighted by the total counts in the corresponding time period using addrmf. An average response file is needed becuase a spectral fit using the pre-slew DRM will introduce some errors in both a spectral shape and a normalization if the PHA file contains a lot of the slew/post-slew time interval.
- 3) For fits to more complicated models (e.g. a power-law over a cutoff power-law), the BAT team has decided to require a chi-square improvement of more than 6 for each extra dof.
Time averaged spectrum fit using the average DRM
Power-law model
Time interval is from   -1.240 sec. to   11.116 sec.

Spectral model in power-law:
------------------------------------------------------------
Parameters  : value       lower 90%   higher 90%
Photon index: -1.55602     ( -0.0889895   0.088314 )
Norm@50keV  : 1.14325E-02    ( -0.000577842   0.000575419 )
------------------------------------------------------------
#Fit statistic : Chi-Squared =          48.39 using 59 PHA bins.
# Reduced chi-squared =         0.8489 for     57 degrees of freedom
# Null hypothesis probability =   7.846148e-01

Photon flux (15-150 keV)    in 12.36 sec: 1.44986 ( -0.07081  0.07087 ) ph/cm2/s
Energy fluence (15-150 keV)             : 1.32932e-06 ( -7.36106e-08  7.42015e-08 ) ergs/cm2
Cutoff power-law model
Time interval is from   -1.240 sec. to   11.116 sec.
Spectral model in the cutoff power-law:
------------------------------------------------------------
Parameters  : value       lower 90%   higher 90%
Photon index: -1.14717     ( -0.356064   0.389692 )
Epeak [keV] : 100.068      ( -27.8379 284.551 )
Norm@50keV  : 1.86173E-02    ( -0.0063082   0.010788 )
------------------------------------------------------------
#Fit statistic : Chi-Squared =          44.50 using 59 PHA bins.
# Reduced chi-squared =         0.7947 for     56 degrees of freedom
# Null hypothesis probability =   8.657930e-01

Photon flux (15-150 keV)    in 12.36 sec: 1.41667 ( -0.07632  0.07626 ) ph/cm2/s
Energy fluence (15-150 keV)             : 1.2754e-06 ( -8.70972e-08  8.72908e-08 ) ergs/cm2
1-s peak spectrum fit
Power-law model
Time interval is from    0.944 sec. to    1.944 sec.

Spectral model in power-law:
------------------------------------------------------------
Parameters  : value       lower 90%   higher 90%
Photon index: -1.234     ( -0.141403   0.141705 )
Norm@50keV  : 2.36362E-02    ( -0.00205498   0.00205325 )
------------------------------------------------------------
#Fit statistic : Chi-Squared =          59.68 using 59 PHA bins.
# Reduced chi-squared =          1.047 for     57 degrees of freedom
# Null hypothesis probability =   3.786134e-01

Photon flux (15-150 keV)    in 1 sec: 2.78844 ( -0.2436  0.24379 ) ph/cm2/s
Energy fluence (15-150 keV)             : 2.37586e-07 ( -2.32229e-08  2.34618e-08 ) ergs/cm2
Cutoff power-law model
Time interval is from    0.944 sec. to    1.944 sec.
Spectral model in the cutoff power-law:
------------------------------------------------------------
Parameters  : value       lower 90%   higher 90%
Photon index: 0.154358     ( -0.71641   0.859718 )
Epeak [keV] : 79.3900      ( -13.4203 31.9103 )
Norm@50keV  : 0.113617    ( -0.0620511   0.176578 )
------------------------------------------------------------
#Fit statistic : Chi-Squared =          47.07 using 59 PHA bins.
# Reduced chi-squared =         0.8405 for     56 degrees of freedom
# Null hypothesis probability =   7.966457e-01

Photon flux (15-150 keV)    in 1 sec: 2.64133 ( -0.25557  0.2552 ) ph/cm2/s
Energy fluence (15-150 keV)             : 2.15283e-07 ( -2.51927e-08  2.58963e-08 ) ergs/cm2
Time-resolved spectra
Distribution
T90 vs. Hardness ratio plot
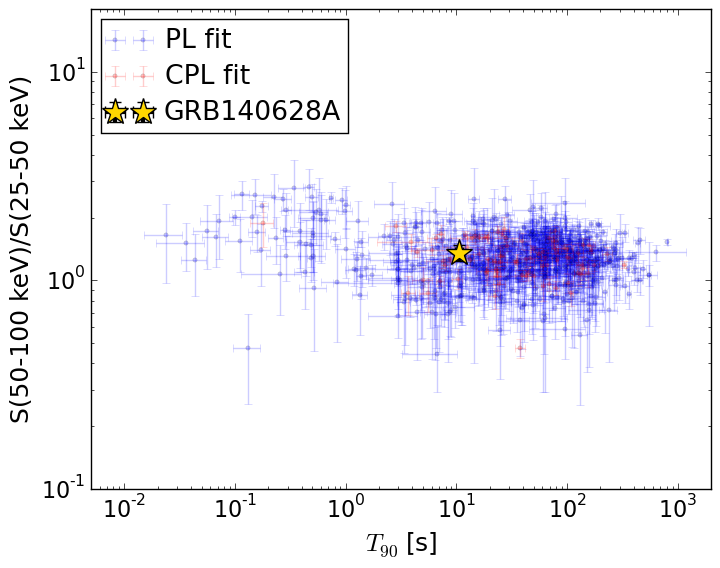
T90                                   = 10.54 sec.
Hardness ratio (energy fluence ratio) = 1.36037949895
S(15-50 keV) vs. S(50-150 keV) plot
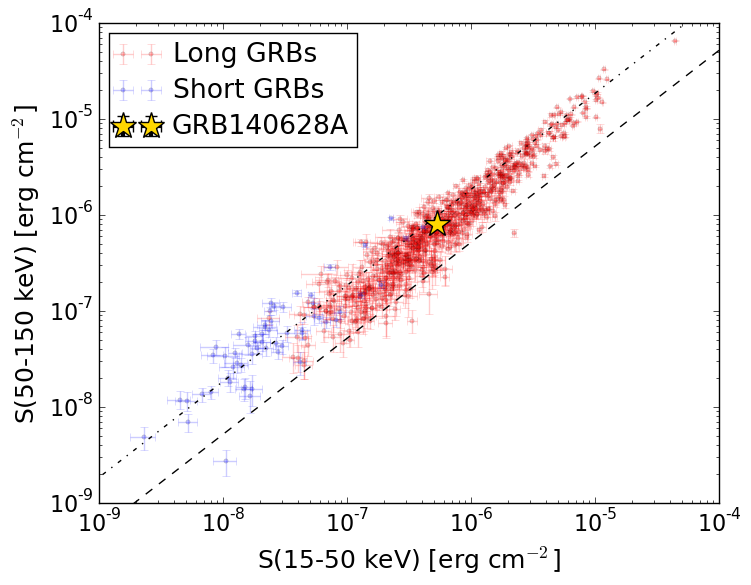
S(15-50 keV)  = 5.278707e-07
S(50-150 keV) = 8.014542e-07
The dash-dotted line and the dashed line traces the fluences calculated from the Band function with Epeak = 15 and 150 keV, respectively. Both lines assume a canonical values of alpha = -1 and beta = -2.5.
Mask shadow pattern
IMX = -5.715028141719019E-01, IMY = -9.721046641122040E-02
Spacecraft aspect plot
Bright source in the pre-burst/pre-slew/post-slew images
Pre-burst image of 15-350 keV band
Time interval of the image:
-119.568000 -1.240000

# RAcent  DECcent POSerr Theta    Phi  PeakCts   SNR AngSep     Name
#  [deg]    [deg]    ['] [deg]  [deg]                   [']
 83.6482  21.9283    2.9  40.3 -102.5   3.1947   4.0    5.2	Crab
102.3511 -59.1260    2.5  51.1   31.4   4.4999   4.6 ------	UNKNOWN
112.6510  -1.2367    2.6  46.8  -49.1   3.8537   4.4 ------	UNKNOWN
Pre-slew background subtracted image of 15-350 keV band
Time interval of the image:
-1.240000 9.932590

# RAcent  DECcent POSerr Theta    Phi  PeakCts   SNR AngSep     Name
#  [deg]    [deg]    ['] [deg]  [deg]                   [']
 83.6458  21.9864    5.3  40.3 -102.6   0.4499   2.2    1.8	Crab
 65.7678 -47.0971    2.2  32.1   55.6   0.4777   5.2 ------	UNKNOWN
 40.6700  -0.3789    0.4  30.1  170.3   2.1455  32.4 ------	UNKNOWN
Post-slew image of 15-350 keV band
Time interval of the image:
66.532600 327.532590

# RAcent  DECcent POSerr Theta    Phi  PeakCts   SNR AngSep     Name
#  [deg]    [deg]    ['] [deg]  [deg]                   [']
 48.6106 -42.8074    2.4  43.0   19.0   2.3994   4.8 ------	UNKNOWN
  3.6074  36.5215    2.0  50.4  168.7   5.0595   5.9 ------	UNKNOWN
 45.8192 -19.7464    2.3  20.0   13.2   1.3002   4.9 ------	UNKNOWN
 43.9640   5.3956    2.5   6.7 -122.7   1.1450   4.6 ------	UNKNOWN
 76.7819  -5.7507    2.8  36.5  -53.2   1.7120   4.1 ------	UNKNOWN
 92.7328 -30.1708    3.5  57.7  -26.2   5.3321   3.3 ------	UNKNOWN
 50.6637  54.1911    3.7  55.2 -145.3   5.1667   3.2 ------	UNKNOWN