Analysis Summary
Notes:
- 1) No attempt has been made to eliminate the non-significant decimal places.
- 2) This batgrbproduct analysis is done using the HEASARC data.
- 3) This batgrbproduct analysis is using the flight position for the mask-weighting calculation.
======================================================================
BAT GRB EVENT DATA PROCESSING REPORT
Process Script Ver: batgrbproduct v2.46
Process Start Time: Sat Oct 4 21:54:20 EDT 2014
Host Name: batevent1
Current Working Dir: /local/data/batevent/batevent_reproc/trigger602884
======================================================================
Trigger: 00602884 Segment: 000
BAT Trigger Time: 425744262.528 [s; MET]
Trigger Stop: 425744263.552 [s; MET]
UTC: 2014-06-29T14:17:30.326760 [includes UTCF correction]
Where From?: TDRSS position message
BAT
RA: 248.981975533517 Dec: 41.890321954013 [deg; J2000]
Catalogged Source?: NO
Point Source?: YES
GRB Indicated?: YES [ by BAT flight software ]
Image S/N Ratio: 7.95
Image Trigger?: NO
Rate S/N Ratio: 10.9087121146357 [ if not an image trigger ]
Image S/N Ratio: 7.95
Analysis Position: [ source = BAT ]
RA: 248.981975533517 Dec: 41.890321954013 [deg; J2000]
Refined Position: [ source = BAT pre-slew burst ]
RA: 249.011047035745 Dec: 41.8965474582744 [deg; J2000]
{ 16h 36m 02.7s , +41d 53' 47.6" }
+/- 1.64869398298634 [arcmin] (estimated 90% radius based on SNR)
+/- 0.920466246897388 [arcmin] (formal 1-sigma fit error)
SNR: 14.8908093853219
Angular difference between the analysis and refined position is 1.351089 arcmin
Partial Coding Fraction: 0.4179688 [ including projection effects ]
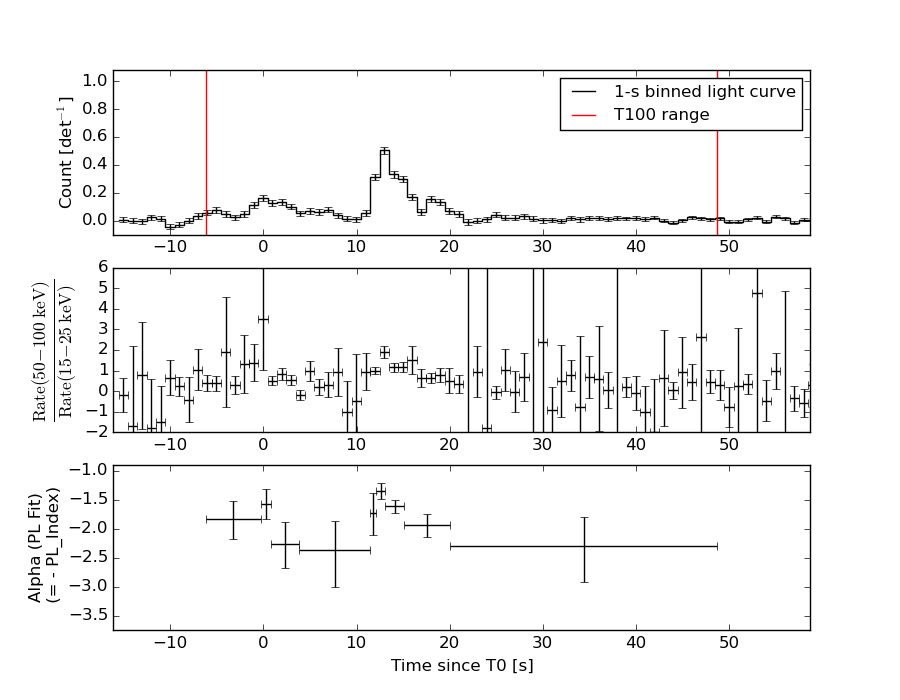
Duration
T90: 38.272000014782 +/- 11.6226537648559
Measured from: -3.6240000128746
to: 34.6480000019073 [s; relative to TRIGTIME]
T50: 11.6480000019073 +/- 2.48531047010479
Measured from: 4.05599999427795
to: 15.7039999961853 [s; relative to TRIGTIME]
Fluence
Peak Flux (peak 1 second)
Measured from: 12.1000000238419
to: 13.1000000238419 [s; relative to TRIGTIME]
Total Fluence
Measured from: -6.18400001525879
to: 48.6639999747276 [s; relative to TRIGTIME]
Band 1 Band 2 Band 3 Band 4
15-25 25-50 50-100 100-350 keV
Total 1.124093 1.507504 0.964569 0.142335
0.073230 0.073160 0.064828 0.058284 [error]
Peak 0.116601 0.170135 0.180420 0.050601
0.012963 0.014235 0.013497 0.010290 [error]
[ fluence units of on-axis counts / fully illuminated detector ]
======================================================================
====== Table of the duration information =============================
Value tstart tstop
T100 54.848 -6.184 48.664
T90 38.272 -3.624 34.648
T50 11.648 4.056 15.704
Peak 1.000 12.100 13.100
====== Spectral Analysis Summary =====================================
Model : spectral model: simple power-law (PL) and cutoff power-law (CPL)
Ph_index : photon index: E^{Ph_index}
Ph_90err : 90% error of the photon index
Epeak : Epeak in keV
Epeak_90err: 90% error of Epeak
Norm : normalization at 50 keV in both the PL model and CPL model
Nomr_90err : 90% error of the normalization
chi2 : Chi-Squared
dof : degree of freedo
=== Time-averaged spectral analysis ===
(Best model with acceptable fit: PL)
Model Ph_index Ph_90err_low Ph_90err_hi Epeak Epeak_90err_low Epeak_90err_hi Norm Nomr_90err_low Norm_90err_hi chi2 dof
PL -1.851 -0.109 0.106 - - - 4.54e-03 -2.93e-04 2.91e-04 42.640 57
CPL -1.334 -0.419 0.463 60.924 -11.996 55.603 8.48e-03 -3.30e-03 6.21e-03 38.090 56
=== 1-s peak spectral analysis ===
(Best model with acceptable fit: PL)
Model Ph_index Ph_90err_low Ph_90err_hi Epeak Epeak_90err_low Epeak_90err_hi Norm Nomr_90err_low Norm_90err_hi chi2 dof
PL -1.355 -0.137 0.137 - - - 3.59e-02 -2.95e-03 2.95e-03 63.020 57
CPL -0.801 -0.545 0.627 120.901 -37.612 1616.769 6.46e-02 -2.79e-02 5.82e-02 60.010 56
=== Fluence/Peak Flux Summary ===
Model Band1 Band2 Band3 Band4 Band5 Total
15-25 25-50 50-100 100-350 15-150 15-350 keV
Fluence PL 4.43e-07 6.57e-07 7.29e-07 1.52e-06 2.29e-06 3.35e-06 erg/cm2
90%_error_low -4.16e-08 -3.91e-08 -6.31e-08 -2.58e-07 -1.48e-07 -3.19e-07 erg/cm2
90%_error_hi 4.27e-08 3.90e-08 6.33e-08 2.91e-07 1.49e-07 3.42e-07 erg/cm2
Peak flux PL 1.28e+00 1.41e+00 1.10e+00 1.42e+00 4.32e+00 5.21e+00 ph/cm2/s
90%_error_low -1.91e-01 -1.34e-01 -1.05e-01 -2.59e-01 -3.73e-01 -4.33e-01 ph/cm2/s
90%_error_hi 2.01e-01 1.33e-01 1.04e-01 2.91e-01 3.74e-01 4.35e-01 ph/cm2/s
Fluence CPL 4.09e-07 6.92e-07 7.39e-07 7.22e-07 2.20e-06 2.56e-06 erg/cm2
90%_error_low -4.92e-08 -4.81e-08 -6.84e-08 -3.07e-07 -1.65e-07 -3.53e-07 erg/cm2
90%_error_hi 4.99e-08 4.91e-08 6.86e-08 5.83e-07 1.66e-07 5.96e-07 erg/cm2
Peak flux CPL 1.13e+00 1.46e+00 1.18e+00 8.69e-01 4.23e+00 4.64e+00 ph/cm2/s
90%_error_low -2.39e-01 -1.49e-01 -1.30e-01 -3.28e-01 -3.85e-01 -5.28e-01 ph/cm2/s
90%_error_hi 2.50e-01 1.51e-01 1.33e-01 5.62e-01 3.85e-01 6.60e-01 ph/cm2/s
======================================================================
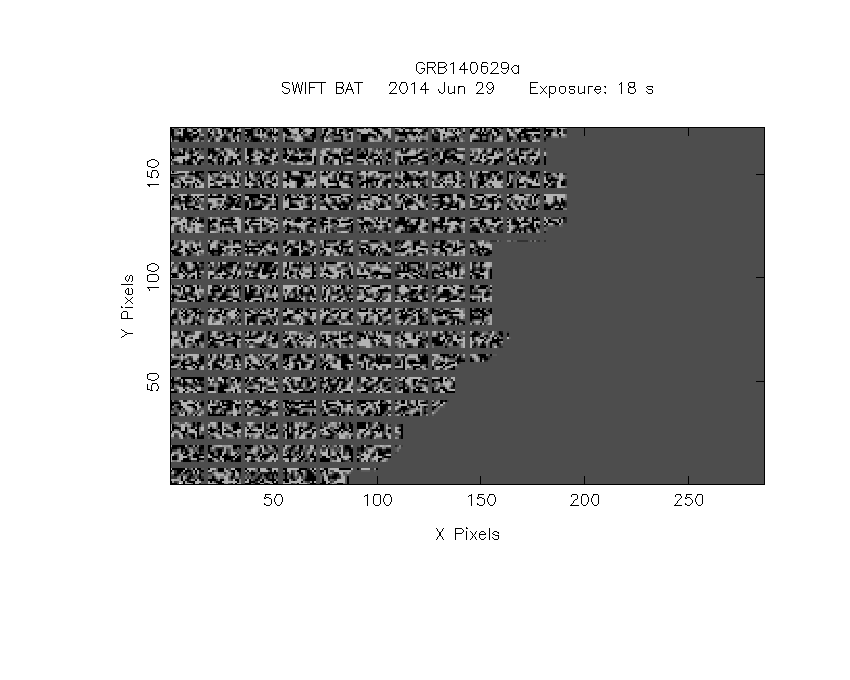
Image
Pre-slew 15.0-350.0 keV image (Event data)
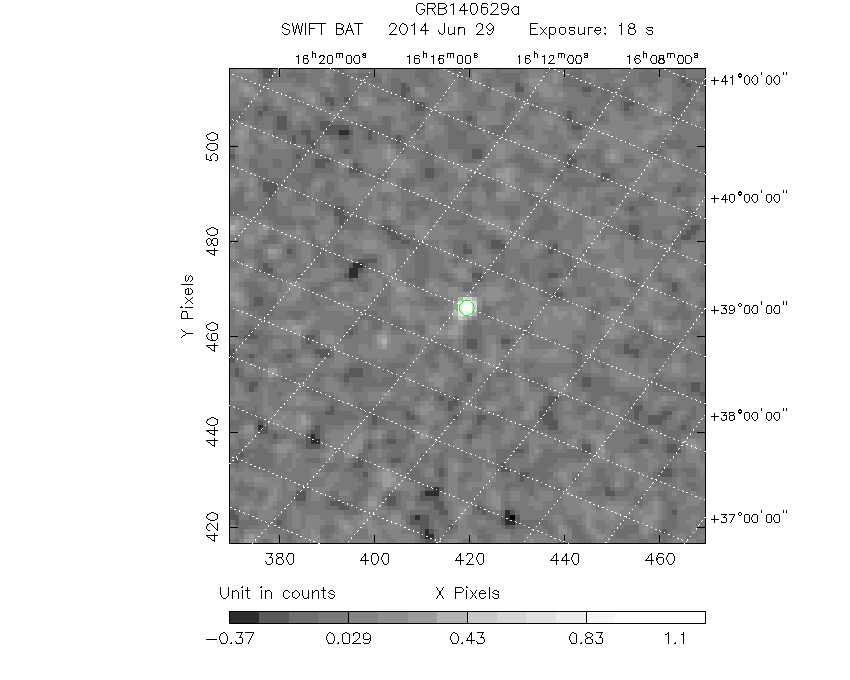
#   RAcent    DECcent   POSerr    Theta     Phi              Peak Cts       SNR   Name
  249.0110    41.8965   0.0129    44.0498     1.3103         1.3477601     14.891 TRIG_00602884

Foreground time interval of the image:
 -6.184  11.573 (delta_t =  17.757 [sec])
Background time interval of the image:
-239.528  -6.184 (delta_t = 233.344 [sec])
Light Curves
Note: The mask-weighted lightcurves have units of either count/det or counts/sec/det, where a det is 0.4 x 0.4 = 0.16 sq cm.
Full-time range; 1 s binning
Other quick-look light curves:
- 64 ms binning (zoomed)
- 16 ms binning (zoomed)
- 8 ms binning (zoomed)
- 2 ms binning (zoomed)
- SN=5 or 10 s binning (full-time range)
- Raw light curve
Spectra
- 64 ms binning (zoomed)
- 16 ms binning (zoomed)
- 8 ms binning (zoomed)
- 2 ms binning (zoomed)
- SN=5 or 10 s binning (full-time range)
- Raw light curve
Spectra
Notes:
- 1) The fitting includes the systematic errors.
- 2) When the burst includes telescope slew time periods, the fitting uses an average response file made from multiple 5-s response files through out the slew time plus single time preiod for the non-slew times, and weighted by the total counts in the corresponding time period using addrmf. An average response file is needed becuase a spectral fit using the pre-slew DRM will introduce some errors in both a spectral shape and a normalization if the PHA file contains a lot of the slew/post-slew time interval.
- 3) For fits to more complicated models (e.g. a power-law over a cutoff power-law), the BAT team has decided to require a chi-square improvement of more than 6 for each extra dof.
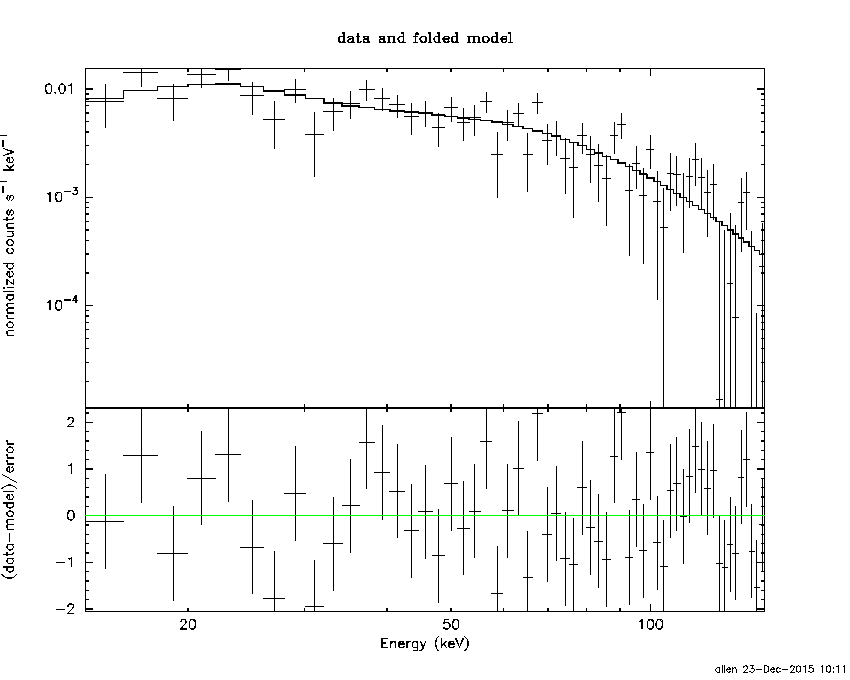
Time averaged spectrum fit using the average DRM
Power-law model
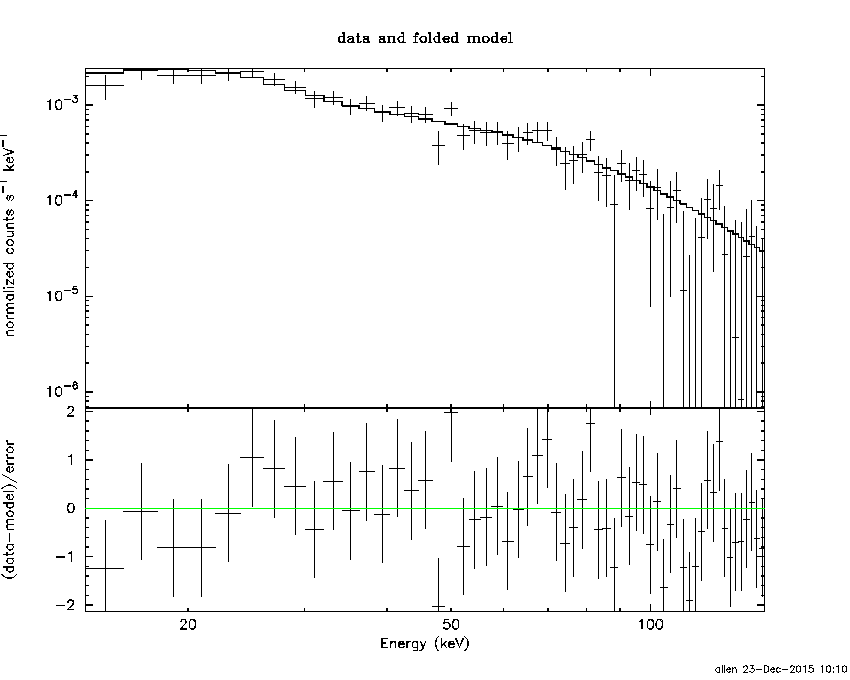
Time interval is from   -6.184 sec. to   48.664 sec.

Spectral model in power-law:
------------------------------------------------------------
Parameters  : value       lower 90%   higher 90%
Photon index: -1.85109     ( -0.108493   0.106442 )
Norm@50keV  : 4.54100E-03    ( -0.00029294   0.000290561 )
------------------------------------------------------------
#Fit statistic : Chi-Squared =          42.64 using 59 PHA bins.
# Reduced chi-squared =         0.7482 for     57 degrees of freedom
# Null hypothesis probability =   9.212672e-01

Photon flux (15-150 keV)    in 54.85 sec: 0.638606 ( -0.038969  0.039051 ) ph/cm2/s
Energy fluence (15-150 keV)             : 2.29054e-06 ( -1.47909e-07  1.48828e-07 ) ergs/cm2
Cutoff power-law model
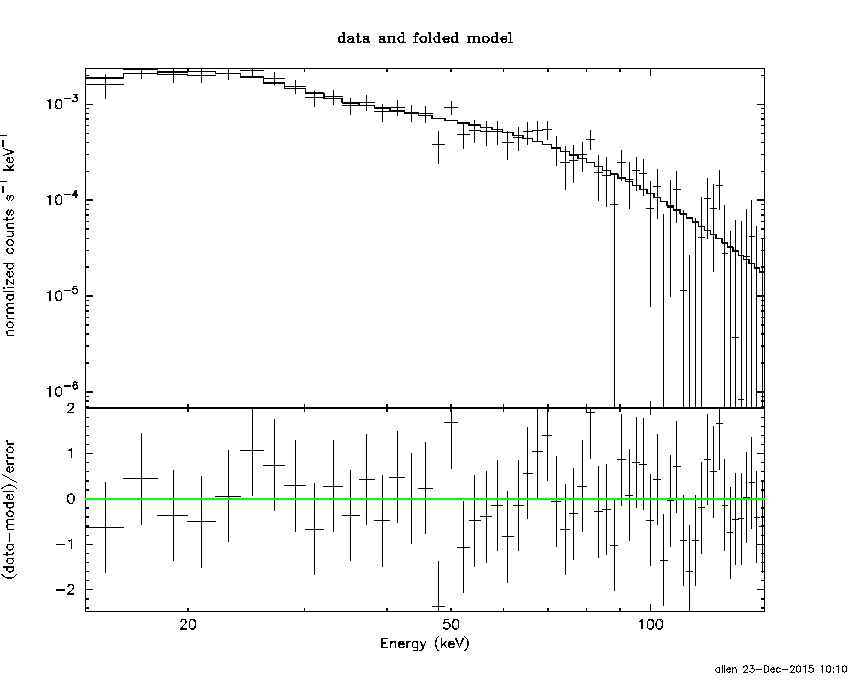
Time interval is from   -6.184 sec. to   48.664 sec.
Spectral model in the cutoff power-law:
------------------------------------------------------------
Parameters  : value       lower 90%   higher 90%
Photon index: -1.33408     ( -0.418865   0.463377 )
Epeak [keV] : 60.9244      ( -11.9961 55.6022 )
Norm@50keV  : 8.47879E-03    ( -0.00329615   0.00620593 )
------------------------------------------------------------
#Fit statistic : Chi-Squared =          38.09 using 59 PHA bins.
# Reduced chi-squared =         0.6801 for     56 degrees of freedom
# Null hypothesis probability =   9.679865e-01

Photon flux (15-150 keV)    in 54.85 sec: 0.621245 ( -0.041278  0.041334 ) ph/cm2/s
Energy fluence (15-150 keV)             : 2.19845e-06 ( -1.64702e-07  1.65656e-07 ) ergs/cm2
1-s peak spectrum fit
Power-law model
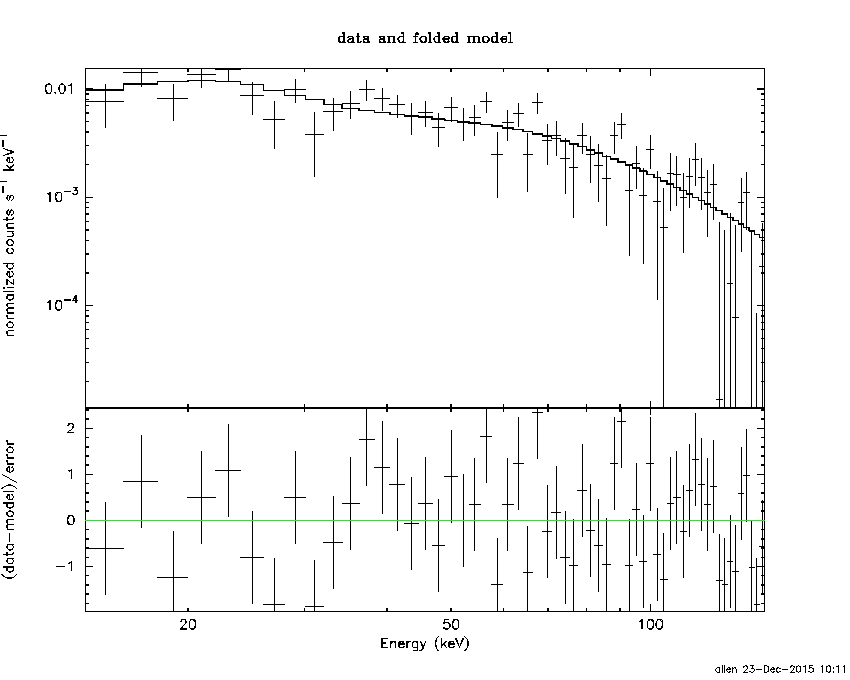
Time interval is from   12.100 sec. to   13.100 sec.

Spectral model in power-law:
------------------------------------------------------------
Parameters  : value       lower 90%   higher 90%
Photon index: -1.35453     ( -0.136876   0.136939 )
Norm@50keV  : 3.58574E-02    ( -0.00294819   0.00294802 )
------------------------------------------------------------
#Fit statistic : Chi-Squared =          63.02 using 59 PHA bins.
# Reduced chi-squared =          1.106 for     57 degrees of freedom
# Null hypothesis probability =   2.720353e-01

Photon flux (15-150 keV)    in 1 sec: 4.32389 ( -0.37325  0.37416 ) ph/cm2/s
Energy fluence (15-150 keV)             : 3.49897e-07 ( -3.07653e-08  3.08969e-08 ) ergs/cm2
Cutoff power-law model
Time interval is from   12.100 sec. to   13.100 sec.
Spectral model in the cutoff power-law:
------------------------------------------------------------
Parameters  : value       lower 90%   higher 90%
Photon index: -0.800751     ( -0.545398   0.627024 )
Epeak [keV] : 120.901      ( -37.6113 1616.76 )
Norm@50keV  : 6.46244E-02    ( -0.0278903   0.0582434 )
------------------------------------------------------------
#Fit statistic : Chi-Squared =          60.01 using 59 PHA bins.
# Reduced chi-squared =          1.072 for     56 degrees of freedom
# Null hypothesis probability =   3.326860e-01

Photon flux (15-150 keV)    in 1 sec: 4.23104 ( -0.38463  0.38539 ) ph/cm2/s
Energy fluence (15-150 keV)             : 0 ( 0  0 ) ergs/cm2
Time-resolved spectra
Distribution
T90 vs. Hardness ratio plot
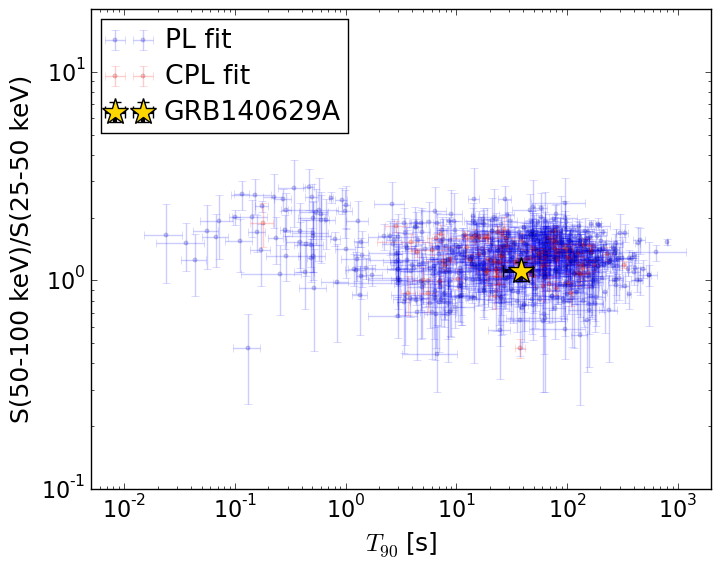
T90                                   = 38.272 sec.
Hardness ratio (energy fluence ratio) = 1.10876632741
S(15-50 keV) vs. S(50-150 keV) plot
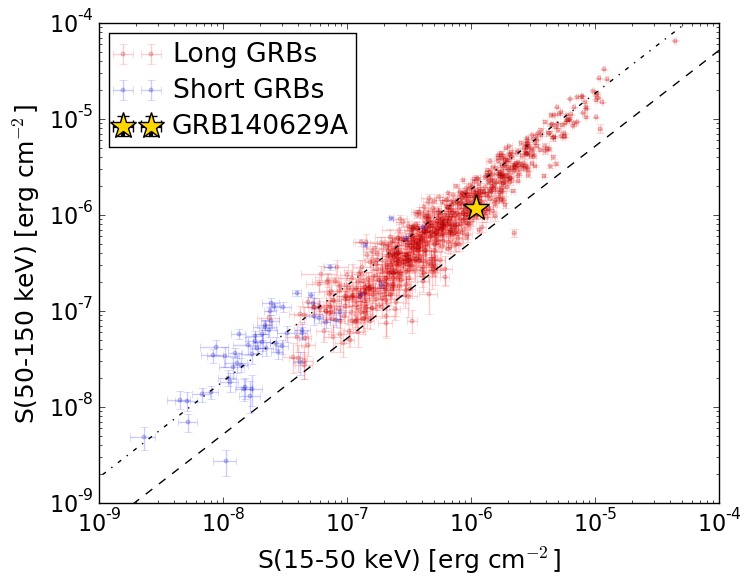
S(15-50 keV)  = 1.0997034e-06
S(50-150 keV) = 1.1908359e-06
The dash-dotted line and the dashed line traces the fluences calculated from the Band function with Epeak = 15 and 150 keV, respectively. Both lines assume a canonical values of alpha = -1 and beta = -2.5.
Mask shadow pattern
IMX = 9.671182509658034E-01, IMY = -2.212094006979784E-02
Spacecraft aspect plot
Bright source in the pre-burst/pre-slew/post-slew images
Pre-burst image of 15-350 keV band
Time interval of the image:
-239.528000 -6.184000

# RAcent  DECcent POSerr Theta    Phi  PeakCts   SNR AngSep     Name
#  [deg]    [deg]    ['] [deg]  [deg]                   [']
244.9809 -15.6501    0.4  24.4  115.9   7.5321  26.5    0.6	Sco X-1
254.4494  35.3378    7.6  41.3   12.1   0.5618   1.5    0.5	Her X-1
268.4761  -1.5624    6.4  40.6   73.6   1.7230   1.8    9.2	SW J1753.5-0127
218.9160  -4.9594    2.3  11.5 -149.0   1.0739   5.1 ------	UNKNOWN
236.7681  56.1730    2.6  54.6  -15.3   2.6694   4.5 ------	UNKNOWN
Pre-slew background subtracted image of 15-350 keV band
Time interval of the image:
-6.184000 11.572600

# RAcent  DECcent POSerr Theta    Phi  PeakCts   SNR AngSep     Name
#  [deg]    [deg]    ['] [deg]  [deg]                   [']
245.0615 -15.5188    9.9  24.4  115.6   0.0853   1.2    8.7	Sco X-1
254.5387  35.2180   15.8  41.3   12.3  -0.0658  -0.7    8.5	Her X-1
268.3561  -1.3372  401.5  40.5   73.3  -0.0067  -0.0    7.0	SW J1753.5-0127
249.0111  41.8965    0.8  44.0    1.3   1.3472  14.9 ------	UNKNOWN
Post-slew image of 15-350 keV band
Time interval of the image:
80.172600 962.479200
1036.472000 1036.572590

# RAcent  DECcent POSerr Theta    Phi  PeakCts   SNR AngSep     Name
#  [deg]    [deg]    ['] [deg]  [deg]                   [']
254.3749  35.3939    2.9   7.7   84.2   2.0815   4.0    5.1	Her X-1
299.5822  35.2012    0.6  39.5   21.4  16.8646  19.5    0.4	Cyg X-1
308.0791  40.9311    1.9  43.4    9.4   5.3730   6.1    1.9	Cyg X-3
224.7334  -1.6809    3.0  48.8  151.9   8.3006   3.9 ------	UNKNOWN
215.8410   7.2097    3.2  45.4  168.5   4.2882   3.6 ------	UNKNOWN
266.2665  38.3511    3.4  13.6   38.1   1.6636   3.4 ------	UNKNOWN
233.4060  27.7129    2.9  19.0  165.7   2.2238   4.1 ------	UNKNOWN
324.2932  42.5265    2.6  53.8    0.9   7.3251   4.4 ------	UNKNOWN
236.5050  56.1888    2.6  16.4  -86.4   2.4717   4.4 ------	UNKNOWN
331.0364  63.8267    2.6  49.9  -26.3   5.3121   4.5 ------	UNKNOWN
263.7157  86.6125    2.5  44.9  -60.0  13.2985   4.7 ------	UNKNOWN