Analysis Summary
Notes:
- 1) No attempt has been made to eliminate the non-significant decimal places.
- 2) This batgrbproduct analysis is done using the HEASARC data.
- 3) This batgrbproduct analysis is using the flight position for the mask-weighting calculation.
======================================================================
                  BAT GRB EVENT DATA PROCESSING REPORT
    Process Script Ver: batgrbproduct v2.46
    Process Start Time: Sat Oct  4 21:43:49 EDT 2014
             Host Name: batevent1
   Current Working Dir: /local/data/batevent/batevent_reproc/trigger603587
======================================================================

  Trigger: 00603587      Segment: 000

  BAT Trigger Time: 426368025.408   [s; MET]
      Trigger Stop: 426368026.432   [s; MET]
               UTC: 2014-07-06T19:33:33.176540    [includes UTCF correction]
       Where From?: TDRSS position message

  BAT
    RA: 49.3058025750973   Dec: -38.059433655106  [deg; J2000]

     Catalogged Source?: NO
     Point Source?:      YES
     GRB Indicated?:     YES    [ by BAT flight software ]
     Image S/N Ratio:    9.95
     Image Trigger?:     NO
     Rate S/N Ratio:     17.464249196573  [ if not an image trigger ]
     Image S/N Ratio:    9.95

  Analysis Position:   [ source = BAT ]
    RA: 49.3058025750973   Dec: -38.059433655106  [deg; J2000]

  Refined Position:   [ source = BAT pre-slew burst ]
    RA: 49.2696939817132   Dec: -38.0576727701692  [deg; J2000]
        { 03h 17m 04.7s , -38d 03' 27.6" }
         +/- 1.06099411871506 [arcmin] (estimated 90% radius based on SNR)
         +/- 0.381682964945771 [arcmin] (formal 1-sigma fit error)
    SNR: 27.9502409638701

  Angular difference between the analysis and refined position is 1.709142 arcmin

  Partial Coding Fraction: 0.7734375    [ including projection effects ]

  Duration
     T90: 47.8439999818802 +/- 3.94170521812915
        Measured from: -14.3920000195503
                   to: 33.4519999623299     [s; relative to TRIGTIME]
     T50: 29.5359999537468 +/- 1.15807424890658
        Measured from: -2.45200002193451
                   to: 27.0839999318123     [s; relative to TRIGTIME]


  Fluence
     Peak Flux  (peak 1 second)
        Measured from: -0.11599999666214
                   to: 0.88400000333786     [s; relative to TRIGTIME]
     Total Fluence
        Measured from: -21.2639999985695
                   to: 37.4800000190735     [s; relative to TRIGTIME]

             Band 1     Band 2     Band 3     Band 4
              15-25      25-50     50-100    100-350     keV
 Total     1.027600   1.284015   0.828400   0.096197
           0.051568   0.053200   0.045773   0.038423 [error]
 Peak      0.052806   0.074755   0.061792   0.019504
           0.007553   0.008187   0.006975   0.005335 [error]

     [ fluence units of on-axis counts / fully illuminated detector ]

======================================================================


====== Table of the duration information =============================

        Value   tstart    tstop
T100   58.744  -21.264   37.480
T90    47.844  -14.392   33.452
T50    29.536   -2.452   27.084
Peak    1.000   -0.116    0.884


====== Spectral Analysis Summary =====================================

Model      : spectral model: simple power-law (PL) and cutoff power-law (CPL)
Ph_index   : photon index: E^{Ph_index}
Ph_90err   : 90% error of the photon index
Epeak      : Epeak in keV
Epeak_90err: 90% error of Epeak
Norm       : normalization at 50 keV in both the PL model and CPL model
Nomr_90err : 90% error of the normalization
chi2       : Chi-Squared
dof        : degree of freedo

=== Time-averaged spectral analysis ===
(Best model with acceptable fit: PL)

Model Ph_index Ph_90err_low Ph_90err_hi  Epeak  Epeak_90err_low  Epeak_90err_hi  Norm       Nomr_90err_low    Norm_90err_hi    chi2    dof
PL      -1.752    -0.094      0.092       -           -               -         3.60e-03     -1.93e-04          1.91e-04      51.140   57
CPL     -1.428    -0.354      0.390       84.717     -23.617       -84.717      5.30e-03     -1.76e-03          3.06e-03      48.760   56


=== 1-s peak spectral analysis ===
(Best model with acceptable fit: PL)

Model Ph_index Ph_90err_low Ph_90err_hi  Epeak  Epeak_90err_low  Epeak_90err_hi  Norm       Nomr_90err_low    Norm_90err_hi    chi2    dof
PL      -1.451     -0.189     0.188       -           -               -         1.43e-02     -1.58e-03          1.57e-03      60.740   57
CPL     -1.448     -1.059     0.739     9992.420    -9992.420      -9992.420      1.43e-02     -1.06e-02          1.89e-02      60.740   56


=== Fluence/Peak Flux Summary ===

              Model    Band1     Band2     Band3     Band4     Band5     Total
                       15-25     25-50    50-100    100-350    15-150    15-350    keV
Fluence         PL   3.43e-07  5.40e-07  6.41e-07  1.48e-06  1.95e-06  3.00e-06   erg/cm2
      90%_error_low -2.85e-08 -2.75e-08 -4.63e-08 -2.15e-07 -1.08e-07 -2.56e-07   erg/cm2
      90%_error_hi   2.92e-08  2.75e-08  4.64e-08  2.39e-07  1.08e-07  2.74e-07   erg/cm2
Peak flux       PL   5.60e-01  5.80e-01  4.24e-01  4.99e-01  1.76e+00  2.06e+00   ph/cm2/s
      90%_error_low -1.05e-01 -6.97e-02 -5.80e-02 -1.27e-01 -1.97e-01 -2.28e-01   ph/cm2/s
      90%_error_hi   1.11e-01  6.88e-02  5.71e-02  1.51e-01  1.97e-01  2.29e-01   ph/cm2/s

Fluence        CPL   3.25e-07  5.57e-07  6.48e-07  8.96e-07  1.90e-06  2.43e-06   erg/cm2
      90%_error_low -3.41e-08 -3.33e-08 -4.86e-08 -3.61e-07 -1.24e-07 -3.83e-07   erg/cm2
      90%_error_hi   3.46e-08  3.40e-08  4.91e-08  6.49e-07  1.24e-07  6.65e-07   erg/cm2
Peak flux      CPL   5.61e-01  5.79e-01  4.23e-01  5.07e-01  1.76e+00  2.07e+00   ph/cm2/s
      90%_error_low -1.17e-01 -6.82e-02 -5.70e-02 -2.88e-01 -2.01e-01 -2.22e-01   ph/cm2/s
      90%_error_hi   8.69e-02  8.17e-02  6.54e-02  1.15e-01  1.97e-01  2.16e-01   ph/cm2/s

======================================================================
Image
Pre-slew 15.0-350.0 keV image (Event data)
#   RAcent    DECcent   POSerr    Theta     Phi              Peak Cts       SNR   Name
   49.2697   -38.0577   0.0069    28.5898  -144.9142         2.2876787     27.950 TRIG_00603587

Foreground time interval of the image:
-21.264  12.893 (delta_t =  34.157 [sec])
Background time interval of the image:
-239.408 -21.264 (delta_t = 218.144 [sec])
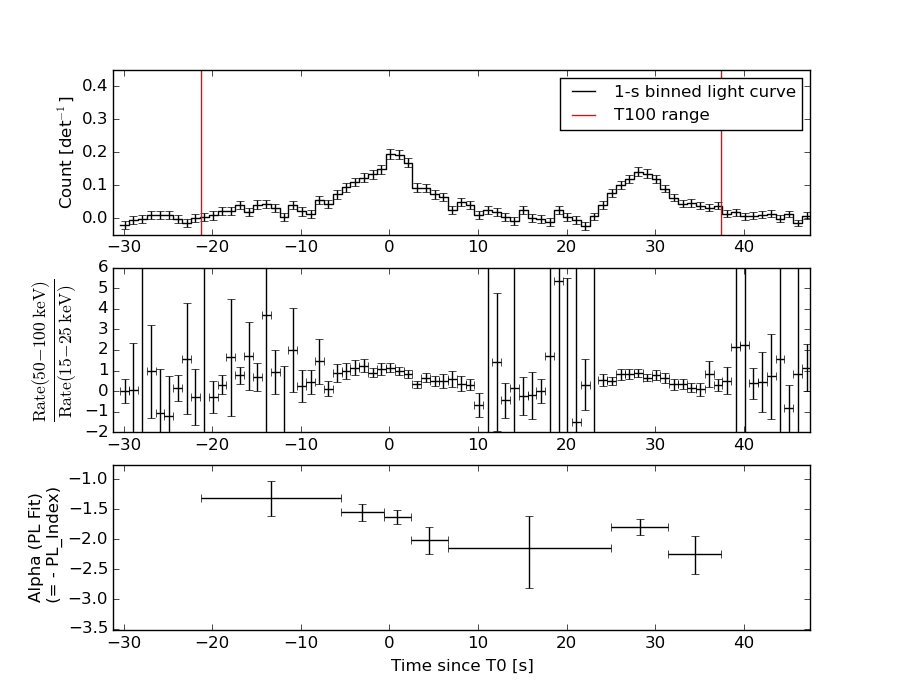
Light Curves
Note: The mask-weighted lightcurves have units of either count/det or counts/sec/det, where a det is 0.4 x 0.4 = 0.16 sq cm.
Full-time range; 1 s binning
Other quick-look light curves:
- 64 ms binning (zoomed)
- 16 ms binning (zoomed)
- 8 ms binning (zoomed)
- 2 ms binning (zoomed)
- SN=5 or 10 s binning (full-time range)
- Raw light curve
Spectra
- 64 ms binning (zoomed)
- 16 ms binning (zoomed)
- 8 ms binning (zoomed)
- 2 ms binning (zoomed)
- SN=5 or 10 s binning (full-time range)
- Raw light curve
Spectra
Notes:
- 1) The fitting includes the systematic errors.
- 2) When the burst includes telescope slew time periods, the fitting uses an average response file made from multiple 5-s response files through out the slew time plus single time preiod for the non-slew times, and weighted by the total counts in the corresponding time period using addrmf. An average response file is needed becuase a spectral fit using the pre-slew DRM will introduce some errors in both a spectral shape and a normalization if the PHA file contains a lot of the slew/post-slew time interval.
- 3) For fits to more complicated models (e.g. a power-law over a cutoff power-law), the BAT team has decided to require a chi-square improvement of more than 6 for each extra dof.
Time averaged spectrum fit using the average DRM
Power-law model
Time interval is from  -21.264 sec. to   37.480 sec.

Spectral model in power-law:
------------------------------------------------------------
Parameters  : value       lower 90%   higher 90%
Photon index: -1.75219     ( -0.093609   0.0924718 )
Norm@50keV  : 3.60471E-03    ( -0.000192508   0.000191355 )
------------------------------------------------------------
#Fit statistic : Chi-Squared =          51.14 using 59 PHA bins.
# Reduced chi-squared =         0.8973 for     57 degrees of freedom
# Null hypothesis probability =   6.933845e-01

Photon flux (15-150 keV)    in 58.74 sec: 0.487834 ( -0.025176  0.025225 ) ph/cm2/s
Energy fluence (15-150 keV)             : 1.95386e-06 ( -1.07811e-07  1.08447e-07 ) ergs/cm2
Cutoff power-law model
Time interval is from  -21.264 sec. to   37.480 sec.
Spectral model in the cutoff power-law:
------------------------------------------------------------
Parameters  : value       lower 90%   higher 90%
Photon index: -1.42796     ( -0.35404   0.390223 )
Epeak [keV] : 84.7167      ( -23.6172 -84.7167 )
Norm@50keV  : 5.30476E-03    ( -0.00176272   0.00306434 )
------------------------------------------------------------
#Fit statistic : Chi-Squared =          48.76 using 59 PHA bins.
# Reduced chi-squared =         0.8707 for     56 degrees of freedom
# Null hypothesis probability =   7.429883e-01

Photon flux (15-150 keV)    in 58.74 sec: 0.478623 ( -0.02709  0.027096 ) ph/cm2/s
Energy fluence (15-150 keV)             : 1.89847e-06 ( -1.23694e-07  1.23868e-07 ) ergs/cm2
1-s peak spectrum fit
Power-law model
Time interval is from   -0.116 sec. to    0.884 sec.

Spectral model in power-law:
------------------------------------------------------------
Parameters  : value       lower 90%   higher 90%
Photon index: -1.45103     ( -0.189104   0.187979 )
Norm@50keV  : 1.42501E-02    ( -0.00157901   0.00157314 )
------------------------------------------------------------
#Fit statistic : Chi-Squared =          60.74 using 59 PHA bins.
# Reduced chi-squared =          1.066 for     57 degrees of freedom
# Null hypothesis probability =   3.428417e-01

Photon flux (15-150 keV)    in 1 sec: 1.75661 ( -0.1969  0.19726 ) ph/cm2/s
Energy fluence (15-150 keV)             : 1.36355e-07 ( -1.64989e-08  1.65987e-08 ) ergs/cm2
Cutoff power-law model

Time interval is from   -0.116 sec. to    0.884 sec.
Spectral model in the cutoff power-law:
------------------------------------------------------------
Parameters  : value       lower 90%   higher 90%
Photon index: -1.44848     ( -1.05948   0.739365 )
Epeak [keV] : 9992.42      ( -9997.42 -9997.42 )
Norm@50keV  : 1.42872E-02    ( -0.0105986   0.0188552 )
------------------------------------------------------------
#Fit statistic : Chi-Squared =          60.74 using 59 PHA bins.
# Reduced chi-squared =          1.085 for     56 degrees of freedom
# Null hypothesis probability =   3.091274e-01

Photon flux (15-150 keV)    in 1 sec: 1.75779 ( -0.20053  0.19741 ) ph/cm2/s
Energy fluence (15-150 keV)             : 7.16622e-08 ( -1.93793e-08  1.54863e-08 ) ergs/cm2
Time-resolved spectra
Distribution
T90 vs. Hardness ratio plot
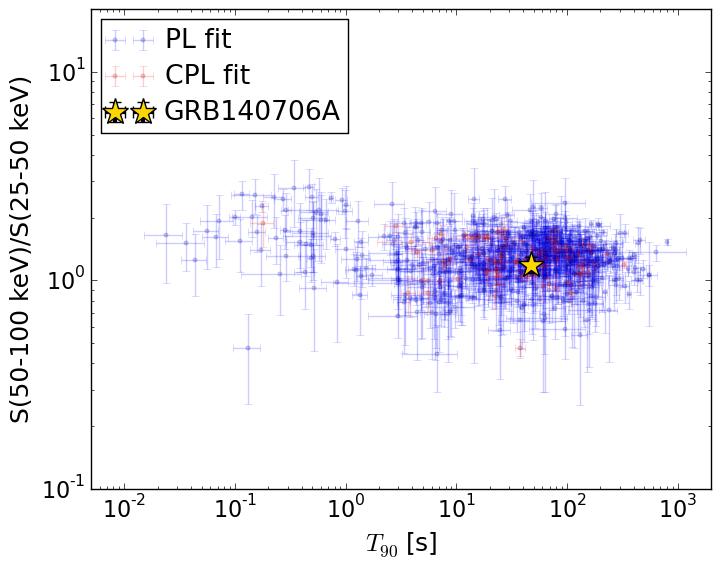
T90                                   = 47.844 sec.
Hardness ratio (energy fluence ratio) = 1.18743528561
S(15-50 keV) vs. S(50-150 keV) plot
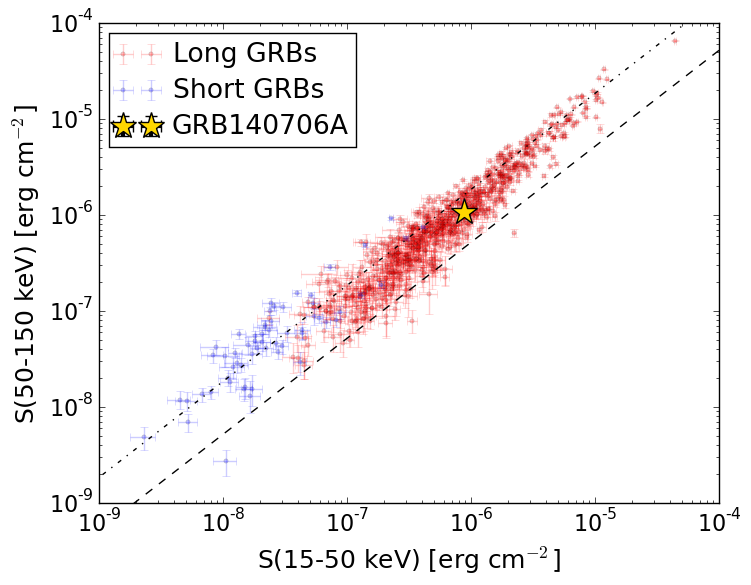
S(15-50 keV)  = 8.829091e-07
S(50-150 keV) = 1.0709575e-06
The dash-dotted line and the dashed line traces the fluences calculated from the Band function with Epeak = 15 and 150 keV, respectively. Both lines assume a canonical values of alpha = -1 and beta = -2.5.
Mask shadow pattern
IMX = -4.459586836262177E-01, IMY = 3.132597269884030E-01
Spacecraft aspect plot
Bright source in the pre-burst/pre-slew/post-slew images
Pre-burst image of 15-350 keV band
Time interval of the image:
-239.408000 -21.264000

# RAcent  DECcent POSerr Theta    Phi  PeakCts   SNR AngSep     Name
#  [deg]    [deg]    ['] [deg]  [deg]                   [']
135.5398 -40.5553    4.0  51.8  -38.9   3.0714   2.9    0.5	Vela X-1
170.4972 -60.6793   11.8  45.5   -0.4  -0.3652  -1.0    6.3	Cen X-3
186.4113 -62.8278    5.4  46.8   10.3   0.9118   2.1    7.6	GX 301-2
 51.4055 -13.4406    3.4  53.2 -142.1   4.0294   3.4 ------	UNKNOWN
Pre-slew background subtracted image of 15-350 keV band
Time interval of the image:
-21.264000 12.892590

# RAcent  DECcent POSerr Theta    Phi  PeakCts   SNR AngSep     Name
#  [deg]    [deg]    ['] [deg]  [deg]                   [']
135.5234 -40.5665    7.5  51.8  -38.9   0.5109   1.5    0.7	Vela X-1
170.1288 -60.6043   30.8  45.5   -0.6   0.0483   0.4    5.6	Cen X-3
186.6054 -62.6105    5.5  47.0   10.3   0.3098   2.1    9.7	GX 301-2
331.7239 -51.6898    2.4  39.5  108.2   1.3487   4.9 ------	UNKNOWN
 49.2697 -38.0577    0.4  28.6 -144.9   2.2878  28.0 ------	UNKNOWN
Post-slew image of 15-350 keV band
Time interval of the image:
61.892590 962.606600

# RAcent  DECcent POSerr Theta    Phi  PeakCts   SNR AngSep     Name
#  [deg]    [deg]    ['] [deg]  [deg]                   [']
128.6916 -84.1592    3.1  51.1   31.4  11.1462   3.8 ------	UNKNOWN
127.6746 -52.4254    3.3  54.2   -8.6   5.3248   3.5 ------	UNKNOWN
 27.0454  17.1384    2.8  59.0 -166.1  15.6234   4.2 ------	UNKNOWN
 33.0969  18.6570    7.1  58.7 -159.2   7.9167   1.6 ------	UNKNOWN
111.1218 -29.3898    2.8  51.2  -41.4  13.9244   4.1 ------	UNKNOWN