Analysis Summary
Notes:
- 1) No attempt has been made to eliminate the non-significant decimal places.
- 2) This batgrbproduct analysis is done using the HEASARC data.
- 3) This batgrbproduct analysis is using the flight position for the mask-weighting calculation.
======================================================================
                  BAT GRB EVENT DATA PROCESSING REPORT
    Process Script Ver: batgrbproduct v2.46
    Process Start Time: Sat Oct  4 21:39:54 EDT 2014
             Host Name: batevent1
   Current Working Dir: /local/data/batevent/batevent_reproc/trigger603810
======================================================================

  Trigger: 00603810      Segment: 000

  BAT Trigger Time: 426561233.408   [s; MET]
      Trigger Stop: 426561234.432   [s; MET]
               UTC: 2014-07-09T01:13:41.167180    [includes UTCF correction]
       Where From?: TDRSS position message

  BAT
    RA: 304.638752617788   Dec: 51.2230855104488  [deg; J2000]

     Catalogged Source?: NO
     Point Source?:      YES
     GRB Indicated?:     YES    [ by BAT flight software ]
     Image S/N Ratio:    12.54
     Image Trigger?:     NO
     Rate S/N Ratio:     20.1246117974981  [ if not an image trigger ]
     Image S/N Ratio:    12.54

  Analysis Position:   [ source = BAT ]
    RA: 304.638752617788   Dec: 51.2230855104488  [deg; J2000]

  Refined Position:   [ source = BAT pre-slew burst ]
    RA: 304.665870644372   Dec: 51.2218252529049  [deg; J2000]
        { 20h 18m 39.8s , +51d 13' 18.6" }
         +/- 0.765187295282297 [arcmin] (estimated 90% radius based on SNR)
         +/- 0.31619013194306 [arcmin] (formal 1-sigma fit error)
    SNR: 44.5825033104459

  Angular difference between the analysis and refined position is 1.021840 arcmin

  Partial Coding Fraction: 0.6171875    [ including projection effects ]

  Duration
     T90: 105.191999912262 +/- 7.38508875711292
        Measured from: -32.4919999837875
                   to: 72.6999999284744     [s; relative to TRIGTIME]
     T50: 24.6319999694824 +/- 1.78511623636155
        Measured from: -6.76800000667572
                   to: 17.8639999628067     [s; relative to TRIGTIME]


  Fluence
     Peak Flux  (peak 1 second)
        Measured from: 15.4760000109673
                   to: 16.4760000109673     [s; relative to TRIGTIME]
     Total Fluence
        Measured from: -46.0799999833107
                   to: 85.5920000076294     [s; relative to TRIGTIME]

             Band 1     Band 2     Band 3     Band 4
              15-25      25-50     50-100    100-350     keV
 Total     2.487605   3.437267   2.473854   0.611005
           0.085174   0.088279   0.076893   0.064219 [error]
 Peak      0.079410   0.144267   0.120044   0.027379
           0.009760   0.010568   0.009112   0.006941 [error]

     [ fluence units of on-axis counts / fully illuminated detector ]

======================================================================


====== Table of the duration information =============================

        Value   tstart    tstop
T100  131.672  -46.080   85.592
T90   105.192  -32.492   72.700
T50    24.632   -6.768   17.864
Peak    1.000   15.476   16.476


====== Spectral Analysis Summary =====================================

Model      : spectral model: simple power-law (PL) and cutoff power-law (CPL)
Ph_index   : photon index: E^{Ph_index}
Ph_90err   : 90% error of the photon index
Epeak      : Epeak in keV
Epeak_90err: 90% error of Epeak
Norm       : normalization at 50 keV in both the PL model and CPL model
Nomr_90err : 90% error of the normalization
chi2       : Chi-Squared
dof        : degree of freedo

=== Time-averaged spectral analysis ===
(Best model with acceptable fit: CPL)

Model Ph_index Ph_90err_low Ph_90err_hi  Epeak  Epeak_90err_low  Epeak_90err_hi  Norm       Nomr_90err_low    Norm_90err_hi    chi2    dof
PL      -1.645    -0.059      0.059       -           -               -         4.54e-03     -1.46e-04          1.45e-04      53.110   57
CPL     -1.284    -0.241      0.255      103.830     -22.973        97.252      6.76e-03     -1.54e-03          2.14e-03      46.440   56


=== 1-s peak spectral analysis ===
(Best model with acceptable fit: CPL)

Model Ph_index Ph_90err_low Ph_90err_hi  Epeak  Epeak_90err_low  Epeak_90err_hi  Norm       Nomr_90err_low    Norm_90err_hi    chi2    dof
PL      -1.427     -0.130     0.130       -           -               -         2.53e-02     -2.04e-03          2.04e-03      63.780   57
CPL     -0.433     -0.600     0.699       80.577     -15.082        45.956      7.89e-02     -3.85e-02          9.21e-02      55.150   56


=== Fluence/Peak Flux Summary ===

              Model    Band1     Band2     Band3     Band4     Band5     Total
                       15-25     25-50    50-100    100-350    15-150    15-350    keV
Fluence         PL   8.75e-07  1.47e-06  1.88e-06  4.83e-06  5.56e-06  9.06e-06   erg/cm2
      90%_error_low -5.16e-08 -5.14e-08 -7.75e-08 -4.28e-07 -1.86e-07 -4.80e-07   erg/cm2
      90%_error_hi   5.28e-08  5.13e-08  7.73e-08  4.55e-07  1.87e-07  5.00e-07   erg/cm2
Peak flux       PL   9.70e-01  1.02e+00  7.59e-01  9.13e-01  3.10e+00  3.66e+00   ph/cm2/s
      90%_error_low -1.33e-01 -9.10e-02 -7.24e-02 -1.63e-01 -2.58e-01 -2.97e-01   ph/cm2/s
      90%_error_hi   1.39e-01  9.04e-02  7.19e-02  1.83e-01  2.58e-01  2.97e-01   ph/cm2/s

Fluence        CPL   8.10e-07  1.51e-06  1.93e-06  2.98e-06  5.42e-06  7.23e-06   erg/cm2
      90%_error_low -6.53e-08 -5.80e-08 -8.48e-08 -7.71e-07 -2.10e-07 -7.96e-07   erg/cm2
      90%_error_hi   6.66e-08  5.86e-08  8.56e-08  1.11e-06  2.09e-07  1.11e-06   erg/cm2
Peak flux      CPL   8.05e-01  1.11e+00  8.29e-01  3.67e-01  3.00e+00  3.12e+00   ph/cm2/s
      90%_error_low -1.62e-01 -1.11e-01 -8.67e-02 -1.48e-01 -2.67e-01 -3.10e-01   ph/cm2/s
      90%_error_hi   1.67e-01  1.13e-01  8.84e-02  2.49e-01  2.66e-01  3.45e-01   ph/cm2/s

======================================================================
Image
Pre-slew 15.0-350.0 keV image (Event data)
#   RAcent    DECcent   POSerr    Theta     Phi              Peak Cts       SNR   Name
  304.6659    51.2218   0.0043    36.8545    -4.4807         6.3428218     44.583 TRIG_00603810

Foreground time interval of the image:
-46.080  15.693 (delta_t =  61.773 [sec])
Background time interval of the image:
-239.408 -46.080 (delta_t = 193.328 [sec])
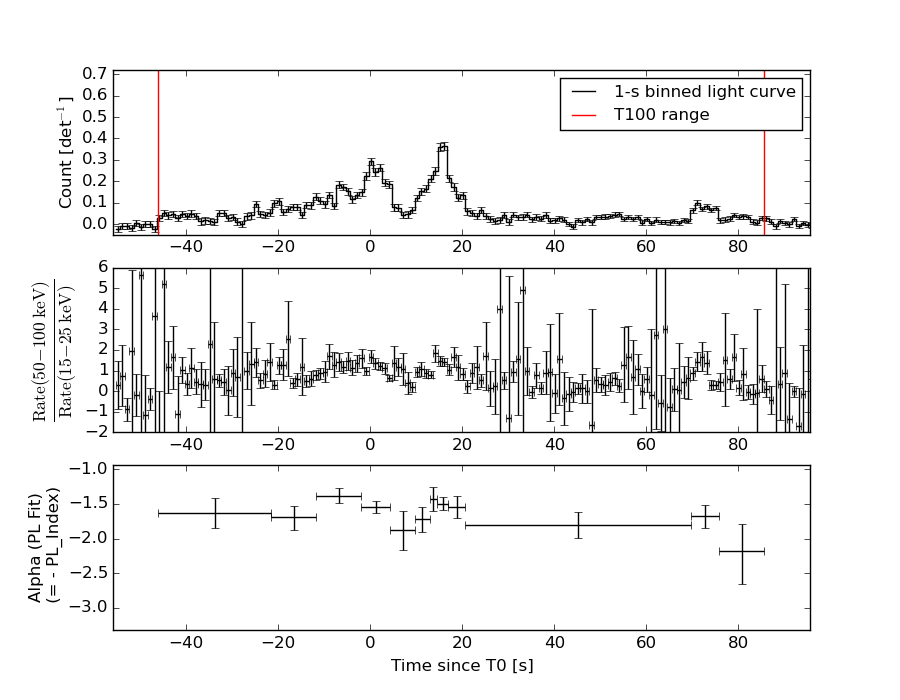
Light Curves
Note: The mask-weighted lightcurves have units of either count/det or counts/sec/det, where a det is 0.4 x 0.4 = 0.16 sq cm.
Full-time range; 1 s binning
Other quick-look light curves:
- 64 ms binning (zoomed)
- 16 ms binning (zoomed)
- 8 ms binning (zoomed)
- 2 ms binning (zoomed)
- SN=5 or 10 s binning (full-time range)
- Raw light curve
Spectra
- 64 ms binning (zoomed)
- 16 ms binning (zoomed)
- 8 ms binning (zoomed)
- 2 ms binning (zoomed)
- SN=5 or 10 s binning (full-time range)
- Raw light curve
Spectra
Notes:
- 1) The fitting includes the systematic errors.
- 2) When the burst includes telescope slew time periods, the fitting uses an average response file made from multiple 5-s response files through out the slew time plus single time preiod for the non-slew times, and weighted by the total counts in the corresponding time period using addrmf. An average response file is needed becuase a spectral fit using the pre-slew DRM will introduce some errors in both a spectral shape and a normalization if the PHA file contains a lot of the slew/post-slew time interval.
- 3) For fits to more complicated models (e.g. a power-law over a cutoff power-law), the BAT team has decided to require a chi-square improvement of more than 6 for each extra dof.
Time averaged spectrum fit using the average DRM
Power-law model
Time interval is from  -46.080 sec. to   85.592 sec.

Spectral model in power-law:
------------------------------------------------------------
Parameters  : value       lower 90%   higher 90%
Photon index: -1.64498     ( -0.0591576   0.058949 )
Norm@50keV  : 4.54023E-03    ( -0.000145562   0.000145452 )
------------------------------------------------------------
#Fit statistic : Chi-Squared =          53.11 using 59 PHA bins.
# Reduced chi-squared =         0.9318 for     57 degrees of freedom
# Null hypothesis probability =   6.216123e-01

Photon flux (15-150 keV)    in 131.7 sec: 0.591886 ( -0.020547  0.020613 ) ph/cm2/s
Energy fluence (15-150 keV)             : 5.56475e-06 ( -1.86313e-07  1.86682e-07 ) ergs/cm2
Cutoff power-law model
Time interval is from  -46.080 sec. to   85.592 sec.
Spectral model in the cutoff power-law:
------------------------------------------------------------
Parameters  : value       lower 90%   higher 90%
Photon index: -1.28409     ( -0.241253   0.25531 )
Epeak [keV] : 103.830      ( -22.9728 97.2524 )
Norm@50keV  : 6.76014E-03    ( -0.00154374   0.00214021 )
------------------------------------------------------------
#Fit statistic : Chi-Squared =          46.44 using 59 PHA bins.
# Reduced chi-squared =         0.8293 for     56 degrees of freedom
# Null hypothesis probability =   8.149764e-01

Photon flux (15-150 keV)    in 131.7 sec: 0.577095 ( -0.022554  0.022671 ) ph/cm2/s
Energy fluence (15-150 keV)             : 5.42246e-06 ( -2.09842e-07  2.09065e-07 ) ergs/cm2
1-s peak spectrum fit
Power-law model
Time interval is from   15.476 sec. to   16.476 sec.

Spectral model in power-law:
------------------------------------------------------------
Parameters  : value       lower 90%   higher 90%
Photon index: -1.42653     ( -0.129543   0.129823 )
Norm@50keV  : 2.52837E-02    ( -0.00204036   0.00203877 )
------------------------------------------------------------
#Fit statistic : Chi-Squared =          63.78 using 59 PHA bins.
# Reduced chi-squared =          1.119 for     57 degrees of freedom
# Null hypothesis probability =   2.502787e-01

Photon flux (15-150 keV)    in 1 sec: 3.09820 ( -0.25761  0.25806 ) ph/cm2/s
Energy fluence (15-150 keV)             : 2.43052e-07 ( -2.10535e-08  2.11706e-08 ) ergs/cm2
Cutoff power-law model
Time interval is from   15.476 sec. to   16.476 sec.
Spectral model in the cutoff power-law:
------------------------------------------------------------
Parameters  : value       lower 90%   higher 90%
Photon index: -0.433435     ( -0.600478   0.699191 )
Epeak [keV] : 80.5772      ( -15.0822 45.9554 )
Norm@50keV  : 7.88589E-02    ( -0.0385476   0.0920968 )
------------------------------------------------------------
#Fit statistic : Chi-Squared =          55.15 using 59 PHA bins.
# Reduced chi-squared =         0.9848 for     56 degrees of freedom
# Null hypothesis probability =   5.070151e-01

Photon flux (15-150 keV)    in 1 sec: 2.99520 ( -0.26664  0.26636 ) ph/cm2/s
Energy fluence (15-150 keV)             : 2.29774e-07 ( -2.26502e-08  2.28008e-08 ) ergs/cm2
Time-resolved spectra
Distribution
T90 vs. Hardness ratio plot
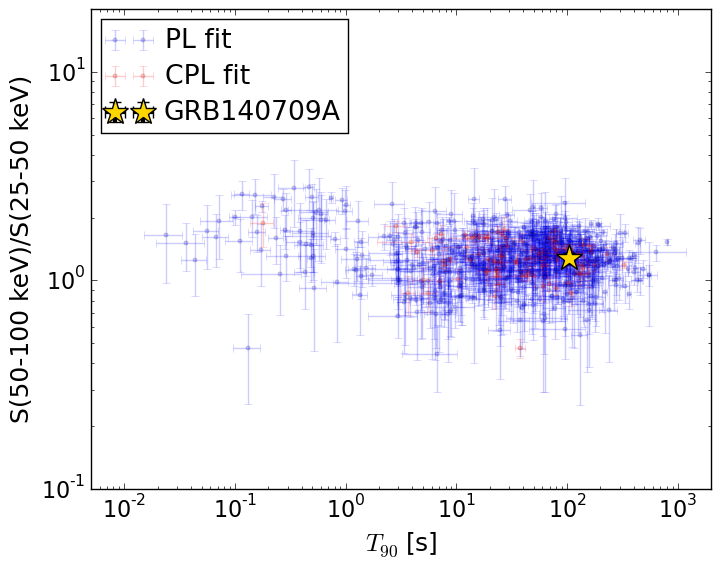
T90                                   = 105.192 sec.
Hardness ratio (energy fluence ratio) = 1.27661459082
S(15-50 keV) vs. S(50-150 keV) plot
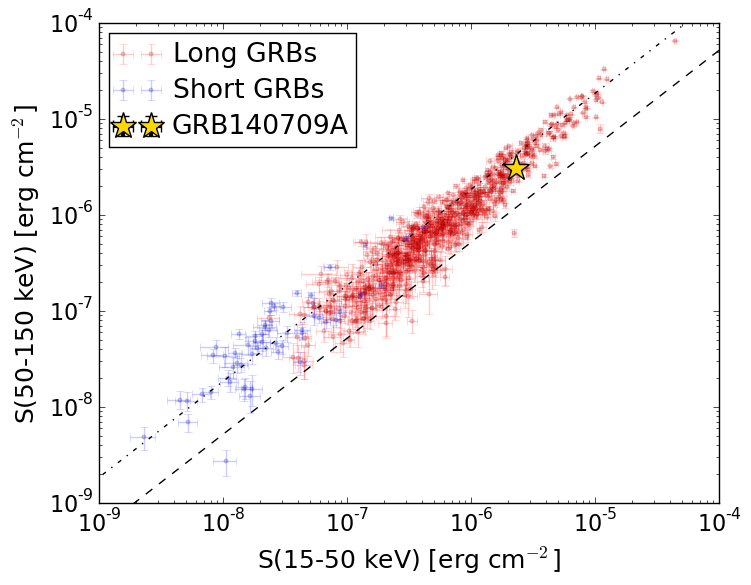
S(15-50 keV)  = 2.3206103e-06
S(50-150 keV) = 3.101793e-06
The dash-dotted line and the dashed line traces the fluences calculated from the Band function with Epeak = 15 and 150 keV, respectively. Both lines assume a canonical values of alpha = -1 and beta = -2.5.
Mask shadow pattern
IMX = 7.472891178422966E-01, IMY = 5.855921367516614E-02
Spacecraft aspect plot
Bright source in the pre-burst/pre-slew/post-slew images
Pre-burst image of 15-350 keV band
Time interval of the image:
-239.408000 -46.080000

# RAcent  DECcent POSerr Theta    Phi  PeakCts   SNR AngSep     Name
#  [deg]    [deg]    ['] [deg]  [deg]                   [']
254.6346  35.2533    6.4   4.6  109.0   0.3264   1.8   10.2	Her X-1
299.5869  35.1769    1.6  36.5   23.2   2.0369   7.3    1.5	Cyg X-1
307.9348  41.0734    0.0  40.8   10.9   0.3100   1.0   10.8	Cyg X-3
326.1666  38.2324    4.3  54.9    7.5   2.2414   2.7    5.4	Cyg X-2
274.4683   5.1405    2.6  39.4   86.9   3.2854   4.4 ------	UNKNOWN
223.4007  13.1431    2.6  37.5  174.3   1.1892   4.5 ------	UNKNOWN
210.4738  13.2635    2.8  46.0 -171.7   1.3912   4.1 ------	UNKNOWN
Pre-slew background subtracted image of 15-350 keV band
Time interval of the image:
-46.080000 15.692600

# RAcent  DECcent POSerr Theta    Phi  PeakCts   SNR AngSep     Name
#  [deg]    [deg]    ['] [deg]  [deg]                   [']
254.5025  35.2649    4.4   4.6  110.3  -0.2819  -2.6    5.1	Her X-1
299.5589  35.2655    7.5  36.4   23.1  -0.2660  -1.5    4.1	Cyg X-1
308.1923  40.9984    6.3  41.0   10.9   0.3215   1.8    4.6	Cyg X-3
326.1838  38.3909    8.9  54.8    7.3  -0.6292  -1.3    4.2	Cyg X-2
304.6659  51.2218    0.3  36.9   -4.5   6.3426  44.6 ------	UNKNOWN
205.1652   8.1894    2.6  53.3 -171.8   1.4280   4.4 ------	UNKNOWN
Post-slew image of 15-350 keV band
Time interval of the image:
72.092600 662.882000

# RAcent  DECcent POSerr Theta    Phi  PeakCts   SNR AngSep     Name
#  [deg]    [deg]    ['] [deg]  [deg]                   [']
254.4458  35.4653    5.5  38.8  160.5  -7.9274  -2.1    7.4	Her X-1
299.4933  35.2179    7.0  16.4   89.5   4.0031   1.6    4.9	Cyg X-1
308.1937  40.9203    3.2  10.6   59.7   7.0504   3.6    4.2	Cyg X-3
326.2733  38.1673   12.0  20.0   16.7  -2.0127  -1.0   10.4	Cyg X-2
278.4092  22.0450    2.4  35.6  119.2  22.2215   4.8 ------	UNKNOWN
354.6008  14.7434    4.0  54.0    8.2  19.5123   2.9 ------	UNKNOWN
220.3019  45.2515    2.4  53.3 -166.4  34.0914   4.9 ------	UNKNOWN
 13.7800  26.5886    3.1  56.7  -17.7  31.5050   3.8 ------	UNKNOWN