Analysis Summary
Notes:
- 1) No attempt has been made to eliminate the non-significant decimal places.
- 2) This batgrbproduct analysis is done using the HEASARC data.
- 3) This batgrbproduct analysis is using the flight position for the mask-weighting calculation.
======================================================================
BAT GRB EVENT DATA PROCESSING REPORT
Process Script Ver: batgrbproduct v2.46
Process Start Time: Sat Oct 4 21:35:12 EDT 2014
Host Name: batevent1
Current Working Dir: /local/data/batevent/batevent_reproc/trigger603866
======================================================================
Trigger: 00603866 Segment: 000
BAT Trigger Time: 426611757.248 [s; MET]
Trigger Stop: 426611761.344 [s; MET]
UTC: 2014-07-09T15:15:45.004740 [includes UTCF correction]
Where From?: TDRSS position message
BAT
RA: 146.070957947034 Dec: 63.5055176990785 [deg; J2000]
Catalogged Source?: NO
Point Source?: YES
GRB Indicated?: YES [ by BAT flight software ]
Image S/N Ratio: 9.65
Image Trigger?: NO
Rate S/N Ratio: 8.54400374531753 [ if not an image trigger ]
Image S/N Ratio: 9.65
Analysis Position: [ source = BAT ]
RA: 146.070957947034 Dec: 63.5055176990785 [deg; J2000]
Refined Position: [ source = BAT pre-slew burst ]
RA: 146.049010669029 Dec: 63.5356137600143 [deg; J2000]
{ 09h 44m 11.8s , +63d 32' 08.2" }
+/- 0.879902176116548 [arcmin] (estimated 90% radius based on SNR)
+/- 0.311853828602275 [arcmin] (formal 1-sigma fit error)
SNR: 36.5172294483159
Angular difference between the analysis and refined position is 1.898822 arcmin
Partial Coding Fraction: 0.9921875 [ including projection effects ]
Duration
T90: 156.731999993324 +/- 26.229642415299
Measured from: -6.23200005292892
to: 150.499999940395 [s; relative to TRIGTIME]
T50: 93.0439999103546 +/- 4.50269967604861
Measured from: 17.055999994278
to: 110.099999904633 [s; relative to TRIGTIME]
Fluence
Peak Flux (peak 1 second)
Measured from: 123.631999969482
to: 124.631999969482 [s; relative to TRIGTIME]
Total Fluence
Measured from: -18.4960000514984
to: 200.719999969006 [s; relative to TRIGTIME]
Band 1 Band 2 Band 3 Band 4
15-25 25-50 50-100 100-350 keV
Total 1.461526 2.452086 2.131347 0.568805
0.083282 0.086594 0.076758 0.065697 [error]
Peak 0.030901 0.054121 0.023616 0.009754
0.006023 0.006416 0.005809 0.004329 [error]
[ fluence units of on-axis counts / fully illuminated detector ]
======================================================================
====== Table of the duration information =============================
Value tstart tstop
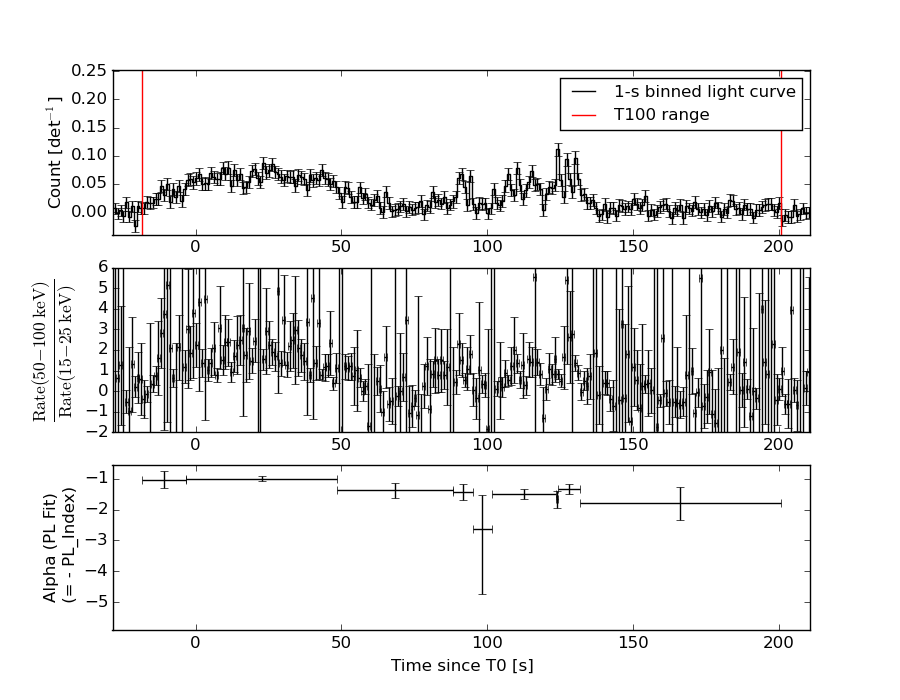
T100 219.216 -18.496 200.720
T90 156.732 -6.232 150.500
T50 93.044 17.056 110.100
Peak 1.000 123.632 124.632
====== Spectral Analysis Summary =====================================
Model : spectral model: simple power-law (PL) and cutoff power-law (CPL)
Ph_index : photon index: E^{Ph_index}
Ph_90err : 90% error of the photon index
Epeak : Epeak in keV
Epeak_90err: 90% error of Epeak
Norm : normalization at 50 keV in both the PL model and CPL model
Nomr_90err : 90% error of the normalization
chi2 : Chi-Squared
dof : degree of freedo
=== Time-averaged spectral analysis ===
(Best model with acceptable fit: PL)
Model Ph_index Ph_90err_low Ph_90err_hi Epeak Epeak_90err_low Epeak_90err_hi Norm Nomr_90err_low Norm_90err_hi chi2 dof
PL -1.234 -0.072 0.073 - - - 1.97e-03 -7.75e-05 7.75e-05 56.420 57
CPL -0.839 -0.291 0.312 162.081 -48.014 267.650 2.98e-03 -7.69e-04 1.12e-03 50.900 56
=== 1-s peak spectral analysis ===
(Best model with acceptable fit: PL)
Model Ph_index Ph_90err_low Ph_90err_hi Epeak Epeak_90err_low Epeak_90err_hi Norm Nomr_90err_low Norm_90err_hi chi2 dof
PL -1.640 -0.263 0.251 - - - 7.02e-03 -1.24e-03 1.21e-03 55.120 57
CPL -0.245 -1.351 2.426 52.333 -13.062 214.241 4.53e-02 -4.53e-02 1.29e+00 52.020 56
=== Fluence/Peak Flux Summary ===
Model Band1 Band2 Band3 Band4 Band5 Total
15-25 25-50 50-100 100-350 15-150 15-350 keV
Fluence PL 4.29e-07 9.29e-07 1.58e-06 6.17e-06 4.33e-06 9.11e-06 erg/cm2
90%_error_low -3.36e-08 -4.31e-08 -7.44e-08 -6.45e-07 -1.87e-07 -6.89e-07 erg/cm2
90%_error_hi 3.46e-08 4.29e-08 7.42e-08 6.97e-07 1.88e-07 7.33e-07 erg/cm2
Peak flux PL 3.31e-01 3.06e-01 1.97e-01 1.94e-01 9.14e-01 1.03e+00 ph/cm2/s
90%_error_low -7.34e-02 -4.79e-02 -4.36e-02 -7.18e-02 -1.42e-01 -1.66e-01 ph/cm2/s
90%_error_hi 7.66e-02 4.79e-02 4.39e-02 9.31e-02 1.42e-01 1.68e-01 ph/cm2/s
Fluence CPL 3.91e-07 9.53e-07 1.63e-06 3.66e-06 4.22e-06 6.63e-06 erg/cm2
90%_error_low -4.25e-08 -4.75e-08 -8.47e-08 -1.09e-06 -2.07e-07 -1.10e-06 erg/cm2
90%_error_hi 4.36e-08 4.79e-08 8.57e-08 1.67e-06 2.06e-07 1.66e-06 erg/cm2
Peak flux CPL 2.93e-01 3.62e-01 1.91e-01 3.76e-02 8.77e-01 8.84e-01 ph/cm2/s
90%_error_low -8.72e-02 -7.27e-02 -7.33e-02 -3.76e-02 -1.50e-01 -1.56e-01 ph/cm2/s
90%_error_hi 8.64e-02 8.23e-02 5.52e-02 1.46e-01 1.48e-01 1.79e-01 ph/cm2/s
======================================================================
Image
Pre-slew 15.0-350.0 keV image (Event data)
#   RAcent    DECcent   POSerr    Theta     Phi              Peak Cts       SNR   Name
  146.0490    63.5356   0.0052    10.3626  -125.1465         3.8749109     36.517 TRIG_00603866

Foreground time interval of the image:
-18.496  50.053 (delta_t =  68.549 [sec])
Background time interval of the image:
-608.047 -590.677 (delta_t =  17.371 [sec])
-239.248 -18.496 (delta_t = 220.752 [sec])
Light Curves
Note: The mask-weighted lightcurves have units of either count/det or counts/sec/det, where a det is 0.4 x 0.4 = 0.16 sq cm.
Full-time range; 1 s binning
Other quick-look light curves:
- 64 ms binning (zoomed)
- 16 ms binning (zoomed)
- 8 ms binning (zoomed)
- 2 ms binning (zoomed)
- SN=5 or 10 s binning (full-time range)
- Raw light curve
Spectra
- 64 ms binning (zoomed)
- 16 ms binning (zoomed)
- 8 ms binning (zoomed)
- 2 ms binning (zoomed)
- SN=5 or 10 s binning (full-time range)
- Raw light curve
Spectra
Notes:
- 1) The fitting includes the systematic errors.
- 2) When the burst includes telescope slew time periods, the fitting uses an average response file made from multiple 5-s response files through out the slew time plus single time preiod for the non-slew times, and weighted by the total counts in the corresponding time period using addrmf. An average response file is needed becuase a spectral fit using the pre-slew DRM will introduce some errors in both a spectral shape and a normalization if the PHA file contains a lot of the slew/post-slew time interval.
- 3) For fits to more complicated models (e.g. a power-law over a cutoff power-law), the BAT team has decided to require a chi-square improvement of more than 6 for each extra dof.
Time averaged spectrum fit using the average DRM
Power-law model
Time interval is from  -18.496 sec. to  200.720 sec.

Spectral model in power-law:
------------------------------------------------------------
Parameters  : value       lower 90%   higher 90%
Photon index: -1.23408     ( -0.0723124   0.0726564 )
Norm@50keV  : 1.96688E-03    ( -7.746e-05   7.74547e-05 )
------------------------------------------------------------
#Fit statistic : Chi-Squared =          56.42 using 59 PHA bins.
# Reduced chi-squared =         0.9898 for     57 degrees of freedom
# Null hypothesis probability =   4.967663e-01

Photon flux (15-150 keV)    in 219.2 sec: 0.232042 ( -0.009594  0.009611 ) ph/cm2/s
Energy fluence (15-150 keV)             : 4.33363e-06 ( -1.87043e-07  1.87747e-07 ) ergs/cm2
Cutoff power-law model
Time interval is from  -18.496 sec. to  200.720 sec.
Spectral model in the cutoff power-law:
------------------------------------------------------------
Parameters  : value       lower 90%   higher 90%
Photon index: -0.838804     ( -0.290594   0.311595 )
Epeak [keV] : 162.081      ( -48.0137 267.65 )
Norm@50keV  : 2.98271E-03    ( -0.000768864   0.0011179 )
------------------------------------------------------------
#Fit statistic : Chi-Squared =          50.90 using 59 PHA bins.
# Reduced chi-squared =         0.9090 for     56 degrees of freedom
# Null hypothesis probability =   6.676338e-01

Photon flux (15-150 keV)    in 219.2 sec: 0.226666 ( -0.010324  0.010334 ) ph/cm2/s
Energy fluence (15-150 keV)             : 4.21892e-06 ( -2.07109e-07  2.06256e-07 ) ergs/cm2
1-s peak spectrum fit
Power-law model
Time interval is from  123.632 sec. to  124.632 sec.

Spectral model in power-law:
------------------------------------------------------------
Parameters  : value       lower 90%   higher 90%
Photon index: -1.64014     ( -0.262587   0.251072 )
Norm@50keV  : 7.02225E-03    ( -0.00123796   0.00121348 )
------------------------------------------------------------
#Fit statistic : Chi-Squared =          55.12 using 59 PHA bins.
# Reduced chi-squared =         0.9669 for     57 degrees of freedom
# Null hypothesis probability =   5.460780e-01

Photon flux (15-150 keV)    in 1 sec: 0.914007 ( -0.142269  0.142273 ) ph/cm2/s
Energy fluence (15-150 keV)             : 6.53853e-08 ( -1.2107e-08  1.23987e-08 ) ergs/cm2
Cutoff power-law model
Time interval is from  123.632 sec. to  124.632 sec.
Spectral model in the cutoff power-law:
------------------------------------------------------------
Parameters  : value       lower 90%   higher 90%
Photon index: -0.244553     ( -1.35247   2.42407 )
Epeak [keV] : 52.3329      ( -13.0308 214.273 )
Norm@50keV  : 4.53022E-02    ( -0.0454989   1.29303 )
------------------------------------------------------------
#Fit statistic : Chi-Squared =          52.02 using 59 PHA bins.
# Reduced chi-squared =         0.9289 for     56 degrees of freedom
# Null hypothesis probability =   6.263991e-01

Photon flux (15-150 keV)    in 1 sec: 0.877201 ( -0.150425  0.148479 ) ph/cm2/s
Energy fluence (15-150 keV)             : 5.63547e-08 ( -1.39982e-08  1.53141e-08 ) ergs/cm2
Time-resolved spectra
Distribution
T90 vs. Hardness ratio plot
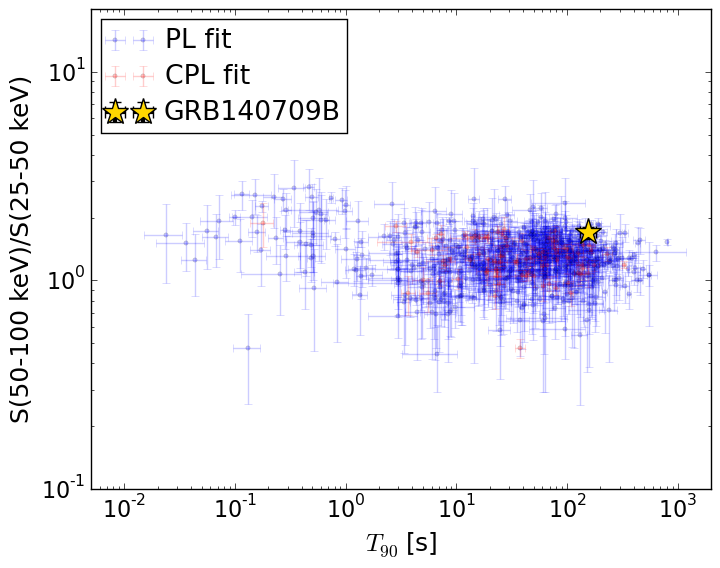
T90                                   = 156.732 sec.
Hardness ratio (energy fluence ratio) = 1.70047451763
S(15-50 keV) vs. S(50-150 keV) plot
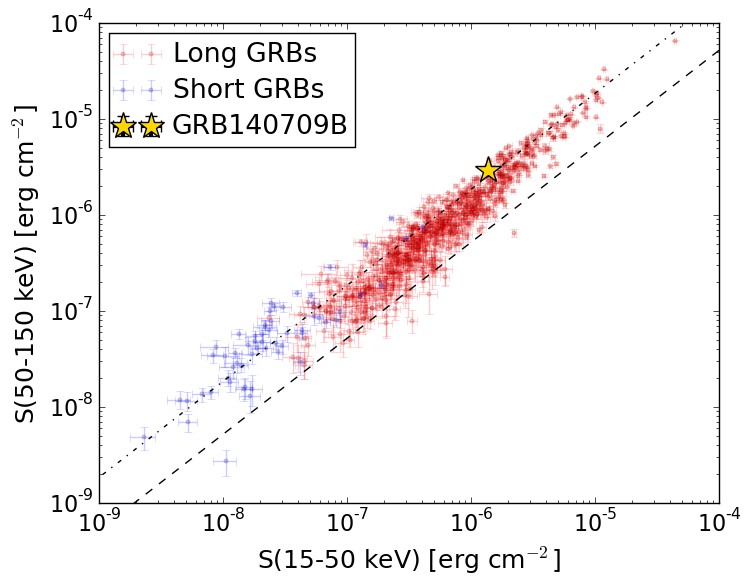
S(15-50 keV)  = 1.3581027e-06
S(50-150 keV) = 2.975564e-06
The dash-dotted line and the dashed line traces the fluences calculated from the Band function with Epeak = 15 and 150 keV, respectively. Both lines assume a canonical values of alpha = -1 and beta = -2.5.
Mask shadow pattern
IMX = -1.052671011381097E-01, IMY = 1.495215824736000E-01
Spacecraft aspect plot
Bright source in the pre-burst/pre-slew/post-slew images
Pre-burst image of 15-350 keV band
Time interval of the image:
-608.047400 -590.676500
-239.248000 -18.496000

# RAcent  DECcent POSerr Theta    Phi  PeakCts   SNR AngSep     Name
#  [deg]    [deg]    ['] [deg]  [deg]                   [']
 28.1447  49.6000    2.7  51.5   -7.5   1.8589   4.3 ------	UNKNOWN
171.5777  16.7686    2.7  57.6 -165.4   3.9147   4.3 ------	UNKNOWN
166.2272  15.2050    6.0  58.7 -159.2   2.7033   1.9 ------	UNKNOWN
Pre-slew background subtracted image of 15-350 keV band
Time interval of the image:
-18.496000 50.052600

# RAcent  DECcent POSerr Theta    Phi  PeakCts   SNR AngSep     Name
#  [deg]    [deg]    ['] [deg]  [deg]                   [']
146.0497  63.5348    0.3  10.4 -125.1   3.9183  36.9 ------	UNKNOWN
Post-slew image of 15-350 keV band
Time interval of the image:
80.052600 962.908800

# RAcent  DECcent POSerr Theta    Phi  PeakCts   SNR AngSep     Name
#  [deg]    [deg]    ['] [deg]  [deg]                   [']
359.9812  59.5313    3.2  54.3   21.0  11.6961   3.6 ------	UNKNOWN
210.0336  84.3587    1.9  24.5   53.7   3.7402   5.9 ------	UNKNOWN
145.9665  63.4294    2.2   0.1 -109.8   2.5765   5.1 ------	UNKNOWN
 92.0341  70.6823    2.7  21.4   -6.0   2.0160   4.2 ------	UNKNOWN
 63.0314  56.4103    2.6  39.2  -19.1   2.9178   4.5 ------	UNKNOWN
163.6630   6.1962    4.2  58.7 -159.2  12.2227   2.8 ------	UNKNOWN
 88.5822  34.9279    2.7  44.9  -60.0   9.5818   4.2 ------	UNKNOWN