Analysis Summary
Notes:
- 1) No attempt has been made to eliminate the non-significant decimal places.
- 2) This batgrbproduct analysis is done using the HEASARC data.
- 3) This batgrbproduct analysis is using the flight position for the mask-weighting calculation.
======================================================================
BAT GRB EVENT DATA PROCESSING REPORT
Process Script Ver: batgrbproduct v2.46
Process Start Time: Sat Oct 4 21:29:32 EDT 2014
Host Name: batevent1
Current Working Dir: /local/data/batevent/batevent_reproc/trigger603954
======================================================================
Trigger: 00603954 Segment: 000
BAT Trigger Time: 426680212.288 [s; MET]
Trigger Stop: 426680213.312 [s; MET]
UTC: 2014-07-10T10:16:40.041420 [includes UTCF correction]
Where From?: TDRSS position message
BAT
RA: 41.0871768965041 Dec: 35.4932251244368 [deg; J2000]
Catalogged Source?: NO
Point Source?: YES
GRB Indicated?: YES [ by BAT flight software ]
Image S/N Ratio: 11.54
Image Trigger?: NO
Rate S/N Ratio: 20.2731349327133 [ if not an image trigger ]
Image S/N Ratio: 11.54
Analysis Position: [ source = BAT ]
RA: 41.0871768965041 Dec: 35.4932251244368 [deg; J2000]
Refined Position: [ source = BAT pre-slew burst ]
RA: 41.0865779780287 Dec: 35.4987180474495 [deg; J2000]
{ 02h 44m 20.8s , +35d 29' 55.4" }
+/- 1.83052885375025 [arcmin] (estimated 90% radius based on SNR)
+/- 0.913692354993513 [arcmin] (formal 1-sigma fit error)
SNR: 12.8235710277597
Angular difference between the analysis and refined position is 0.330871 arcmin
Partial Coding Fraction: 0.5859375 [ including projection effects ]
Duration
T90: 3 +/- 2.23606797749979
Measured from: -0.287999987602234
to: 2.71200001239777 [s; relative to TRIGTIME]
T50: 1 +/- 1
Measured from: -0.287999987602234
to: 0.712000012397766 [s; relative to TRIGTIME]
Fluence
Peak Flux (peak 1 second)
Measured from: -0.287999987602234
to: 0.712000012397766 [s; relative to TRIGTIME]
Total Fluence
Measured from: -0.287999987602234
to: 3.71200001239777 [s; relative to TRIGTIME]
Band 1 Band 2 Band 3 Band 4
15-25 25-50 50-100 100-350 keV
Total 0.160458 0.159069 0.075023 0.016506
0.017182 0.017892 0.015773 0.014037 [error]
Peak 0.057864 0.053592 0.045052 0.015592
0.008974 0.009690 0.008673 0.007297 [error]
[ fluence units of on-axis counts / fully illuminated detector ]
======================================================================
====== Table of the duration information =============================
Value tstart tstop
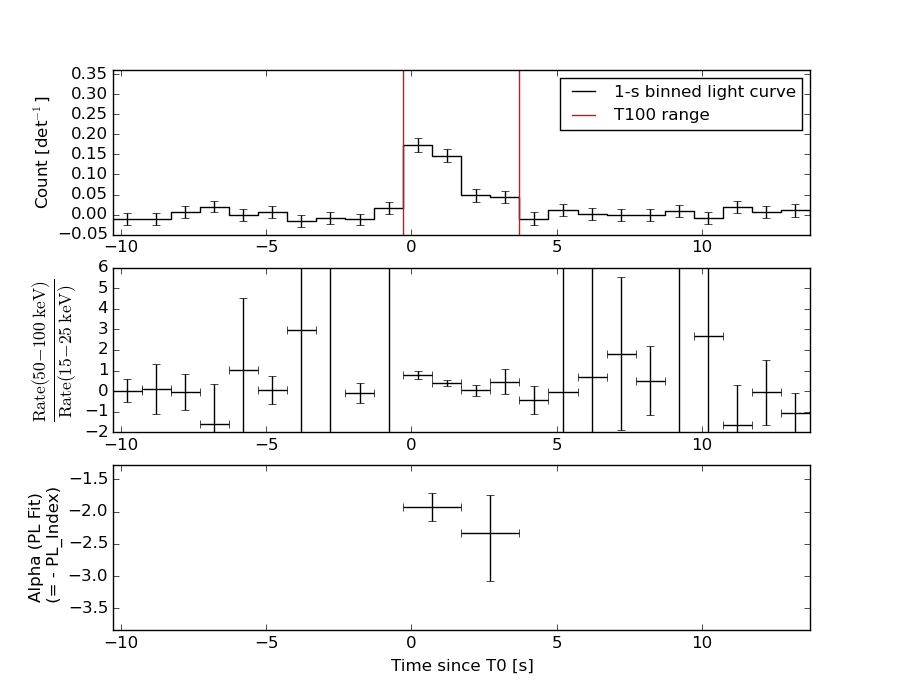
T100 4.000 -0.288 3.712
T90 3.000 -0.288 2.712
T50 1.000 -0.288 0.712
Peak 1.000 -0.288 0.712
====== Spectral Analysis Summary =====================================
Model : spectral model: simple power-law (PL) and cutoff power-law (CPL)
Ph_index : photon index: E^{Ph_index}
Ph_90err : 90% error of the photon index
Epeak : Epeak in keV
Epeak_90err: 90% error of Epeak
Norm : normalization at 50 keV in both the PL model and CPL model
Nomr_90err : 90% error of the normalization
chi2 : Chi-Squared
dof : degree of freedo
=== Time-averaged spectral analysis ===
(Best model with acceptable fit: PL)
Model Ph_index Ph_90err_low Ph_90err_hi Epeak Epeak_90err_low Epeak_90err_hi Norm Nomr_90err_low Norm_90err_hi chi2 dof
PL -2.037 -0.238 0.221 - - - 6.19e-03 -1.01e-03 9.80e-04 50.360 57
CPL -0.964 -1.010 1.279 39.555 N/A N/A 2.62e-02 N/A N/A 47.040 56
=== 1-s peak spectral analysis ===
(Best model with acceptable fit: N/A)
Model Ph_index Ph_90err_low Ph_90err_hi Epeak Epeak_90err_low Epeak_90err_hi Norm Nomr_90err_low Norm_90err_hi chi2 dof
PL -1.658 -0.285 0.271 - - - 1.13e-02 -2.02e-03 1.98e-03 76.710 57
CPL -0.624 -1.143 1.858 64.314 -17.499 -64.314 3.90e-02 -3.90e-02 2.87e-01 74.970 56
=== Fluence/Peak Flux Summary ===
Model Band1 Band2 Band3 Band4 Band5 Total
15-25 25-50 50-100 100-350 15-150 15-350 keV
Fluence PL 5.25e-08 6.97e-08 6.79e-08 1.18e-07 2.29e-07 3.08e-07 erg/cm2
90%_error_low -8.72e-09 -8.78e-09 -1.46e-08 -4.32e-08 -3.41e-08 -6.23e-08 erg/cm2
90%_error_hi 8.93e-09 8.75e-09 1.50e-08 5.68e-08 3.49e-08 7.25e-08 erg/cm2
Peak flux PL 5.40e-01 4.95e-01 3.14e-01 3.05e-01 1.48e+00 1.65e+00 ph/cm2/s
90%_error_low -1.33e-01 -8.27e-02 -7.12e-02 -1.17e-01 -2.43e-01 -2.74e-01 ph/cm2/s
90%_error_hi 1.41e-01 8.23e-02 7.04e-02 1.52e-01 2.43e-01 2.75e-01 ph/cm2/s
Fluence CPL 4.83e-08 7.91e-08 6.40e-08 2.42e-08 2.09e-07 2.16e-07 erg/cm2
90%_error_low -1.01e-08 -1.24e-08 -1.86e-08 -1.88e-08 -3.49e-08 -4.04e-08 erg/cm2
90%_error_hi 9.98e-09 1.28e-08 1.76e-08 8.06e-08 3.84e-08 8.53e-08 erg/cm2
Peak flux CPL 4.58e-01 5.50e-01 3.37e-01 1.13e-01 1.43e+00 1.46e+00 ph/cm2/s
90%_error_low -1.80e-01 -1.08e-01 -8.22e-02 -1.13e-01 -2.58e-01 -2.80e-01 ph/cm2/s
90%_error_hi 1.76e-01 1.13e-01 8.55e-02 2.40e-01 2.53e-01 3.56e-01 ph/cm2/s
======================================================================
Image
Pre-slew 15.0-350.0 keV image (Event data)
#   RAcent    DECcent   POSerr    Theta     Phi              Peak Cts       SNR   Name
   41.0866    35.4987   0.0150    36.6899  -152.2813         0.4147422     12.824 TRIG_00603954

Foreground time interval of the image:
 -0.288   3.712 (delta_t =   4.000 [sec])
Background time interval of the image:
-617.787 -528.074 (delta_t =  89.713 [sec])
-239.288  -0.288 (delta_t = 239.000 [sec])
Light Curves
Note: The mask-weighted lightcurves have units of either count/det or counts/sec/det, where a det is 0.4 x 0.4 = 0.16 sq cm.
Full-time range; 1 s binning
Other quick-look light curves:
- 64 ms binning (zoomed)
- 16 ms binning (zoomed)
- 8 ms binning (zoomed)
- 2 ms binning (zoomed)
- SN=5 or 10 s binning (full-time range)
- Raw light curve
Spectra
- 64 ms binning (zoomed)
- 16 ms binning (zoomed)
- 8 ms binning (zoomed)
- 2 ms binning (zoomed)
- SN=5 or 10 s binning (full-time range)
- Raw light curve
Spectra
Notes:
- 1) The fitting includes the systematic errors.
- 2) When the burst includes telescope slew time periods, the fitting uses an average response file made from multiple 5-s response files through out the slew time plus single time preiod for the non-slew times, and weighted by the total counts in the corresponding time period using addrmf. An average response file is needed becuase a spectral fit using the pre-slew DRM will introduce some errors in both a spectral shape and a normalization if the PHA file contains a lot of the slew/post-slew time interval.
- 3) For fits to more complicated models (e.g. a power-law over a cutoff power-law), the BAT team has decided to require a chi-square improvement of more than 6 for each extra dof.
Time averaged spectrum fit using the average DRM
Power-law model
Time interval is from   -0.288 sec. to    3.712 sec.

Spectral model in power-law:
------------------------------------------------------------
Parameters  : value       lower 90%   higher 90%
Photon index: -2.03718     ( -0.237655   0.221124 )
Norm@50keV  : 6.19134E-03    ( -0.00100561   0.000980248 )
------------------------------------------------------------
#Fit statistic : Chi-Squared =          50.36 using 59 PHA bins.
# Reduced chi-squared =         0.8835 for     57 degrees of freedom
# Null hypothesis probability =   7.206078e-01

Photon flux (15-150 keV)    in 4 sec: 0.945013 ( -0.117083  0.117097 ) ph/cm2/s
Energy fluence (15-150 keV)             : 2.28944e-07 ( -3.40722e-08  3.4883e-08 ) ergs/cm2
Cutoff power-law model
Time interval is from   -0.288 sec. to    3.712 sec.
Spectral model in the cutoff power-law:
------------------------------------------------------------
Parameters  : value       lower 90%   higher 90%
Photon index: -0.963825     ( -1.00967   1.27918 )
Epeak [keV] : 39.5551      (   )
Norm@50keV  : 2.62387E-02    (     )
------------------------------------------------------------
#Fit statistic : Chi-Squared =          47.04 using 59 PHA bins.
# Reduced chi-squared =         0.8401 for     56 degrees of freedom
# Null hypothesis probability =   7.973538e-01

Photon flux (15-150 keV)    in 4 sec: 0.915280 ( -0.119836  0.12012 ) ph/cm2/s
Energy fluence (15-150 keV)             : 2.08968e-07 ( -3.48595e-08  3.84492e-08 ) ergs/cm2
1-s peak spectrum fit
Power-law model
Time interval is from   -0.288 sec. to    0.712 sec.

Spectral model in power-law:
------------------------------------------------------------
Parameters  : value       lower 90%   higher 90%
Photon index: -1.6576     ( -0.28488   0.27066 )
Norm@50keV  : 1.12700E-02    ( -0.00202067   0.00197989 )
------------------------------------------------------------
#Fit statistic : Chi-Squared =          76.71 using 59 PHA bins.
# Reduced chi-squared =          1.346 for     57 degrees of freedom
# Null hypothesis probability =   4.194527e-02

Photon flux (15-150 keV)    in 1 sec: 1.47535 ( -0.24313  0.24332 ) ph/cm2/s
Energy fluence (15-150 keV)             : 1.04751e-07 ( -1.96176e-08  1.99156e-08 ) ergs/cm2
Cutoff power-law model
Time interval is from   -0.288 sec. to    0.712 sec.
Spectral model in the cutoff power-law:
------------------------------------------------------------
Parameters  : value       lower 90%   higher 90%
Photon index: -0.623982     ( -1.14541   1.85622 )
Epeak [keV] : 64.3144      ( -17.4667 -64.2823 )
Norm@50keV  : 3.89592E-02    ( -0.0390863   0.286441 )
------------------------------------------------------------
#Fit statistic : Chi-Squared =          74.97 using 59 PHA bins.
# Reduced chi-squared =          1.339 for     56 degrees of freedom
# Null hypothesis probability =   4.607899e-02

Photon flux (15-150 keV)    in 1 sec: 1.42676 ( -0.25774  0.25343 ) ph/cm2/s
Energy fluence (15-150 keV)             : 9.85553e-08 ( -2.02953e-08  2.14057e-08 ) ergs/cm2
Time-resolved spectra
Distribution
T90 vs. Hardness ratio plot
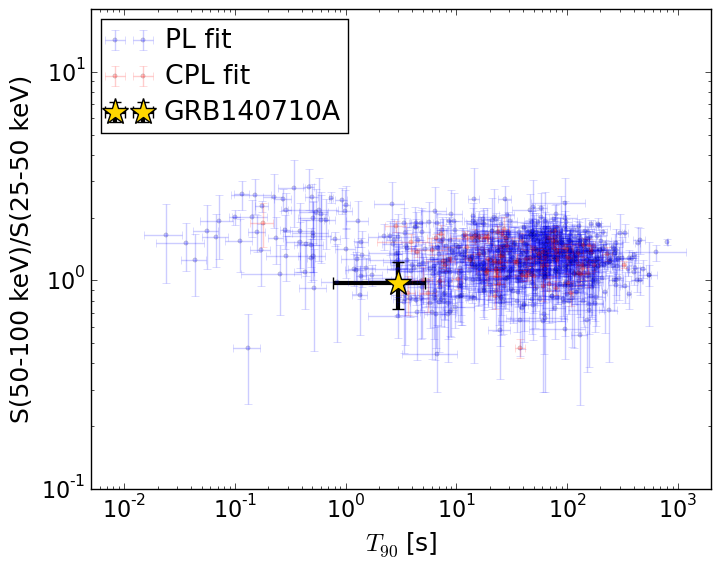
T90                                   = 3.0 sec.
Hardness ratio (energy fluence ratio) = 0.97460786532
S(15-50 keV) vs. S(50-150 keV) plot
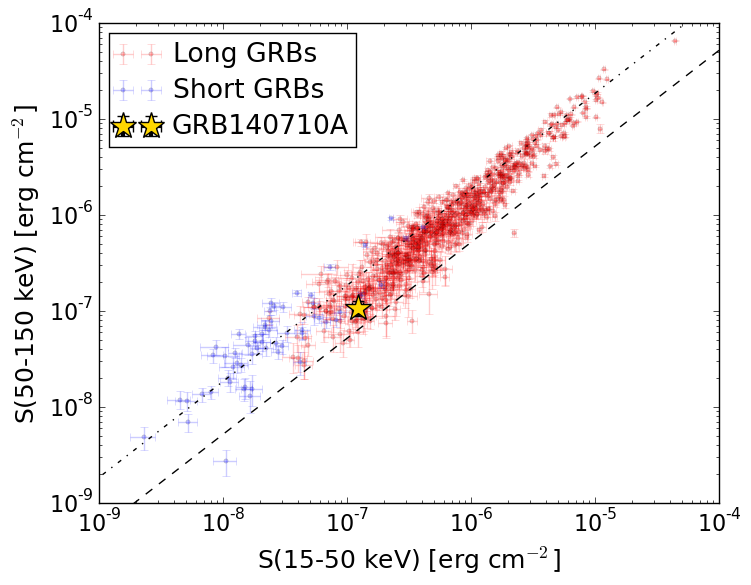
S(15-50 keV)  = 1.2215352e-07
S(50-150 keV) = 1.0679226e-07
The dash-dotted line and the dashed line traces the fluences calculated from the Band function with Epeak = 15 and 150 keV, respectively. Both lines assume a canonical values of alpha = -1 and beta = -2.5.
Mask shadow pattern
IMX = -6.595959057654972E-01, IMY = 3.465701845356184E-01
Spacecraft aspect plot
Bright source in the pre-burst/pre-slew/post-slew images
Pre-burst image of 15-350 keV band
Time interval of the image:
-617.787410 -528.074300
-239.288000 -0.288000

# RAcent  DECcent POSerr Theta    Phi  PeakCts   SNR AngSep     Name
#  [deg]    [deg]    ['] [deg]  [deg]                   [']
 34.9368 -36.5817    3.5  37.4   51.1   1.8086   3.3 ------	UNKNOWN
 12.1687  12.9981    2.4  37.0  148.6   2.1714   4.7 ------	UNKNOWN
 70.4000 -34.1562    2.5  40.0    4.4   1.6834   4.5 ------	UNKNOWN
Pre-slew background subtracted image of 15-350 keV band
Time interval of the image:
-0.288000 3.712000

# RAcent  DECcent POSerr Theta    Phi  PeakCts   SNR AngSep     Name
#  [deg]    [deg]    ['] [deg]  [deg]                   [']
 20.4456  40.6399    2.7  47.9 -171.5   0.2094   4.3 ------	UNKNOWN
 85.5386 -26.3960    2.2  45.2  -16.8   0.2222   5.2 ------	UNKNOWN
 41.0866  35.4987    0.9  36.7 -152.3   0.4147  12.8 ------	UNKNOWN
 15.0094  51.7186    2.7  59.0 -166.9   0.6259   4.2 ------	UNKNOWN
 88.5484   0.9607    1.9  41.8  -56.9   0.4047   6.1 ------	UNKNOWN
Post-slew image of 15-350 keV band
Time interval of the image:
82.012590 653.112600

# RAcent  DECcent POSerr Theta    Phi  PeakCts   SNR AngSep     Name
#  [deg]    [deg]    ['] [deg]  [deg]                   [']
 83.6306  22.0131    0.6  39.3  -74.2  23.2987  19.4    0.2	Crab
338.9420  52.4758    2.6  46.2  139.3   7.4422   4.4 ------	UNKNOWN
 20.6628  10.3706    2.7  31.2   49.0   2.4809   4.3 ------	UNKNOWN
339.5967  62.9115    2.9  46.1  153.8   3.9823   3.9 ------	UNKNOWN
 28.9823  62.0574    2.5  27.6  175.4   1.8919   4.5 ------	UNKNOWN
 48.0960   1.0510    3.7  35.0   -4.8   1.5152   3.1 ------	UNKNOWN
169.7148  83.0760    3.3  59.0 -166.1   9.0209   3.5 ------	UNKNOWN