Analysis Summary
Notes:
- 1) No attempt has been made to eliminate the non-significant decimal places.
- 2) This batgrbproduct analysis is done using the HEASARC data.
- 3) This batgrbproduct analysis is using the flight position for the mask-weighting calculation.
======================================================================
                  BAT GRB EVENT DATA PROCESSING REPORT
    Process Script Ver: batgrbproduct v2.46
    Process Start Time: Sat Oct  4 21:17:05 EDT 2014
             Host Name: batevent1
   Current Working Dir: /local/data/batevent/batevent_reproc/trigger605700
======================================================================

  Trigger: 00605700      Segment: 000

  BAT Trigger Time: 427495787.968   [s; MET]
      Trigger Stop: 427495796.16   [s; MET]
               UTC: 2014-07-19T20:49:35.681860    [includes UTCF correction]
       Where From?: TDRSS position message

  BAT
    RA: 39.7382664338233   Dec: -2.37796842981903  [deg; J2000]

     Catalogged Source?: NO
     Point Source?:      YES
     GRB Indicated?:     YES    [ by BAT flight software ]
     Image S/N Ratio:    10.91
     Image Trigger?:     NO
     Rate S/N Ratio:     10.0995049383621  [ if not an image trigger ]
     Image S/N Ratio:    10.91

  Analysis Position:   [ source = BAT ]
    RA: 39.7382664338233   Dec: -2.37796842981903  [deg; J2000]

  Refined Position:   [ source = BAT pre-slew burst ]
    RA: 39.7327341117314   Dec: -2.38409188504985  [deg; J2000]
        { 02h 38m 55.9s , -02d 23' 02.7" }
         +/- 1.64689807134861 [arcmin] (estimated 90% radius based on SNR)
         +/- 0.816100867662486 [arcmin] (formal 1-sigma fit error)
    SNR: 14.9140121619311

  Angular difference between the analysis and refined position is 0.494956 arcmin

  Partial Coding Fraction: 0.4257812    [ including projection effects ]

  Duration
     T90: 54 +/- 12.5399362039845
        Measured from: -12.9679999947548
                   to: 41.0320000052452     [s; relative to TRIGTIME]
     T50: 17 +/- 7.28010988928052
        Measured from: -2.96799999475479
                   to: 14.0320000052452     [s; relative to TRIGTIME]


  Fluence
     Peak Flux  (peak 1 second)
        Measured from: 1.03200000524521
                   to: 2.03200000524521     [s; relative to TRIGTIME]
     Total Fluence
        Measured from: -16.9679999947548
                   to: 48.0320000052452     [s; relative to TRIGTIME]

             Band 1     Band 2     Band 3     Band 4
              15-25      25-50     50-100    100-350     keV
 Total     0.590335   0.774555   0.526126   0.061294
           0.068875   0.071453   0.062139   0.051929 [error]
 Peak      0.016579   0.038697   0.023533   0.006077
           0.008754   0.009125   0.008126   0.006595 [error]

     [ fluence units of on-axis counts / fully illuminated detector ]

======================================================================


====== Table of the duration information =============================

        Value   tstart    tstop
T100   65.000  -16.968   48.032
T90    54.000  -12.968   41.032
T50    17.000   -2.968   14.032
Peak    1.000    1.032    2.032


====== Spectral Analysis Summary =====================================

Model      : spectral model: simple power-law (PL) and cutoff power-law (CPL)
Ph_index   : photon index: E^{Ph_index}
Ph_90err   : 90% error of the photon index
Epeak      : Epeak in keV
Epeak_90err: 90% error of Epeak
Norm       : normalization at 50 keV in both the PL model and CPL model
Nomr_90err : 90% error of the normalization
chi2       : Chi-Squared
dof        : degree of freedo

=== Time-averaged spectral analysis ===
(Best model with acceptable fit: PL)

Model Ph_index Ph_90err_low Ph_90err_hi  Epeak  Epeak_90err_low  Epeak_90err_hi  Norm       Nomr_90err_low    Norm_90err_hi    chi2    dof
PL      -1.722    -0.177      0.172       -           -               -         2.13e-03     -2.34e-04          2.32e-04      65.130   57
CPL     -1.026    -0.705      0.849       66.518     -16.535       846.671      4.96e-03     -2.81e-03          8.75e-03      62.290   56


=== 1-s peak spectral analysis ===
(Best model with acceptable fit: PL)

Model Ph_index Ph_90err_low Ph_90err_hi  Epeak  Epeak_90err_low  Epeak_90err_hi  Norm       Nomr_90err_low    Norm_90err_hi    chi2    dof
PL      -1.318     -0.501     0.552       -           -               -         6.27e-03     -1.85e-03          1.84e-03      47.910   57
CPL     -1.322     -0.496     0.563     9999.360    -9999.360      -9999.360      6.29e-03     -1.83e-03          6.39e-02      47.910   56


=== Fluence/Peak Flux Summary ===

              Model    Band1     Band2     Band3     Band4     Band5     Total
                       15-25     25-50    50-100    100-350    15-150    15-350    keV
Fluence         PL   2.18e-07  3.49e-07  4.23e-07  1.01e-06  1.28e-06  2.00e-06   erg/cm2
      90%_error_low -3.46e-08 -3.66e-08 -6.07e-08 -2.67e-07 -1.45e-07 -3.29e-07   erg/cm2
      90%_error_hi   3.59e-08  3.65e-08  6.06e-08  3.23e-07  1.47e-07  3.71e-07   erg/cm2
Peak flux       PL   2.17e-01  2.43e-01  1.95e-01  2.60e-01  7.50e-01  9.14e-01   ph/cm2/s
      90%_error_low -1.14e-01 -8.98e-02 -6.43e-02 -1.42e-01 -2.36e-01 -2.68e-01   ph/cm2/s
      90%_error_hi   1.35e-01  8.52e-02  6.25e-02  2.25e-01  2.39e-01  2.69e-01   ph/cm2/s

Fluence        CPL   1.98e-07  3.78e-07  4.37e-07  3.86e-07  1.22e-06  1.40e-06   erg/cm2
      90%_error_low -4.06e-08 -4.69e-08 -6.76e-08 -2.30e-07 -1.57e-07 -2.81e-07   erg/cm2
      90%_error_hi   4.12e-08  4.88e-08  6.80e-08  6.35e-07  1.59e-07  6.32e-07   erg/cm2
Peak flux      CPL   2.18e-01  2.42e-01  1.94e-01  2.61e-01  7.51e-01  9.25e-01   ph/cm2/s
      90%_error_low -1.26e-01 -4.68e-02 -6.36e-02     N/A   -2.39e-01 -2.82e-01   ph/cm2/s
      90%_error_hi   1.12e-01  7.92e-02  7.47e-02     N/A    2.38e-01  2.54e-01   ph/cm2/s

======================================================================
Image
Pre-slew 15.0-350.0 keV image (Event data)
#   RAcent    DECcent   POSerr    Theta     Phi              Peak Cts       SNR   Name
   39.7327    -2.3841   0.0128    43.6736   -31.5667         2.2428243     14.914 TRIG_00605700

Foreground time interval of the image:
-16.968  48.032 (delta_t =  65.000 [sec])
Background time interval of the image:
-522.867 -506.088 (delta_t =  16.779 [sec])
-239.968 -19.510 (delta_t = 220.458 [sec])
-17.968 -16.968 (delta_t =   1.000 [sec])
Light Curves
Note: The mask-weighted lightcurves have units of either count/det or counts/sec/det, where a det is 0.4 x 0.4 = 0.16 sq cm.
Full-time range; 1 s binning
Other quick-look light curves:
- 64 ms binning (zoomed)
- 16 ms binning (zoomed)
- 8 ms binning (zoomed)
- 2 ms binning (zoomed)
- SN=5 or 10 s binning (full-time range)
- Raw light curve
Spectra
- 64 ms binning (zoomed)
- 16 ms binning (zoomed)
- 8 ms binning (zoomed)
- 2 ms binning (zoomed)
- SN=5 or 10 s binning (full-time range)
- Raw light curve
Spectra
Notes:
- 1) The fitting includes the systematic errors.
- 2) When the burst includes telescope slew time periods, the fitting uses an average response file made from multiple 5-s response files through out the slew time plus single time preiod for the non-slew times, and weighted by the total counts in the corresponding time period using addrmf. An average response file is needed becuase a spectral fit using the pre-slew DRM will introduce some errors in both a spectral shape and a normalization if the PHA file contains a lot of the slew/post-slew time interval.
- 3) For fits to more complicated models (e.g. a power-law over a cutoff power-law), the BAT team has decided to require a chi-square improvement of more than 6 for each extra dof.
Time averaged spectrum fit using the average DRM
Power-law model
Time interval is from  -16.968 sec. to   48.032 sec.

Spectral model in power-law:
------------------------------------------------------------
Parameters  : value       lower 90%   higher 90%
Photon index: -1.72243     ( -0.176664   0.172441 )
Norm@50keV  : 2.12798E-03    ( -0.000234282   0.000231923 )
------------------------------------------------------------
#Fit statistic : Chi-Squared =          65.13 using 59 PHA bins.
# Reduced chi-squared =          1.143 for     57 degrees of freedom
# Null hypothesis probability =   2.149247e-01

Photon flux (15-150 keV)    in 65 sec: 0.284882 ( -0.030017  0.030068 ) ph/cm2/s
Energy fluence (15-150 keV)             : 1.27875e-06 ( -1.45371e-07  1.46513e-07 ) ergs/cm2
Cutoff power-law model
Time interval is from  -16.968 sec. to   48.032 sec.
Spectral model in the cutoff power-law:
------------------------------------------------------------
Parameters  : value       lower 90%   higher 90%
Photon index: -1.02636     ( -0.70489   0.848624 )
Epeak [keV] : 66.5181      ( -16.5349 846.671 )
Norm@50keV  : 4.96086E-03    ( -0.00280917   0.00874956 )
------------------------------------------------------------
#Fit statistic : Chi-Squared =          62.29 using 59 PHA bins.
# Reduced chi-squared =          1.112 for     56 degrees of freedom
# Null hypothesis probability =   2.624267e-01

Photon flux (15-150 keV)    in 65 sec: 0.277758 ( -0.030995  0.030973 ) ph/cm2/s
Energy fluence (15-150 keV)             : 1.21961e-06 ( -1.57398e-07  1.58779e-07 ) ergs/cm2
1-s peak spectrum fit
Power-law model
Time interval is from    1.032 sec. to    2.032 sec.

Spectral model in power-law:
------------------------------------------------------------
Parameters  : value       lower 90%   higher 90%
Photon index: -1.31771     ( -0.501334   0.552116 )
Norm@50keV  : 6.26546E-03    ( -0.00184553   0.00183832 )
------------------------------------------------------------
#Fit statistic : Chi-Squared =          47.91 using 59 PHA bins.
# Reduced chi-squared =         0.8405 for     57 degrees of freedom
# Null hypothesis probability =   7.991073e-01

Photon flux (15-150 keV)    in 1 sec: 0.749987 ( -0.236308  0.238766 ) ph/cm2/s
Energy fluence (15-150 keV)             : 6.16581e-08 ( -1.88131e-08  1.89484e-08 ) ergs/cm2
Cutoff power-law model

Time interval is from    1.032 sec. to    2.032 sec.
Spectral model in the cutoff power-law:
------------------------------------------------------------
Parameters  : value       lower 90%   higher 90%
Photon index: -1.32192     ( -0.49908   0.560655 )
Epeak [keV] : 9999.36      ( -9999.36 -9999.36 )
Norm@50keV  : 6.28503E-03    ( -0.00183398   0.0638813 )
------------------------------------------------------------
#Fit statistic : Chi-Squared =          47.91 using 59 PHA bins.
# Reduced chi-squared =         0.8555 for     56 degrees of freedom
# Null hypothesis probability =   7.706874e-01

Photon flux (15-150 keV)    in 1 sec: 0.751025 ( -0.238544  0.238207 ) ph/cm2/s
Energy fluence (15-150 keV)             : 6.17703e-08 ( -1.98147e-08  1.72757e-08 ) ergs/cm2
Time-resolved spectra
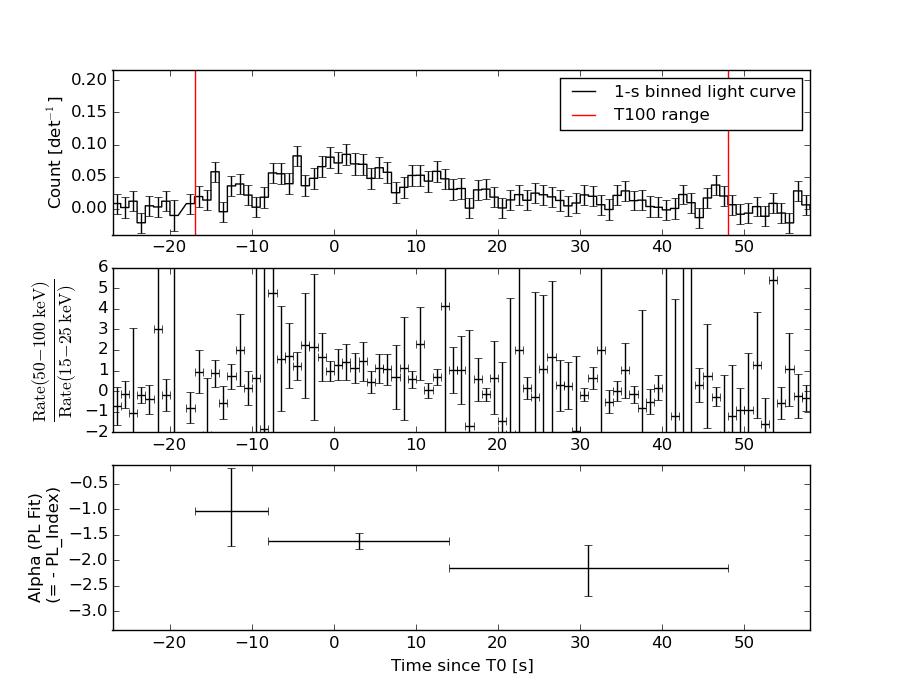
Distribution
T90 vs. Hardness ratio plot
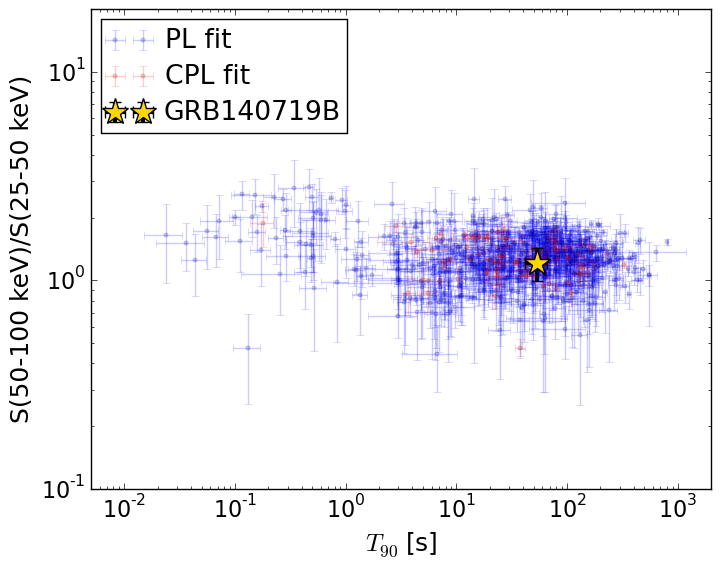
T90                                   = 54.0 sec.
Hardness ratio (energy fluence ratio) = 1.21218792589
S(15-50 keV) vs. S(50-150 keV) plot
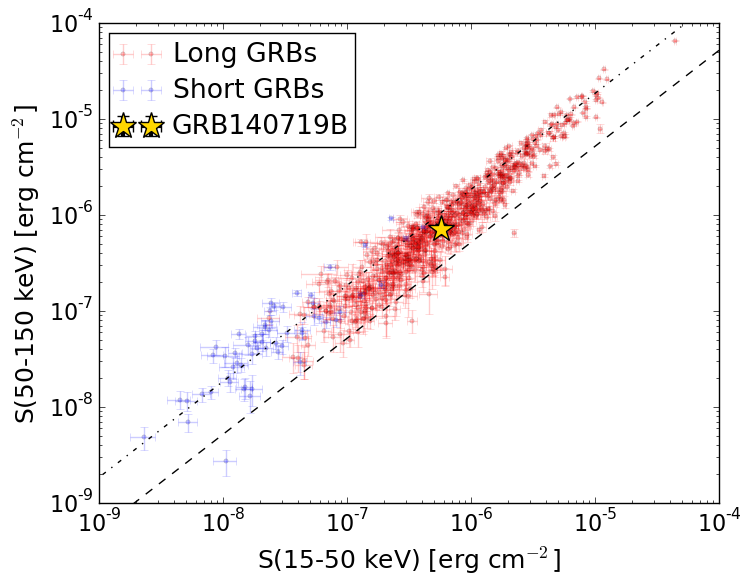
S(15-50 keV)  = 5.670466e-07
S(50-150 keV) = 7.116902e-07
The dash-dotted line and the dashed line traces the fluences calculated from the Band function with Epeak = 15 and 150 keV, respectively. Both lines assume a canonical values of alpha = -1 and beta = -2.5.
Mask shadow pattern
IMX = 8.134667019381689E-01, IMY = 4.997974591022476E-01
Spacecraft aspect plot
Bright source in the pre-burst/pre-slew/post-slew images
Pre-burst image of 15-350 keV band
Time interval of the image:
-522.867410 -506.088000
-239.968000 -19.510400
-17.968000 -16.968000

# RAcent  DECcent POSerr Theta    Phi  PeakCts   SNR AngSep     Name
#  [deg]    [deg]    ['] [deg]  [deg]                   [']
308.2024  40.8785    3.9  49.5  158.8   1.9951   2.9    6.1	Cyg X-3
326.3353  38.3719    6.7  35.4  160.4  -0.4887  -1.7    8.3	Cyg X-2
 43.9060 -20.4034    2.6  58.0  -16.3   3.6099   4.4 ------	UNKNOWN
 31.1444  19.8659    2.5  27.7  -62.8   1.0014   4.7 ------	UNKNOWN
 49.8450 -14.4650    3.5  58.7  -25.9   3.8793   3.3 ------	UNKNOWN
 51.1256  -1.4871    3.1  53.1  -40.2   3.4561   3.7 ------	UNKNOWN
Pre-slew background subtracted image of 15-350 keV band
Time interval of the image:
-16.968000 48.032000

# RAcent  DECcent POSerr Theta    Phi  PeakCts   SNR AngSep     Name
#  [deg]    [deg]    ['] [deg]  [deg]                   [']
307.9765  41.0857   13.5  49.7  159.1   0.2689   0.9   10.0	Cyg X-3
326.2419  38.1639    8.5  35.4  160.0  -0.1786  -1.4   10.0	Cyg X-2
  0.8037  13.1799    2.1   7.0   38.1   0.4595   5.5 ------	UNKNOWN
 30.9345 -20.1146    3.2  49.5   -5.5   0.6848   3.6 ------	UNKNOWN
 39.7327  -2.3841    0.8  43.7  -31.6   2.2427  14.9 ------	UNKNOWN
314.1468  74.1174    2.5  59.6 -161.8   2.5595   4.6 ------	UNKNOWN
 43.7046  41.4766    2.1  41.4  -98.8   1.9319   5.6 ------	UNKNOWN
Post-slew image of 15-350 keV band
Time interval of the image:
563.432600 962.042000

# RAcent  DECcent POSerr Theta    Phi  PeakCts   SNR AngSep     Name
#  [deg]    [deg]    ['] [deg]  [deg]                   [']
 83.6286  22.0194    0.3  36.9  -63.2  16.6885  34.8    0.4	Crab
357.1489  30.4585    2.6  39.9  103.8   4.9087   4.5 ------	UNKNOWN
 24.3957   1.5898    3.3  41.8   43.0   2.5410   3.4 ------	UNKNOWN
264.1226  80.9249    4.8  58.3 -175.7   5.6594   2.4 ------	UNKNOWN
 58.1350  13.0207    2.5  28.3  -16.6   1.2091   4.7 ------	UNKNOWN
135.2582  69.5042    3.1  54.0 -143.4   5.7668   3.8 ------	UNKNOWN
105.2178  49.2246    2.4  43.2 -113.2   5.0913   4.8 ------	UNKNOWN