Analysis Summary
Notes:
- 1) No attempt has been made to eliminate the non-significant decimal places.
- 2) This batgrbproduct analysis is done using the HEASARC data.
- 3) This batgrbproduct analysis is using the flight position for the mask-weighting calculation.
======================================================================
BAT GRB EVENT DATA PROCESSING REPORT
Process Script Ver: batgrbproduct v2.46
Process Start Time: Sat Oct 4 21:12:40 EDT 2014
Host Name: batevent1
Current Working Dir: /local/data/batevent/batevent_reproc/trigger607742
======================================================================
Trigger: 00607742 Segment: 000
BAT Trigger Time: 428442243.648 [s; MET]
Trigger Stop: 428442245.696 [s; MET]
UTC: 2014-07-30T19:43:51.315580 [includes UTCF correction]
Where From?: TDRSS position message
BAT
RA: 56.430725282402 Dec: -66.5388247653078 [deg; J2000]
Catalogged Source?: NO
Point Source?: YES
GRB Indicated?: YES [ by BAT flight software ]
Image S/N Ratio: 7.36
Image Trigger?: NO
Rate S/N Ratio: 13.7840487520902 [ if not an image trigger ]
Image S/N Ratio: 7.36
Analysis Position: [ source = BAT ]
RA: 56.430725282402 Dec: -66.5388247653078 [deg; J2000]
Refined Position: [ source = BAT pre-slew burst ]
RA: 56.3380108437581 Dec: -66.5779431250191 [deg; J2000]
{ 03h 45m 21.1s , -66d 34' 40.6" }
+/- 2.04655915832334 [arcmin] (estimated 90% radius based on SNR)
+/- 1.14008333913291 [arcmin] (formal 1-sigma fit error)
SNR: 10.9344752815722
Angular difference between the analysis and refined position is 3.225864 arcmin
Partial Coding Fraction: 1.015625 [ including projection effects ]
Duration
T90: 40.8959999680519 +/- 3.37762995884474
Measured from: -13.3999999761581
to: 27.4959999918938 [s; relative to TRIGTIME]
T50: 19.0719999670982 +/- 14.2365119733036
Measured from: -9.04799997806549
to: 10.0239999890327 [s; relative to TRIGTIME]
Fluence
Peak Flux (peak 1 second)
Measured from: 0.980000019073486
to: 1.98000001907349 [s; relative to TRIGTIME]
Total Fluence
Measured from: -14.8080000281334
to: 29.7360000014305 [s; relative to TRIGTIME]
Band 1 Band 2 Band 3 Band 4
15-25 25-50 50-100 100-350 keV
Total 0.320662 0.261755 0.091890 0.018347
0.031981 0.032760 0.028976 0.026724 [error]
Peak 0.019455 0.031587 0.018712 0.000883
0.005210 0.005266 0.004646 0.004085 [error]
[ fluence units of on-axis counts / fully illuminated detector ]
======================================================================
====== Table of the duration information =============================
Value tstart tstop
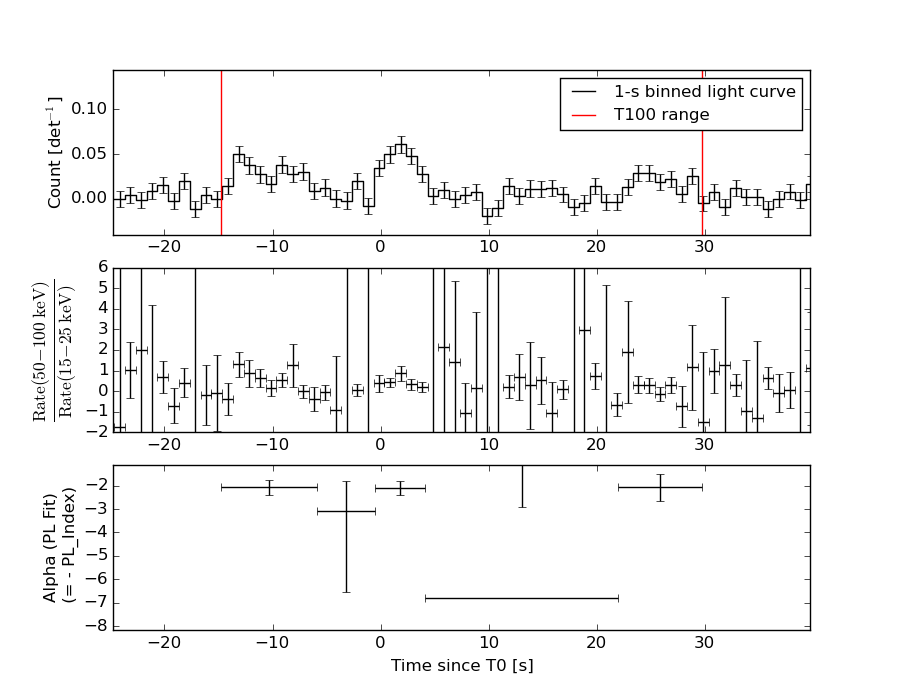
T100 44.544 -14.808 29.736
T90 40.896 -13.400 27.496
T50 19.072 -9.048 10.024
Peak 1.000 0.980 1.980
====== Spectral Analysis Summary =====================================
Model : spectral model: simple power-law (PL) and cutoff power-law (CPL)
Ph_index : photon index: E^{Ph_index}
Ph_90err : 90% error of the photon index
Epeak : Epeak in keV
Epeak_90err: 90% error of Epeak
Norm : normalization at 50 keV in both the PL model and CPL model
Nomr_90err : 90% error of the normalization
chi2 : Chi-Squared
dof : degree of freedo
=== Time-averaged spectral analysis ===
(Best model with acceptable fit: PL)
Model Ph_index Ph_90err_low Ph_90err_hi Epeak Epeak_90err_low Epeak_90err_hi Norm Nomr_90err_low Norm_90err_hi chi2 dof
PL -2.385 -0.320 0.284 - - - 6.95e-04 -1.61e-04 1.59e-04 69.250 57
CPL -1.677 -0.325 1.615 16.248 N/A N/A 1.96e-03 N/A N/A 68.250 56
=== 1-s peak spectral analysis ===
(Best model with acceptable fit: PL)
Model Ph_index Ph_90err_low Ph_90err_hi Epeak Epeak_90err_low Epeak_90err_hi Norm Nomr_90err_low Norm_90err_hi chi2 dof
PL -1.547 -0.347 0.338 - - - 4.35e-03 -9.93e-04 9.77e-04 53.930 57
CPL -0.168 -1.415 2.020 58.346 -17.168 2336.204 2.56e-02 -2.56e-02 3.36e-01 51.180 56
=== Fluence/Peak Flux Summary ===
Model Band1 Band2 Band3 Band4 Band5 Total
15-25 25-50 50-100 100-350 15-150 15-350 keV
Fluence PL 9.14e-08 9.85e-08 7.54e-08 9.44e-08 3.01e-07 3.60e-07 erg/cm2
90%_error_low -1.51e-08 -1.56e-08 -2.26e-08 -4.47e-08 -5.29e-08 -8.01e-08 erg/cm2
90%_error_hi 1.53e-08 1.51e-08 2.48e-08 6.69e-08 5.58e-08 9.76e-08 erg/cm2
Peak flux PL 1.87e-01 1.83e-01 1.25e-01 1.35e-01 5.50e-01 6.30e-01 ph/cm2/s
90%_error_low -5.80e-02 -3.97e-02 -3.53e-02 -6.14e-02 -1.17e-01 -1.37e-01 ph/cm2/s
90%_error_hi 6.21e-02 3.96e-02 3.56e-02 8.67e-02 1.17e-01 1.40e-01 ph/cm2/s
Fluence CPL 8.91e-08 1.06e-07 6.62e-08 2.40e-08 2.78e-07 2.85e-07 erg/cm2
90%_error_low N/A N/A -3.12e-08 N/A -5.53e-08 N/A erg/cm2
90%_error_hi N/A N/A 2.63e-08 N/A 6.36e-08 N/A erg/cm2
Peak flux CPL 1.61e-01 2.15e-01 1.28e-01 3.01e-02 5.28e-01 5.34e-01 ph/cm2/s
90%_error_low -6.59e-02 -5.19e-02 -4.73e-02 -3.01e-02 -1.17e-01 -1.21e-01 ph/cm2/s
90%_error_hi 6.90e-02 5.55e-02 4.31e-02 1.14e-01 1.18e-01 1.39e-01 ph/cm2/s
======================================================================
Image
Pre-slew 15.0-350.0 keV image (Event data)

#   RAcent    DECcent   POSerr    Theta     Phi              Peak Cts       SNR   Name
   56.3380   -66.5779   0.0176     2.6316   -73.5043         0.7161204     10.934 TRIG_00607742

Foreground time interval of the image:
-14.808  29.736 (delta_t =  44.544 [sec])
Background time interval of the image:
-408.347 -392.077 (delta_t =  16.270 [sec])
-239.648 -14.808 (delta_t = 224.840 [sec])
Light Curves
Note: The mask-weighted lightcurves have units of either count/det or counts/sec/det, where a det is 0.4 x 0.4 = 0.16 sq cm.
Full-time range; 1 s binning
Other quick-look light curves:
- 64 ms binning (zoomed)
- 16 ms binning (zoomed)
- 8 ms binning (zoomed)
- 2 ms binning (zoomed)
- SN=5 or 10 s binning (full-time range)
- Raw light curve
Spectra
- 64 ms binning (zoomed)
- 16 ms binning (zoomed)
- 8 ms binning (zoomed)
- 2 ms binning (zoomed)
- SN=5 or 10 s binning (full-time range)
- Raw light curve
Spectra
Notes:
- 1) The fitting includes the systematic errors.
- 2) When the burst includes telescope slew time periods, the fitting uses an average response file made from multiple 5-s response files through out the slew time plus single time preiod for the non-slew times, and weighted by the total counts in the corresponding time period using addrmf. An average response file is needed becuase a spectral fit using the pre-slew DRM will introduce some errors in both a spectral shape and a normalization if the PHA file contains a lot of the slew/post-slew time interval.
- 3) For fits to more complicated models (e.g. a power-law over a cutoff power-law), the BAT team has decided to require a chi-square improvement of more than 6 for each extra dof.
Time averaged spectrum fit using the average DRM
Power-law model
Time interval is from  -14.808 sec. to   29.736 sec.

Spectral model in power-law:
------------------------------------------------------------
Parameters  : value       lower 90%   higher 90%
Photon index: -2.38503     ( -0.320494   0.284369 )
Norm@50keV  : 6.94875E-04    ( -0.000160536   0.000158827 )
------------------------------------------------------------
#Fit statistic : Chi-Squared =          69.25 using 59 PHA bins.
# Reduced chi-squared =          1.215 for     57 degrees of freedom
# Null hypothesis probability =   1.280882e-01

Photon flux (15-150 keV)    in 44.54 sec: 0.127467 ( -0.017157  0.017167 ) ph/cm2/s
Energy fluence (15-150 keV)             : 3.00961e-07 ( -5.29331e-08  5.58108e-08 ) ergs/cm2
Cutoff power-law model

Time interval is from  -14.808 sec. to   29.736 sec.
Spectral model in the cutoff power-law:
------------------------------------------------------------
Parameters  : value       lower 90%   higher 90%
Photon index: -1.67741     ( -0.324957   1.6152 )
Epeak [keV] : 16.2477      (   )
Norm@50keV  : 1.95802E-03    (     )
------------------------------------------------------------
#Fit statistic : Chi-Squared =          68.25 using 59 PHA bins.
# Reduced chi-squared =          1.219 for     56 degrees of freedom
# Null hypothesis probability =   1.262717e-01

Photon flux (15-150 keV)    in 44.54 sec: 0.124762 ( -0.017461  0.017582 ) ph/cm2/s
Energy fluence (15-150 keV)             : 2.78292e-07 ( -5.52786e-08  6.36249e-08 ) ergs/cm2
1-s peak spectrum fit
Power-law model

Time interval is from    0.980 sec. to    1.980 sec.

Spectral model in power-law:
------------------------------------------------------------
Parameters  : value       lower 90%   higher 90%
Photon index: -1.54705     ( -0.347265   0.337849 )
Norm@50keV  : 4.34529E-03    ( -0.000992843   0.000977363 )
------------------------------------------------------------
#Fit statistic : Chi-Squared =          53.93 using 59 PHA bins.
# Reduced chi-squared =         0.9461 for     57 degrees of freedom
# Null hypothesis probability =   5.909909e-01

Photon flux (15-150 keV)    in 1 sec: 0.549640 ( -0.116765  0.116829 ) ph/cm2/s
Energy fluence (15-150 keV)             : 4.0927e-08 ( -9.9471e-09  1.02518e-08 ) ergs/cm2
Cutoff power-law model
Time interval is from    0.980 sec. to    1.980 sec.
Spectral model in the cutoff power-law:
------------------------------------------------------------
Parameters  : value       lower 90%   higher 90%
Photon index: -0.168226     ( -1.41499   2.01974 )
Epeak [keV] : 58.3457      ( -17.1686 2336.21 )
Norm@50keV  : 2.56085E-02    ( -0.0256068   0.336181 )
------------------------------------------------------------
#Fit statistic : Chi-Squared =          51.18 using 59 PHA bins.
# Reduced chi-squared =         0.9139 for     56 degrees of freedom
# Null hypothesis probability =   6.576753e-01

Photon flux (15-150 keV)    in 1 sec: 0.527683 ( -0.117195  0.118349 ) ph/cm2/s
Energy fluence (15-150 keV)             : 3.59186e-08 ( -9.98696e-09  1.1266e-08 ) ergs/cm2
Time-resolved spectra
Distribution
T90 vs. Hardness ratio plot
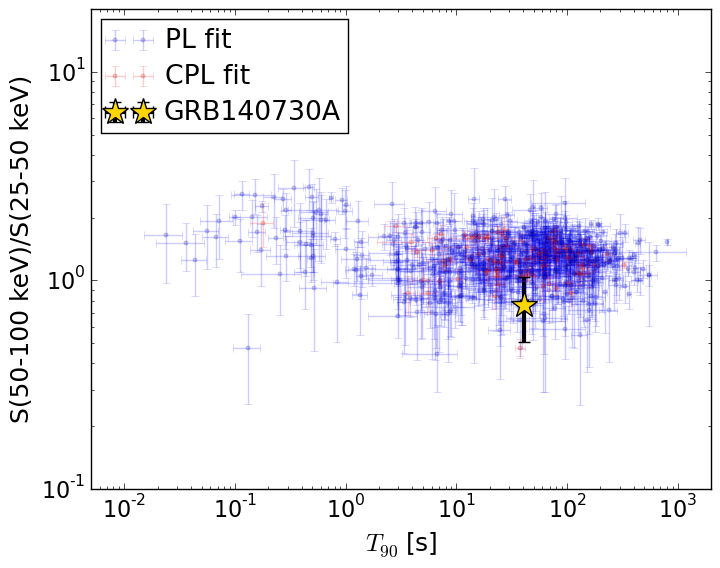
T90                                   = 40.896 sec.
Hardness ratio (energy fluence ratio) = 0.765808213147
S(15-50 keV) vs. S(50-150 keV) plot
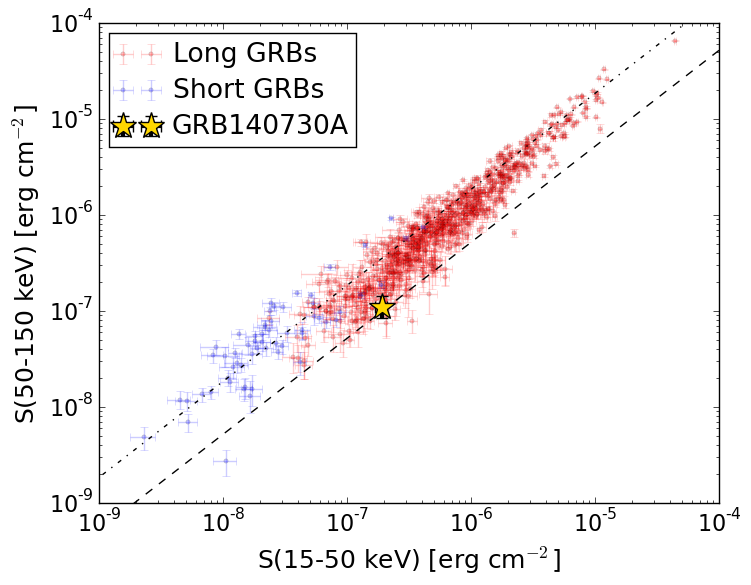
S(15-50 keV)  = 1.8989687e-07
S(50-150 keV) = 1.1106607e-07
The dash-dotted line and the dashed line traces the fluences calculated from the Band function with Epeak = 15 and 150 keV, respectively. Both lines assume a canonical values of alpha = -1 and beta = -2.5.
Mask shadow pattern

IMX = 1.305061566609116E-02, IMY = 4.407026265860486E-02
Spacecraft aspect plot
Bright source in the pre-burst/pre-slew/post-slew images
Pre-burst image of 15-350 keV band
Time interval of the image:
-408.347400 -392.077100
-239.648000 -14.808000

# RAcent  DECcent POSerr Theta    Phi  PeakCts   SNR AngSep     Name
#  [deg]    [deg]    ['] [deg]  [deg]                   [']
170.3042 -60.6656   19.4  45.5  -22.1   0.1846   0.6    2.6	Cen X-3
186.6749 -62.7941    4.0  46.9  -11.1   0.9127   2.9    1.5	GX 301-2
257.2833 -60.7289    2.8  51.1   31.1   4.5034   4.0 ------	UNKNOWN
216.4583 -68.5371    2.5  44.5    7.3   1.4394   4.6 ------	UNKNOWN
182.4889 -67.7225    2.1  41.7  -10.6   1.3562   5.6 ------	UNKNOWN
Pre-slew background subtracted image of 15-350 keV band
Time interval of the image:
-14.808000 29.736000

# RAcent  DECcent POSerr Theta    Phi  PeakCts   SNR AngSep     Name
#  [deg]    [deg]    ['] [deg]  [deg]                   [']
170.4239 -60.6363   12.8  45.5  -22.0   0.1144   0.9    3.3	Cen X-3
186.7062 -62.7524    4.8  46.9  -11.1  -0.3161  -2.4    1.7	GX 301-2
273.5473 -60.7901    2.4  48.6   41.0   1.5596   4.9 ------	UNKNOWN
321.0833 -63.9083    2.3  34.1   65.9   0.6488   5.1 ------	UNKNOWN
 56.3381 -66.5778    1.1   2.6  -73.5   0.7163  10.9 ------	UNKNOWN
 59.8099 -44.4580    2.4  22.8 -147.0   0.3224   4.8 ------	UNKNOWN
129.4628 -61.6580    2.9  32.7  -45.6   0.3787   4.0 ------	UNKNOWN
Post-slew image of 15-350 keV band
Time interval of the image:
47.452600 902.447700

# RAcent  DECcent POSerr Theta    Phi  PeakCts   SNR AngSep     Name
#  [deg]    [deg]    ['] [deg]  [deg]                   [']
170.2343 -60.6682   13.0  43.9  -17.9   0.8372   0.9    3.6	Cen X-3
186.7152 -62.8839    7.1  45.6   -6.7   1.7862   1.6    7.0	GX 301-2
 13.7883 -29.7873    2.2  44.8  145.9   8.6151   5.2 ------	UNKNOWN
 30.5168 -15.0931    2.6  54.2  171.1  12.1417   4.4 ------	UNKNOWN
210.2670 -55.0679    2.8  56.8    4.9  12.7371   4.1 ------	UNKNOWN
208.0184 -67.4602    2.3  44.5    7.4   5.1451   5.0 ------	UNKNOWN
 37.1260 -50.2551    3.0  19.0  162.0   2.2130   3.8 ------	UNKNOWN
 40.3376 -32.7396    2.2  35.1  178.5   3.8961   5.2 ------	UNKNOWN
186.7112 -58.2854    2.5  49.8   -9.2   5.6694   4.5 ------	UNKNOWN
 68.1928 -41.2319    2.2  26.1 -137.2   3.2761   5.2 ------	UNKNOWN
 49.0598  -7.7292    3.0  59.0 -166.1  15.2636   3.9 ------	UNKNOWN