Analysis Summary
Notes:
- 1) No attempt has been made to eliminate the non-significant decimal places.
- 2) This batgrbproduct analysis is done using the HEASARC data.
- 3) This batgrbproduct analysis is using the flight position for the mask-weighting calculation.
======================================================================
BAT GRB EVENT DATA PROCESSING REPORT
Process Script Ver: batgrbproduct v2.46
Process Start Time: Sat Oct 4 21:06:48 EDT 2014
Host Name: batevent1
Current Working Dir: /local/data/batevent/batevent_reproc/trigger609736
======================================================================
Trigger: 00609736 Segment: 000
BAT Trigger Time: 429951733.76 [s; MET]
Trigger Stop: 429951734.784 [s; MET]
UTC: 2014-08-17T07:02:01.353900 [includes UTCF correction]
Where From?: TDRSS position message
BAT
RA: 127.255706670156 Dec: 58.1893395054857 [deg; J2000]
Catalogged Source?: NO
Point Source?: YES
GRB Indicated?: YES [ by BAT flight software ]
Image S/N Ratio: 21.88
Image Trigger?: NO
Rate S/N Ratio: 88.3345911860127 [ if not an image trigger ]
Image S/N Ratio: 21.88
Analysis Position: [ source = BAT ]
RA: 127.255706670156 Dec: 58.1893395054857 [deg; J2000]
Refined Position: [ source = BAT pre-slew burst ]
RA: 127.242430384116 Dec: 58.1908315406751 [deg; J2000]
{ 08h 28m 58.2s , +58d 11' 27.0" }
+/- 0.712907283861705 [arcmin] (estimated 90% radius based on SNR)
+/- 0.193263672856934 [arcmin] (formal 1-sigma fit error)
SNR: 49.3254621336421
Angular difference between the analysis and refined position is 0.429316 arcmin
Partial Coding Fraction: 0.7578125 [ including projection effects ]
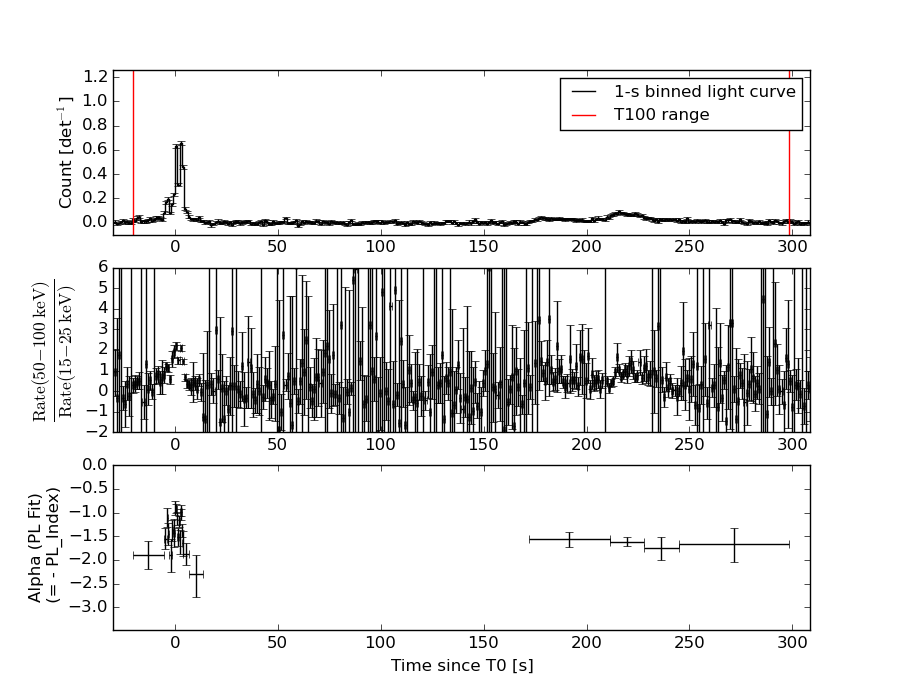
Duration
T90: 258.343999922276 +/- 17.0682669281408
Measured from: -4.39599996805191
to: 253.947999954224 [s; relative to TRIGTIME]
T50: 215.051999926567 +/- 2.33692103305643
Measured from: 0.772000014781952
to: 215.823999941349 [s; relative to TRIGTIME]
Fluence
Peak Flux (peak 1 second)
Measured from: 2.64399999380112
to: 3.64399999380112 [s; relative to TRIGTIME]
Total Fluence
Measured from: -20.3280000090599
to: 298.576000034809 [s; relative to TRIGTIME]
Band 1 Band 2 Band 3 Band 4
15-25 25-50 50-100 100-350 keV
Total 1.955664 2.600225 2.043000 0.479939
0.091197 0.094955 0.083445 0.073652 [error]
Peak 0.145756 0.296217 0.319330 0.086289
0.008188 0.010106 0.010420 0.007428 [error]
[ fluence units of on-axis counts / fully illuminated detector ]
======================================================================
====== Table of the duration information =============================
Value tstart tstop
T100 318.904 -20.328 298.576
T90 258.344 -4.396 253.948
T50 215.052 0.772 215.824
Peak 1.000 2.644 3.644
====== Spectral Analysis Summary =====================================
Model : spectral model: simple power-law (PL) and cutoff power-law (CPL)
Ph_index : photon index: E^{Ph_index}
Ph_90err : 90% error of the photon index
Epeak : Epeak in keV
Epeak_90err: 90% error of Epeak
Norm : normalization at 50 keV in both the PL model and CPL model
Nomr_90err : 90% error of the normalization
chi2 : Chi-Squared
dof : degree of freedo
=== Time-averaged spectral analysis ===
(Best model with acceptable fit: PL)
Model Ph_index Ph_90err_low Ph_90err_hi Epeak Epeak_90err_low Epeak_90err_hi Norm Nomr_90err_low Norm_90err_hi chi2 dof
PL -1.469 -0.078 0.078 - - - 1.48e-03 -6.11e-05 6.10e-05 52.790 57
CPL -1.457 -0.088 0.248 2602.840 -2602.840 -2602.840 1.50e-03 -7.47e-05 4.74e-05 52.820 56
=== 1-s peak spectral analysis ===
(Best model with acceptable fit: CPL)
Model Ph_index Ph_90err_low Ph_90err_hi Epeak Epeak_90err_low Epeak_90err_hi Norm Nomr_90err_low Norm_90err_hi chi2 dof
PL -1.048 -0.062 0.062 - - - 6.03e-02 -2.23e-03 2.23e-03 58.620 57
CPL -0.422 -0.266 0.283 146.259 -28.221 63.264 1.14e-01 -2.63e-02 3.64e-02 41.120 56
=== Fluence/Peak Flux Summary ===
Model Band1 Band2 Band3 Band4 Band5 Total
15-25 25-50 50-100 100-350 15-150 15-350 keV
Fluence PL 5.85e-07 1.09e-06 1.58e-06 4.86e-06 4.50e-06 8.12e-06 erg/cm2
90%_error_low -4.57e-08 -5.01e-08 -8.41e-08 -5.61e-07 -2.02e-07 -6.16e-07 erg/cm2
90%_error_hi 4.70e-08 4.99e-08 8.38e-08 6.11e-07 2.03e-07 6.57e-07 erg/cm2
Peak flux PL 4.73e-04 7.21e-03 8.36e-02 7.29e+00 3.79e-01 7.31e+00 ph/cm2/s
90%_error_low N/A N/A N/A N/A N/A N/A ph/cm2/s
90%_error_hi N/A N/A N/A N/A N/A N/A ph/cm2/s
Fluence CPL 5.88e-07 1.09e-06 1.58e-06 5.03e-06 4.51e-06 7.90e-06 erg/cm2
90%_error_low -6.54e-08 -3.85e-08 -8.18e-08 -1.71e-06 -2.48e-07 -1.35e-06 erg/cm2
90%_error_hi 5.13e-08 5.86e-08 9.22e-08 1.52e-07 1.63e-07 8.37e-07 erg/cm2
Peak flux CPL 1.36e+00 2.19e+00 2.22e+00 2.04e+00 6.81e+00 7.82e+00 ph/cm2/s
90%_error_low -1.48e-01 -1.06e-01 -1.07e-01 -3.94e-01 -2.71e-01 -4.82e-01 ph/cm2/s
90%_error_hi 1.52e-01 1.06e-01 1.08e-01 5.10e-01 2.71e-01 5.66e-01 ph/cm2/s
======================================================================
Image
Pre-slew 15.0-350.0 keV image (Event data)
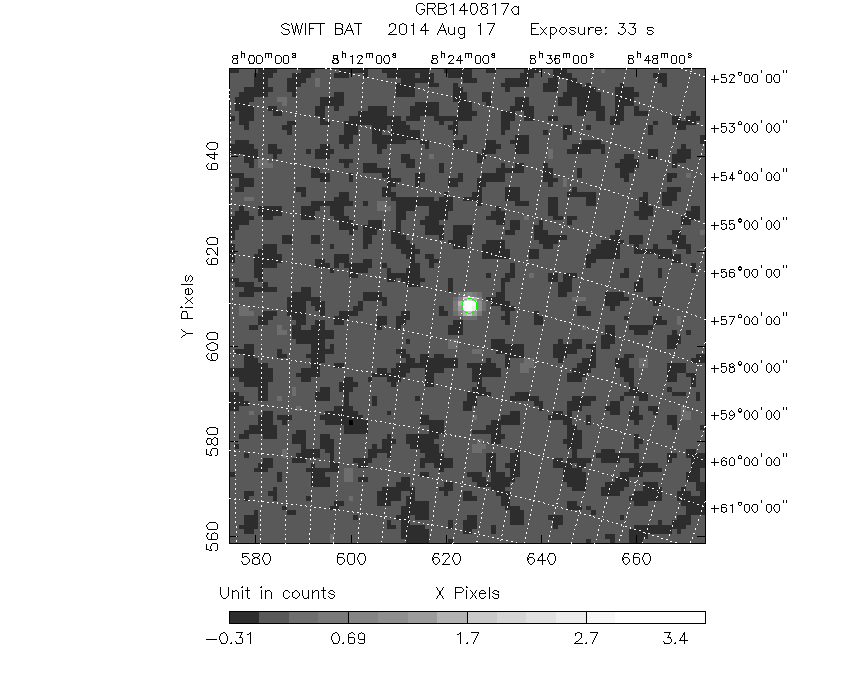
#   RAcent    DECcent   POSerr    Theta     Phi              Peak Cts       SNR   Name
  127.2424    58.1908   0.0039    31.0777   -27.3774         3.9212484     49.325 TRIG_00609736

Foreground time interval of the image:
-20.328  13.141 (delta_t =  33.469 [sec])
Background time interval of the image:
-424.659 -406.185 (delta_t =  18.475 [sec])
-239.760 -20.328 (delta_t = 219.432 [sec])
Light Curves
Note: The mask-weighted lightcurves have units of either count/det or counts/sec/det, where a det is 0.4 x 0.4 = 0.16 sq cm.
Full-time range; 1 s binning
Other quick-look light curves:
- 64 ms binning (zoomed)
- 16 ms binning (zoomed)
- 8 ms binning (zoomed)
- 2 ms binning (zoomed)
- SN=5 or 10 s binning (full-time range)
- Raw light curve
Spectra
- 64 ms binning (zoomed)
- 16 ms binning (zoomed)
- 8 ms binning (zoomed)
- 2 ms binning (zoomed)
- SN=5 or 10 s binning (full-time range)
- Raw light curve
Spectra
Notes:
- 1) The fitting includes the systematic errors.
- 2) When the burst includes telescope slew time periods, the fitting uses an average response file made from multiple 5-s response files through out the slew time plus single time preiod for the non-slew times, and weighted by the total counts in the corresponding time period using addrmf. An average response file is needed becuase a spectral fit using the pre-slew DRM will introduce some errors in both a spectral shape and a normalization if the PHA file contains a lot of the slew/post-slew time interval.
- 3) For fits to more complicated models (e.g. a power-law over a cutoff power-law), the BAT team has decided to require a chi-square improvement of more than 6 for each extra dof.
Time averaged spectrum fit using the average DRM
Power-law model
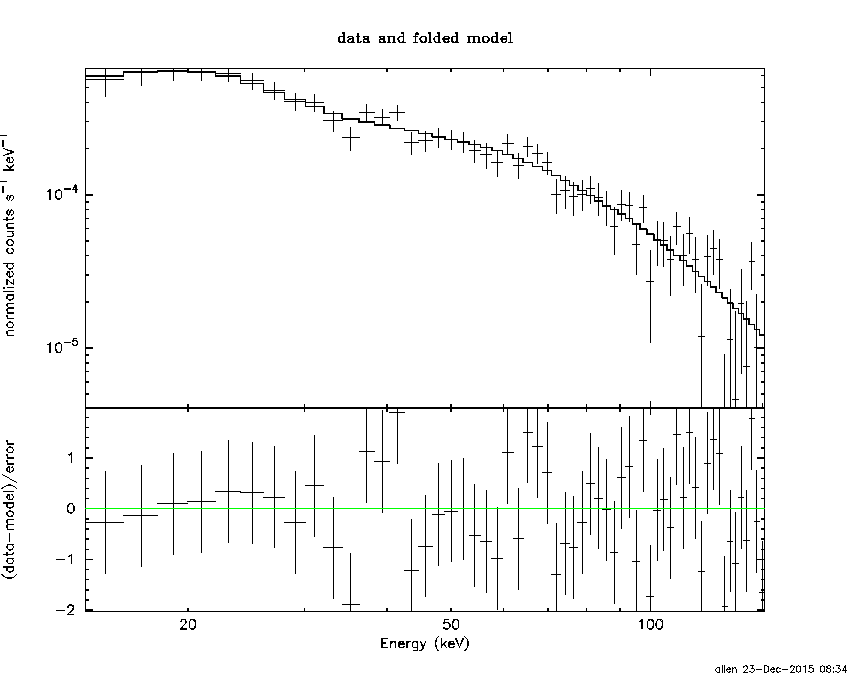
Time interval is from  -20.328 sec. to  298.576 sec.

Spectral model in power-law:
------------------------------------------------------------
Parameters  : value       lower 90%   higher 90%
Photon index: -1.46886     ( -0.0779128   0.077997 )
Norm@50keV  : 1.47809E-03    ( -6.10598e-05   6.0989e-05 )
------------------------------------------------------------
#Fit statistic : Chi-Squared =          52.79 using 59 PHA bins.
# Reduced chi-squared =         0.9261 for     57 degrees of freedom
# Null hypothesis probability =   6.337330e-01

Photon flux (15-150 keV)    in 318.9 sec: 0.183026 ( -0.007964  0.007991 ) ph/cm2/s
Energy fluence (15-150 keV)             : 4.49588e-06 ( -2.02255e-07  2.02998e-07 ) ergs/cm2
Cutoff power-law model

Time interval is from  -20.328 sec. to  298.576 sec.
Spectral model in the cutoff power-law:
------------------------------------------------------------
Parameters  : value       lower 90%   higher 90%
Photon index: -1.46607     ( -0.0878969   0.248061 )
Epeak [keV] : 1.00000E+04      ( -10000 -10000 )
Norm@50keV  : 1.48276E-03    ( -6.13134e-05   6.07311e-05 )
------------------------------------------------------------
#Fit statistic : Chi-Squared =          52.80 using 59 PHA bins.
# Reduced chi-squared =         0.9428 for     56 degrees of freedom
# Null hypothesis probability =   5.969336e-01

Photon flux (15-150 keV)    in 318.9 sec: 0.183443 ( -0.009345  0.008465 ) ph/cm2/s
Energy fluence (15-150 keV)             : 4.508e-06 ( -2.4766e-07  1.63048e-07 ) ergs/cm2
1-s peak spectrum fit
Power-law model
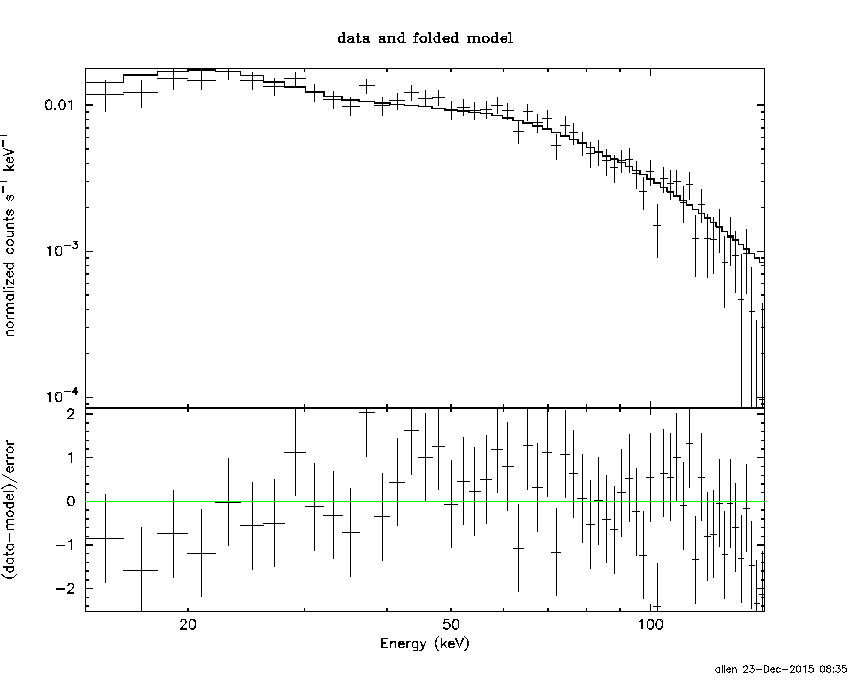
Time interval is from    2.644 sec. to    3.644 sec.

Spectral model in power-law:
------------------------------------------------------------
Parameters  : value       lower 90%   higher 90%
Photon index: -1.04806     ( -0.062098   0.0624252 )
Norm@50keV  : 6.02843E-02    ( -0.00223215   0.00223086 )
------------------------------------------------------------
#Fit statistic : Chi-Squared =          58.62 using 59 PHA bins.
# Reduced chi-squared =          1.028 for     57 degrees of freedom
# Null hypothesis probability =   4.157897e-01

Photon flux (15-150 keV)    in 1 sec: 0.379390 (    ) ph/cm2/s
Energy fluence (15-150 keV)             : 6.41195e-07 ( -2.57064e-08  2.57653e-08 ) ergs/cm2
Cutoff power-law model
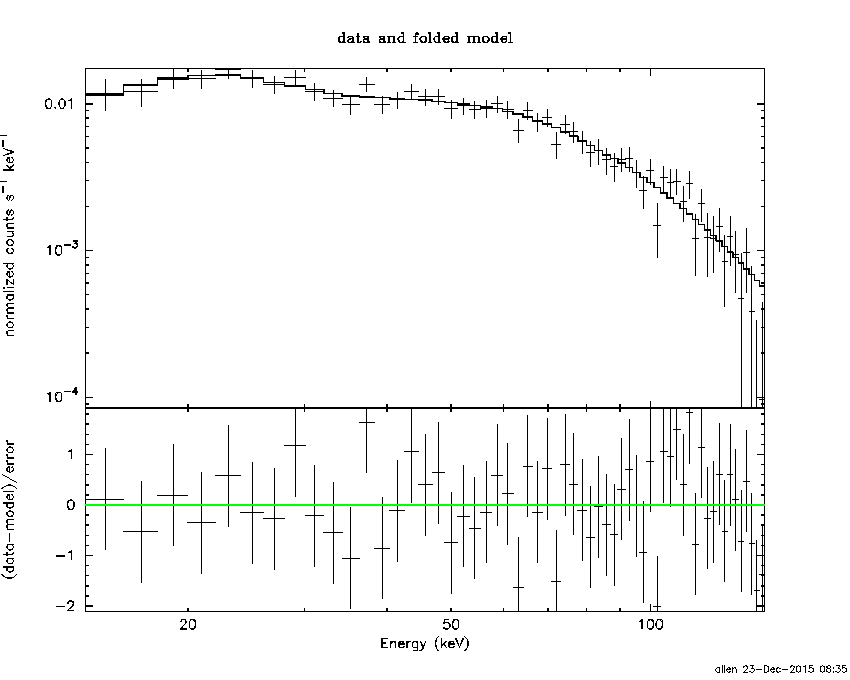
Time interval is from    2.644 sec. to    3.644 sec.
Spectral model in the cutoff power-law:
------------------------------------------------------------
Parameters  : value       lower 90%   higher 90%
Photon index: -0.422173     ( -0.265599   0.282665 )
Epeak [keV] : 146.259      ( -28.221 63.2639 )
Norm@50keV  : 0.113998    ( -0.0263052   0.0364502 )
------------------------------------------------------------
#Fit statistic : Chi-Squared =          41.12 using 59 PHA bins.
# Reduced chi-squared =         0.7343 for     56 degrees of freedom
# Null hypothesis probability =   9.318322e-01

Photon flux (15-150 keV)    in 1 sec: 6.80537 ( -0.27094  0.27111 ) ph/cm2/s
Energy fluence (15-150 keV)             : 6.2647e-07 ( -2.70931e-08  2.70216e-08 ) ergs/cm2
Time-resolved spectra
Distribution
T90 vs. Hardness ratio plot
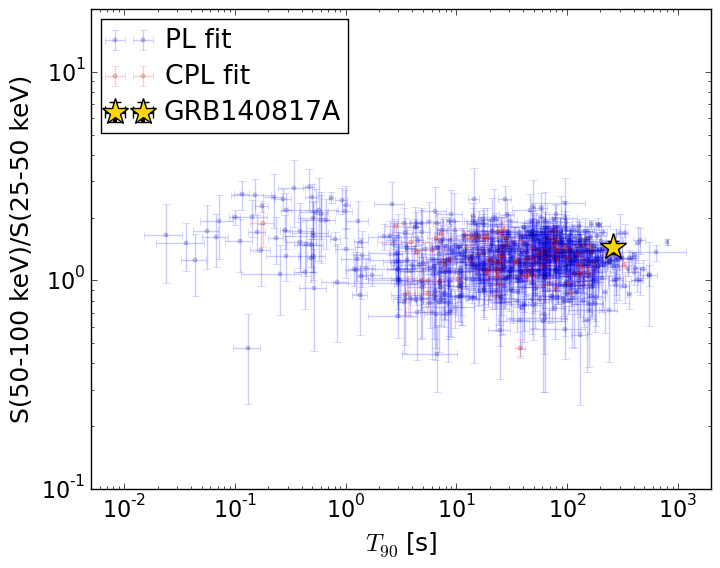
T90                                   = 258.344 sec.
Hardness ratio (energy fluence ratio) = 1.4451072754
S(15-50 keV) vs. S(50-150 keV) plot
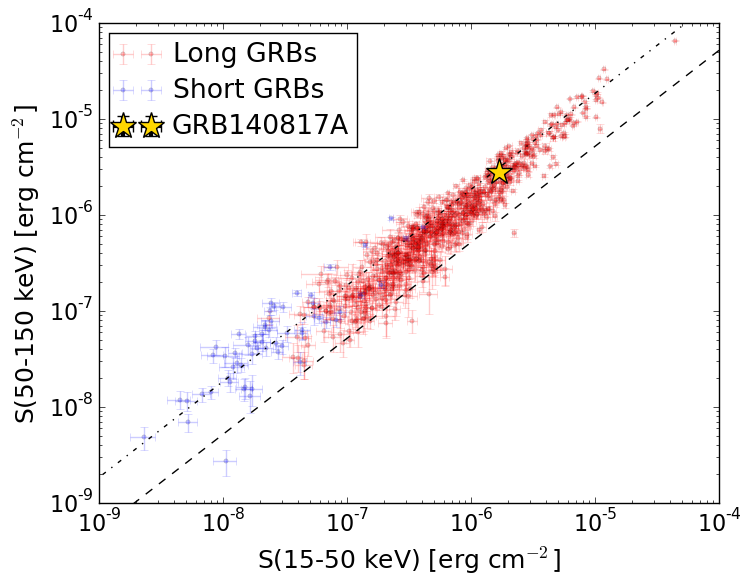
S(15-50 keV)  = 1.6793663e-06
S(50-150 keV) = 2.81647e-06
The dash-dotted line and the dashed line traces the fluences calculated from the Band function with Epeak = 15 and 150 keV, respectively. Both lines assume a canonical values of alpha = -1 and beta = -2.5.
Mask shadow pattern
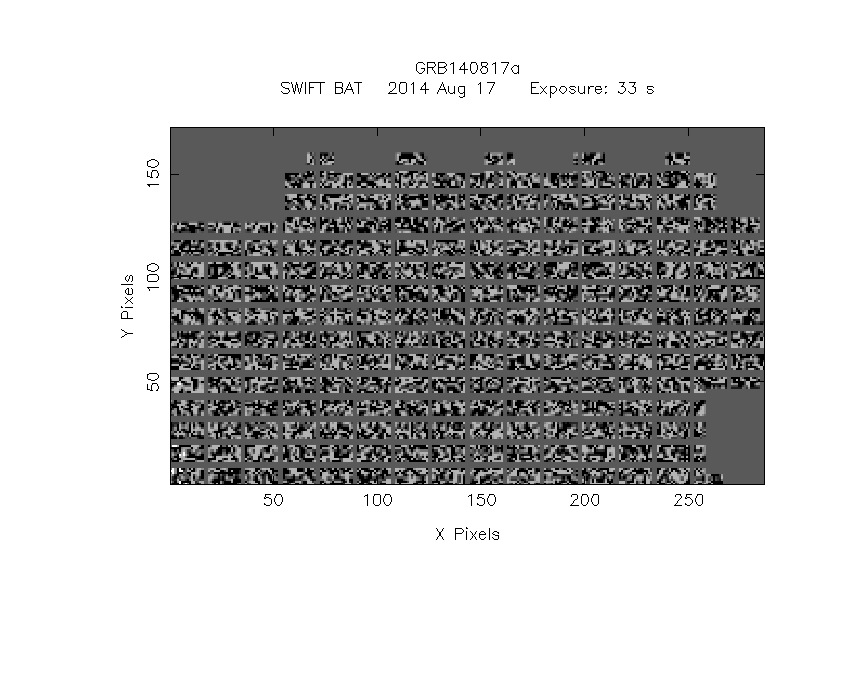
IMX = 5.352035358059961E-01, IMY = 2.771555482262377E-01
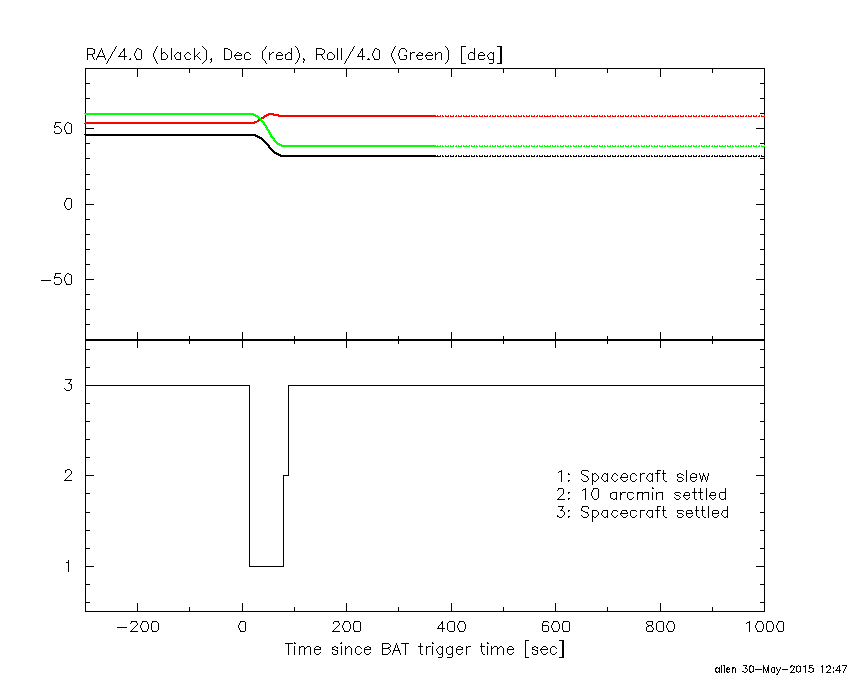
Spacecraft aspect plot
Bright source in the pre-burst/pre-slew/post-slew images
Pre-burst image of 15-350 keV band
Time interval of the image:
-424.659400 -406.184600
-239.760000 -20.328000

# RAcent  DECcent POSerr Theta    Phi  PeakCts   SNR AngSep     Name
#  [deg]    [deg]    ['] [deg]  [deg]                   [']
206.3212  -1.5874    3.4  58.3 -175.6   3.9366   3.4 ------	UNKNOWN
196.0964  -4.7981    3.5  59.3 -163.2   4.3632   3.3 ------	UNKNOWN
Pre-slew background subtracted image of 15-350 keV band
Time interval of the image:
-20.328000 13.140590

# RAcent  DECcent POSerr Theta    Phi  PeakCts   SNR AngSep     Name
#  [deg]    [deg]    ['] [deg]  [deg]                   [']
243.4217  40.8871    2.5  41.1  114.1   1.1560   4.6 ------	UNKNOWN
 79.6382  74.0215    2.5  42.8    7.9   0.5521   4.6 ------	UNKNOWN
127.2424  58.1908    0.2  31.1  -27.4   3.9214  49.3 ------	UNKNOWN
Post-slew image of 15-350 keV band
Time interval of the image:
78.340580 962.320900

# RAcent  DECcent POSerr Theta    Phi  PeakCts   SNR AngSep     Name
#  [deg]    [deg]    ['] [deg]  [deg]                   [']
 83.6332  22.0177    0.5  47.7   -3.9  20.9207  22.6    0.2	Crab
 62.0761  66.8625    3.7  29.7   70.4   2.2394   3.1 ------	UNKNOWN
 73.3653  25.3037    3.4  49.9    9.0   3.7913   3.4 ------	UNKNOWN
207.3119  56.4873    3.1  40.7  172.9   2.6373   3.7 ------	UNKNOWN
195.4208  56.7307    2.4  35.1  178.6   2.6352   4.7 ------	UNKNOWN
127.2352  58.2099    1.2   0.1  119.1   4.1290   9.3 ------	UNKNOWN
209.4260  32.3856    3.2  59.0 -166.2  11.6842   3.7 ------	UNKNOWN
102.7481  13.5334    2.3  48.3  -31.0   5.0040   5.0 ------	UNKNOWN
112.3840   8.6608    3.9  50.8  -44.6   7.1467   3.0 ------	UNKNOWN