Analysis Summary
Notes:
- 1) No attempt has been made to eliminate the non-significant decimal places.
- 2) This batgrbproduct analysis is done using the HEASARC data.
- 3) This batgrbproduct analysis is using the flight position for the mask-weighting calculation.
======================================================================
BAT GRB EVENT DATA PROCESSING REPORT
Process Script Ver: batgrbproduct v2.46
Process Start Time: Sat Oct 4 21:02:44 EDT 2014
Host Name: batevent1
Current Working Dir: /local/data/batevent/batevent_reproc/trigger609885
======================================================================
Trigger: 00609885 Segment: 000
BAT Trigger Time: 430080268.928 [s; MET]
Trigger Stop: 430080270.976 [s; MET]
UTC: 2014-08-18T18:44:16.515620 [includes UTCF correction]
Where From?: TDRSS position message
BAT
RA: 271.147889570597 Dec: -1.36139902602599 [deg; J2000]
Catalogged Source?: NO
Point Source?: YES
GRB Indicated?: YES [ by BAT flight software ]
Image S/N Ratio: 7.63
Image Trigger?: NO
Rate S/N Ratio: 10.8627804912002 [ if not an image trigger ]
Image S/N Ratio: 7.63
Analysis Position: [ source = BAT ]
RA: 271.147889570597 Dec: -1.36139902602599 [deg; J2000]
Refined Position: [ source = BAT pre-slew burst ]
RA: 271.175117118492 Dec: -1.35598151488953 [deg; J2000]
{ 18h 04m 42.0s , -01d 21' 21.5" }
+/- 2.51630366791278 [arcmin] (estimated 90% radius based on SNR)
+/- 1.29646611011694 [arcmin] (formal 1-sigma fit error)
SNR: 8.13953764656927
Angular difference between the analysis and refined position is 1.665226 arcmin
Partial Coding Fraction: 0.3945312 [ including projection effects ]
Duration
T90: 31.5520000457764 +/- 16.0461414097757
Measured from: -2.87199997901917
to: 28.6800000667572 [s; relative to TRIGTIME]
T50: 9.60000002384186 +/- 5.56063881196498
Measured from: -0.824000000953674
to: 8.77600002288818 [s; relative to TRIGTIME]
Fluence
Peak Flux (peak 1 second)
Measured from: 0.308000028133392
to: 1.30800002813339 [s; relative to TRIGTIME]
Total Fluence
Measured from: -3.31999999284744
to: 31.944000005722 [s; relative to TRIGTIME]
Band 1 Band 2 Band 3 Band 4
15-25 25-50 50-100 100-350 keV
Total 0.360988 0.391968 0.258527 0.006326
0.062231 0.055280 0.045902 0.037637 [error]
Peak 0.032646 0.043252 0.039740 0.009858
0.010690 0.009967 0.008433 0.006533 [error]
[ fluence units of on-axis counts / fully illuminated detector ]
======================================================================
====== Table of the duration information =============================
Value tstart tstop
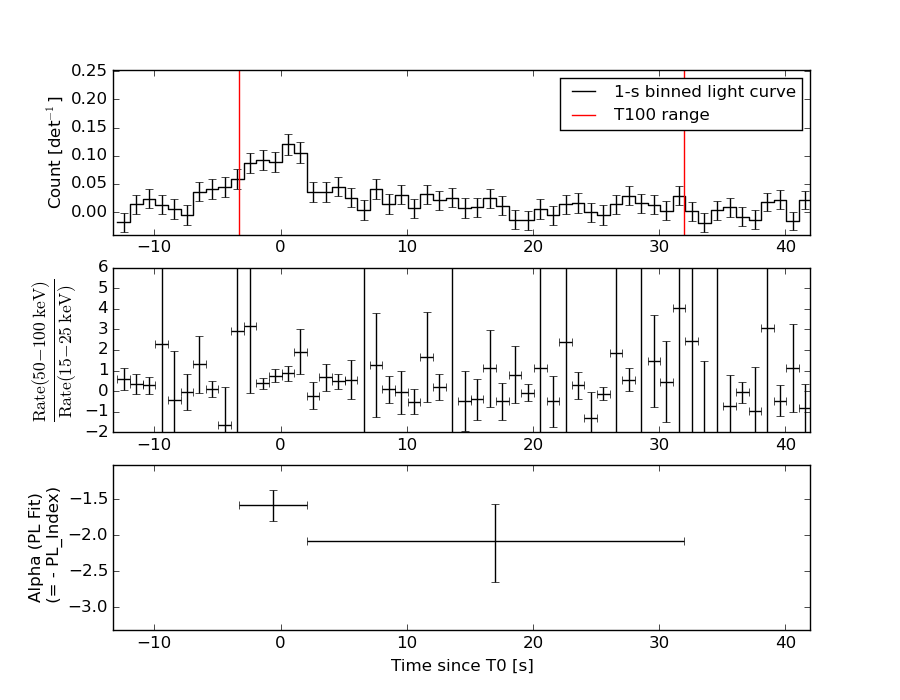
T100 35.264 -3.320 31.944
T90 31.552 -2.872 28.680
T50 9.600 -0.824 8.776
Peak 1.000 0.308 1.308
====== Spectral Analysis Summary =====================================
Model : spectral model: simple power-law (PL) and cutoff power-law (CPL)
Ph_index : photon index: E^{Ph_index}
Ph_90err : 90% error of the photon index
Epeak : Epeak in keV
Epeak_90err: 90% error of Epeak
Norm : normalization at 50 keV in both the PL model and CPL model
Nomr_90err : 90% error of the normalization
chi2 : Chi-Squared
dof : degree of freedo
=== Time-averaged spectral analysis ===
(Best model with acceptable fit: PL)
Model Ph_index Ph_90err_low Ph_90err_hi Epeak Epeak_90err_low Epeak_90err_hi Norm Nomr_90err_low Norm_90err_hi chi2 dof
PL -1.826 -0.281 0.271 - - - 2.00e-03 -3.31e-04 3.23e-04 43.800 57
CPL -1.757 -0.879 1.184 163.936 -163.849 -163.936 2.18e-03 -1.37e-03 7.18e-03 43.790 56
=== 1-s peak spectral analysis ===
(Best model with acceptable fit: PL)
Model Ph_index Ph_90err_low Ph_90err_hi Epeak Epeak_90err_low Epeak_90err_hi Norm Nomr_90err_low Norm_90err_hi chi2 dof
PL -1.622 -0.378 0.367 - - - 8.25e-03 -1.95e-03 1.94e-03 40.380 57
CPL -0.134 -1.529 2.214 66.591 -18.850 1144.879 4.25e-02 -4.25e-02 3.69e-01 37.640 56
=== Fluence/Peak Flux Summary ===
Model Band1 Band2 Band3 Band4 Band5 Total
15-25 25-50 50-100 100-350 15-150 15-350 keV
Fluence PL 1.23e-07 1.85e-07 2.08e-07 4.47e-07 6.50e-07 9.63e-07 erg/cm2
90%_error_low -2.88e-08 -2.80e-08 -4.59e-08 -1.75e-07 -1.07e-07 -2.24e-07 erg/cm2
90%_error_hi 3.04e-08 2.78e-08 4.59e-08 2.39e-07 1.08e-07 2.70e-07 erg/cm2
Peak flux PL 3.81e-01 3.57e-01 2.32e-01 2.33e-01 1.07e+00 1.20e+00 ph/cm2/s
90%_error_low -1.37e-01 -8.97e-02 -6.58e-02 -1.08e-01 -2.58e-01 -2.79e-01 ph/cm2/s
90%_error_hi 1.54e-01 8.86e-02 6.49e-02 1.48e-01 2.60e-01 2.79e-01 ph/cm2/s
Fluence CPL 1.22e-07 1.86e-07 2.09e-07 3.97e-07 6.46e-07 9.13e-07 erg/cm2
90%_error_low -3.30e-08 -2.92e-08 -4.62e-08 -3.20e-07 -1.22e-07 -3.54e-07 erg/cm2
90%_error_hi 3.23e-08 3.62e-08 4.76e-08 8.87e-08 1.11e-07 1.94e-07 erg/cm2
Peak flux CPL 2.76e-01 3.97e-01 2.70e-01 8.08e-02 1.00e+00 1.02e+00 ph/cm2/s
90%_error_low -1.59e-01 -1.07e-01 -8.12e-02 -8.08e-02 -2.64e-01 -2.75e-01 ph/cm2/s
90%_error_hi 1.85e-01 1.10e-01 8.55e-02 1.76e-01 2.68e-01 2.99e-01 ph/cm2/s
======================================================================
Image
Pre-slew 15.0-350.0 keV image (Event data)
#   RAcent    DECcent   POSerr    Theta     Phi              Peak Cts       SNR   Name
  271.1751    -1.3560   0.0236    38.2076    23.3026         0.9660601      8.140 TRIG_00609885

Foreground time interval of the image:
 -3.320  31.773 (delta_t =  35.093 [sec])
Background time interval of the image:
-239.928  -3.320 (delta_t = 236.608 [sec])
Light Curves
Note: The mask-weighted lightcurves have units of either count/det or counts/sec/det, where a det is 0.4 x 0.4 = 0.16 sq cm.
Full-time range; 1 s binning
Other quick-look light curves:
- 64 ms binning (zoomed)
- 16 ms binning (zoomed)
- 8 ms binning (zoomed)
- 2 ms binning (zoomed)
- SN=5 or 10 s binning (full-time range)
- Raw light curve
Spectra
- 64 ms binning (zoomed)
- 16 ms binning (zoomed)
- 8 ms binning (zoomed)
- 2 ms binning (zoomed)
- SN=5 or 10 s binning (full-time range)
- Raw light curve
Spectra
Notes:
- 1) The fitting includes the systematic errors.
- 2) When the burst includes telescope slew time periods, the fitting uses an average response file made from multiple 5-s response files through out the slew time plus single time preiod for the non-slew times, and weighted by the total counts in the corresponding time period using addrmf. An average response file is needed becuase a spectral fit using the pre-slew DRM will introduce some errors in both a spectral shape and a normalization if the PHA file contains a lot of the slew/post-slew time interval.
- 3) For fits to more complicated models (e.g. a power-law over a cutoff power-law), the BAT team has decided to require a chi-square improvement of more than 6 for each extra dof.
Time averaged spectrum fit using the average DRM
Power-law model
Time interval is from   -3.320 sec. to   31.944 sec.

Spectral model in power-law:
------------------------------------------------------------
Parameters  : value       lower 90%   higher 90%
Photon index: -1.8258     ( -0.281262   0.270711 )
Norm@50keV  : 2.00366E-03    ( -0.000330858   0.000323488 )
------------------------------------------------------------
#Fit statistic : Chi-Squared =          43.80 using 59 PHA bins.
# Reduced chi-squared =         0.7684 for     57 degrees of freedom
# Null hypothesis probability =   9.003222e-01

Photon flux (15-150 keV)    in 35.26 sec: 0.278925 ( -0.042983  0.043198 ) ph/cm2/s
Energy fluence (15-150 keV)             : 6.49997e-07 ( -1.06881e-07  1.0834e-07 ) ergs/cm2
Cutoff power-law model
Time interval is from   -3.320 sec. to   31.944 sec.
Spectral model in the cutoff power-law:
------------------------------------------------------------
Parameters  : value       lower 90%   higher 90%
Photon index: -1.75691     ( -0.878384   1.18519 )
Epeak [keV] : 163.936      ( -165.816 -165.902 )
Norm@50keV  : 2.18207E-03    ( -0.00136867   0.00717879 )
------------------------------------------------------------
#Fit statistic : Chi-Squared =          43.79 using 59 PHA bins.
# Reduced chi-squared =         0.7819 for     56 degrees of freedom
# Null hypothesis probability =   8.822538e-01

Photon flux (15-150 keV)    in 35.26 sec: 0.278069 ( -0.044812  0.043813 ) ph/cm2/s
Energy fluence (15-150 keV)             : 6.46206e-07 ( -1.21566e-07  1.11031e-07 ) ergs/cm2
1-s peak spectrum fit
Power-law model
Time interval is from    0.308 sec. to    1.308 sec.

Spectral model in power-law:
------------------------------------------------------------
Parameters  : value       lower 90%   higher 90%
Photon index: -1.62162     ( -0.377977   0.366727 )
Norm@50keV  : 8.24701E-03    ( -0.00195057   0.00193854 )
------------------------------------------------------------
#Fit statistic : Chi-Squared =          40.38 using 59 PHA bins.
# Reduced chi-squared =         0.7083 for     57 degrees of freedom
# Null hypothesis probability =   9.532043e-01

Photon flux (15-150 keV)    in 1 sec: 1.06702 ( -0.257723  0.25991 ) ph/cm2/s
Energy fluence (15-150 keV)             : 7.69449e-08 ( -1.88364e-08  1.90062e-08 ) ergs/cm2
Cutoff power-law model
Time interval is from    0.308 sec. to    1.308 sec.
Spectral model in the cutoff power-law:
------------------------------------------------------------
Parameters  : value       lower 90%   higher 90%
Photon index: -0.134342     ( -1.52891   2.21465 )
Epeak [keV] : 66.5915      ( -18.8571 1144.87 )
Norm@50keV  : 4.24501E-02    ( -0.0424277   0.369418 )
------------------------------------------------------------
#Fit statistic : Chi-Squared =          37.64 using 59 PHA bins.
# Reduced chi-squared =         0.6721 for     56 degrees of freedom
# Null hypothesis probability =   9.717642e-01

Photon flux (15-150 keV)    in 1 sec: 1.00465 ( -0.264071  0.2678 ) ph/cm2/s
Energy fluence (15-150 keV)             : 7.3156e-08 ( -1.87396e-08  1.93479e-08 ) ergs/cm2
Time-resolved spectra
Distribution
T90 vs. Hardness ratio plot
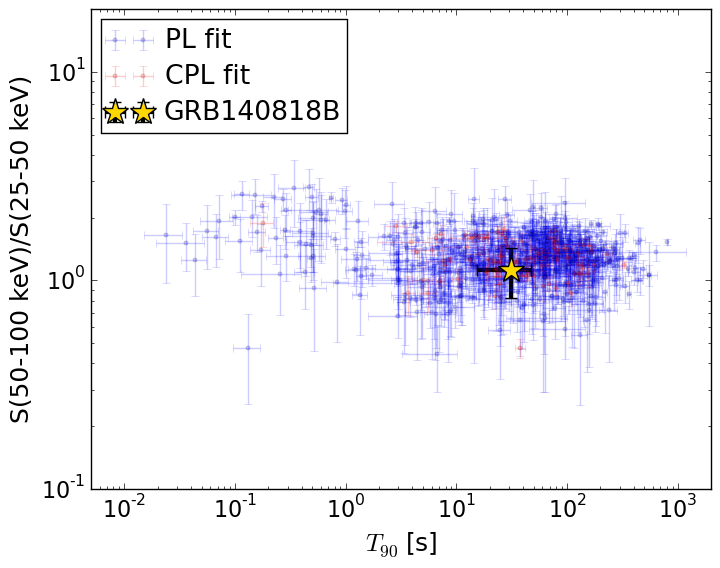
T90                                   = 31.552 sec.
Hardness ratio (energy fluence ratio) = 1.12836612824
S(15-50 keV) vs. S(50-150 keV) plot
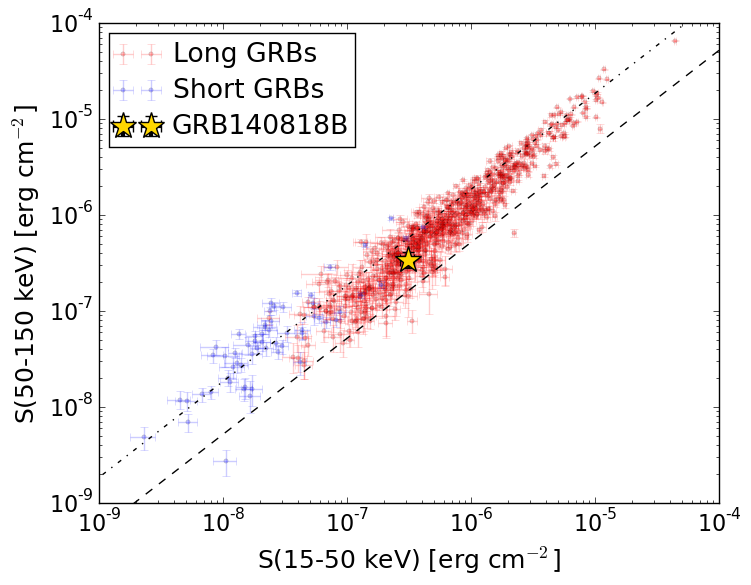
S(15-50 keV)  = 3.073638e-07
S(50-150 keV) = 3.426408e-07
The dash-dotted line and the dashed line traces the fluences calculated from the Band function with Epeak = 15 and 150 keV, respectively. Both lines assume a canonical values of alpha = -1 and beta = -2.5.
Mask shadow pattern
IMX = 7.229298581073229E-01, IMY = -3.113819056099733E-01
Spacecraft aspect plot
Bright source in the pre-burst/pre-slew/post-slew images
Pre-burst image of 15-350 keV band
Time interval of the image:
-239.928000 -3.320000

# RAcent  DECcent POSerr Theta    Phi  PeakCts   SNR AngSep     Name
#  [deg]    [deg]    ['] [deg]  [deg]                   [']
186.8463 -62.6371   32.9  48.8 -142.7  -0.2274  -0.3    9.5	GX 301-2
244.9829 -15.6356    0.2  24.9  -29.5  10.7180  51.3    0.3	Sco X-1
256.1601 -37.7975    7.8   1.6  -94.4   0.3012   1.5    8.7	4U 1700-377
256.5615 -36.4144    4.4   1.8  -44.7   0.5433   2.6    6.1	GX 349+2
263.1551 -24.5866    0.0  13.7   21.5   0.0791   0.4   12.4	GX 1+4
264.5200 -44.3176    5.2   8.2  148.3   0.4449   2.2   12.4	4U 1735-44
268.2186  -1.3102    0.0  37.5   18.6   0.2256   0.8   12.4	SW J1753.5-0127
270.2054 -25.2156    4.1  16.1   44.9   0.6119   3.0    9.2	GX 5-1
270.2914 -25.7174    2.5  15.7   46.2   1.1888   5.9    1.7	GRS 1758-258
274.0212 -14.0358    1.4  27.5   37.0   2.1352   8.4    0.9	GX 17+2
276.0171 -30.3704    4.5  16.5   71.0   0.6185   2.6    4.8	H1820-303
285.1102 -24.9827    7.5  26.1   70.8   0.4917   1.5    5.5	HT1900.1-2455
263.1421 -33.8343    2.7   5.6   50.2   0.9069   4.3    7.6	GX 354-0
262.8872  -1.2749    2.7  36.6    9.9   1.1731   4.3 ------	UNKNOWN
224.0738   2.2309    3.4  50.8  -44.3   3.7459   3.4 ------	UNKNOWN
212.9280 -23.2788    2.0  41.1  -80.9   5.2480   5.9 ------	UNKNOWN
219.9854  -7.2574    3.1  46.0  -56.5   3.9976   3.7 ------	UNKNOWN
Pre-slew background subtracted image of 15-350 keV band
Time interval of the image:
-3.320000 31.772590

# RAcent  DECcent POSerr Theta    Phi  PeakCts   SNR AngSep     Name
#  [deg]    [deg]    ['] [deg]  [deg]                   [']
186.6607 -62.8139    7.3  48.9 -142.9   0.2852   1.6    2.6	GX 301-2
244.9447 -15.6131    6.2  24.9  -29.5  -0.1377  -1.9    2.6	Sco X-1
256.0553 -37.6936    7.6   1.7  -90.6  -0.0918  -1.5    9.6	4U 1700-377
256.2496 -36.4550   17.1   1.9  -50.8  -0.0402  -0.7    9.2	GX 349+2
263.1508 -24.8864    5.5  13.4   21.8   0.1326   2.1   11.4	GX 1+4
264.7319 -44.3004    6.7   8.3  147.4  -0.1088  -1.7    9.0	4U 1735-44
268.2972  -1.4146    8.7  37.4   18.8   0.1437   1.3    4.8	SW J1753.5-0127
270.1236 -25.1008   17.0  16.1   44.4  -0.0487  -0.7    8.8	GX 5-1
270.4719 -25.8421   89.6  15.7   47.0   0.0091   0.1   10.9	GRS 1758-258
273.9328 -14.1884    4.5  27.3   37.0  -0.2058  -2.6   10.1	GX 17+2
276.0999 -30.3571    8.9  16.5   71.1  -0.0924  -1.3    9.1	H1820-303
284.8672 -24.9294   82.3  26.0   70.4   0.0128   0.1    9.2	HT1900.1-2455
263.0599 -33.6799    7.5   5.6   48.6  -0.0951  -1.5    9.9	GX 354-0
271.1752  -1.3560    1.4  38.2   23.3   0.9653   8.1 ------	UNKNOWN
Post-slew image of 15-350 keV band
Time interval of the image:
93.172590 962.171200

# RAcent  DECcent POSerr Theta    Phi  PeakCts   SNR AngSep     Name
#  [deg]    [deg]    ['] [deg]  [deg]                   [']
244.9841 -15.6419    0.3  29.5 -134.7  31.7680  39.0    0.3	Sco X-1
254.4437  35.3688    2.9  39.9  -35.8   3.8617   4.0    1.7	Her X-1
256.1003 -37.9443    9.5  39.1 -175.4   1.0429   1.2    8.1	4U 1700-377
256.6319 -36.3219    0.0  37.5 -174.9   0.7656   0.9   11.3	GX 349+2
262.8818 -24.8677   15.8  24.8 -176.2   0.4176   0.7   10.1	GX 1+4
264.6653 -44.3404    4.1  43.4  172.4  -3.0739  -2.8    7.4	4U 1735-44
268.4857  -1.4937    4.4   2.7 -107.3   1.3623   2.6    7.5	SW J1753.5-0127
270.2991 -25.0920    3.4  23.7  167.6   2.1833   3.4    1.1	GX 5-1
270.2713 -25.7528    3.9  24.4  167.6   1.8583   3.0    1.8	GRS 1758-258
274.0056 -14.0202    0.9  13.0  153.2   6.4930  12.5    1.0	GX 17+2
275.9112 -30.3691    7.3  29.4  157.3   1.2048   1.6    0.7	H1820-303
285.0059 -25.0607    6.6  27.2  137.4   1.3491   1.8    8.6	HT1900.1-2455
288.7821  10.9502    0.6  21.4   40.2  11.8410  18.8    1.0	GRS 1915+105
299.6542  35.2001    2.6  45.2   19.0   5.7135   4.5    3.1	Cyg X-1
308.1082  40.9538   40.1  54.0   19.8   1.0799   0.3    0.1	Cyg X-3
262.9507 -33.8935    4.6  33.4  178.1   1.7258   2.5    4.0	GX 354-0
294.3553 -36.0184    2.5  40.8  136.5   6.3414   4.6 ------	UNKNOWN
300.2434  25.1251    3.6  38.7   30.5   3.2446   3.2 ------	UNKNOWN
281.3026  18.9931    2.5  22.7   11.3   2.3832   4.6 ------	UNKNOWN
267.9598 -26.3513    2.5  25.2  172.4   2.8222   4.6 ------	UNKNOWN
290.9669  51.3911    2.4  55.4    0.6  11.0561   4.8 ------	UNKNOWN
	UNKNOWN
	UNKNOWN