Analysis Summary
Notes:
- 1) No attempt has been made to eliminate the non-significant decimal places.
- 2) This batgrbproduct analysis is done using the HEASARC data.
- 3) This batgrbproduct analysis is using the flight position for the mask-weighting calculation.
======================================================================
BAT GRB EVENT DATA PROCESSING REPORT
Process Script Ver: batgrbproduct v2.46
Process Start Time: Sat Oct 4 20:58:13 EDT 2014
Host Name: batevent1
Current Working Dir: /local/data/batevent/batevent_reproc/trigger610501
======================================================================
Trigger: 00610501 Segment: 000
BAT Trigger Time: 430562440.512 [s; MET]
Trigger Stop: 430562441.536 [s; MET]
UTC: 2014-08-24T08:40:28.076080 [includes UTCF correction]
Where From?: TDRSS position message
BAT
RA: 206.643863339572 Dec: 33.297259588135 [deg; J2000]
Catalogged Source?: NO
Point Source?: YES
GRB Indicated?: YES [ by BAT flight software ]
Image S/N Ratio: 8
Image Trigger?: NO
Rate S/N Ratio: 14.456832294801 [ if not an image trigger ]
Image S/N Ratio: 8
Analysis Position: [ source = BAT ]
RA: 206.643863339572 Dec: 33.297259588135 [deg; J2000]
Refined Position: [ source = BAT pre-slew burst ]
RA: 206.625485358852 Dec: 33.2855974636198 [deg; J2000]
{ 13h 46m 30.1s , +33d 17' 08.2" }
+/- 1.70184385513212 [arcmin] (estimated 90% radius based on SNR)
+/- 0.611122338868167 [arcmin] (formal 1-sigma fit error)
SNR: 14.2309233253832
Angular difference between the analysis and refined position is 1.157230 arcmin
Partial Coding Fraction: 0.734375 [ including projection effects ]
Duration
T90: 3.08399993181229 +/- 0.49061594717433
Measured from: 0.371999979019165
to: 3.45599991083145 [s; relative to TRIGTIME]
T50: 1.58399993181229 +/- 0.332054229285821
Measured from: 0.923999965190887
to: 2.50799989700317 [s; relative to TRIGTIME]
Fluence
Peak Flux (peak 1 second)
Measured from: 0.339999973773956
to: 1.33999997377396 [s; relative to TRIGTIME]
Total Fluence
Measured from: 0.263999998569489
to: 3.63999998569489 [s; relative to TRIGTIME]
Band 1 Band 2 Band 3 Band 4
15-25 25-50 50-100 100-350 keV
Total 0.127270 0.128587 0.061495 0.016438
0.012088 0.012560 0.010766 0.010032 [error]
Peak 0.044785 0.055356 0.027334 0.005897
0.006776 0.007012 0.006180 0.005456 [error]
[ fluence units of on-axis counts / fully illuminated detector ]
======================================================================
====== Table of the duration information =============================
Value tstart tstop
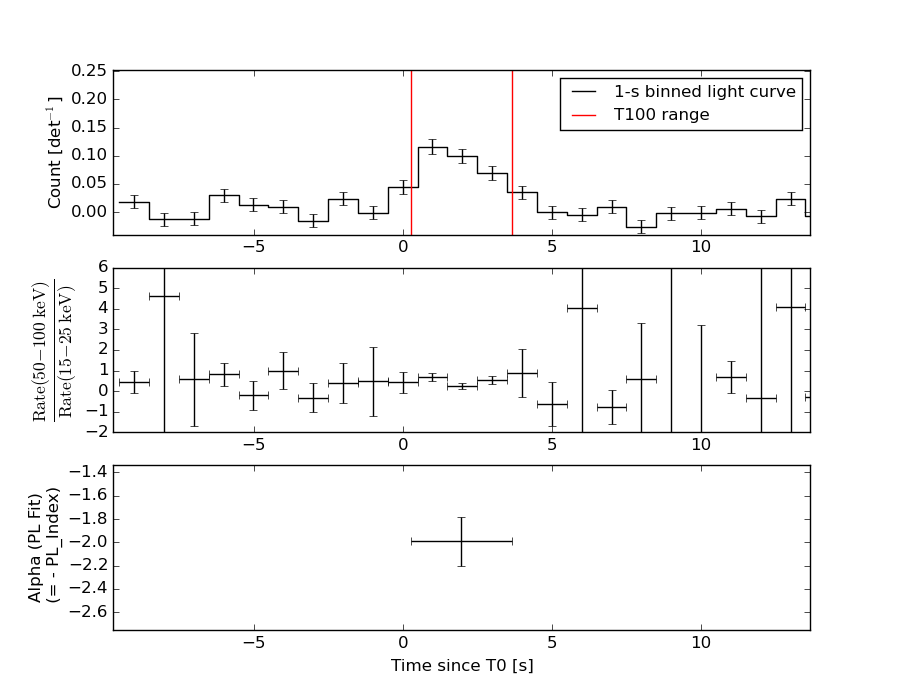
T100 3.376 0.264 3.640
T90 3.084 0.372 3.456
T50 1.584 0.924 2.508
Peak 1.000 0.340 1.340
====== Spectral Analysis Summary =====================================
Model : spectral model: simple power-law (PL) and cutoff power-law (CPL)
Ph_index : photon index: E^{Ph_index}
Ph_90err : 90% error of the photon index
Epeak : Epeak in keV
Epeak_90err: 90% error of Epeak
Norm : normalization at 50 keV in both the PL model and CPL model
Nomr_90err : 90% error of the normalization
chi2 : Chi-Squared
dof : degree of freedo
=== Time-averaged spectral analysis ===
(Best model with acceptable fit: PL)
Model Ph_index Ph_90err_low Ph_90err_hi Epeak Epeak_90err_low Epeak_90err_hi Norm Nomr_90err_low Norm_90err_hi chi2 dof
PL -1.988 -0.214 0.204 - - - 5.88e-03 -8.27e-04 8.06e-04 54.220 57
CPL -2.031 -0.075 1.018 29.796 N/A N/A 5.54e-03 N/A N/A 54.210 56
=== 1-s peak spectral analysis ===
(Best model with acceptable fit: PL)
Model Ph_index Ph_90err_low Ph_90err_hi Epeak Epeak_90err_low Epeak_90err_hi Norm Nomr_90err_low Norm_90err_hi chi2 dof
PL -1.869 -0.274 0.257 - - - 8.27e-03 -1.50e-03 1.46e-03 57.550 57
CPL -0.791 -1.265 1.771 45.645 N/A N/A 3.55e-02 N/A N/A 55.570 56
=== Fluence/Peak Flux Summary ===
Model Band1 Band2 Band3 Band4 Band5 Total
15-25 25-50 50-100 100-350 15-150 15-350 keV
Fluence PL 4.01e-08 5.49e-08 5.53e-08 1.01e-07 1.83e-07 2.51e-07 erg/cm2
90%_error_low -6.04e-09 -5.94e-09 -1.05e-08 -3.36e-08 -2.40e-08 -4.63e-08 erg/cm2
90%_error_hi 6.16e-09 5.93e-09 1.08e-08 4.36e-08 2.46e-08 5.41e-08 erg/cm2
Peak flux PL 4.86e-01 3.93e-01 2.15e-01 1.73e-01 1.17e+00 1.27e+00 ph/cm2/s
90%_error_low -1.00e-01 -5.76e-02 -5.01e-02 -6.67e-02 -1.72e-01 -1.89e-01 ph/cm2/s
90%_error_hi 1.04e-01 5.76e-02 5.11e-02 8.83e-02 1.72e-01 1.90e-01 ph/cm2/s
Fluence CPL 4.03e-08 5.46e-08 5.55e-08 1.13e-07 1.84e-07 2.50e-07 erg/cm2
90%_error_low -6.86e-09 -1.09e-08 -1.06e-08 N/A -2.48e-08 -9.16e-08 erg/cm2
90%_error_hi 6.16e-09 8.70e-09 7.78e-09 N/A 2.25e-08 5.39e-08 erg/cm2
Peak flux CPL 4.43e-01 4.45e-01 2.07e-01 4.42e-02 1.13e+00 1.14e+00 ph/cm2/s
90%_error_low -1.18e-01 -5.73e-02 -6.72e-02 -4.42e-02 -1.78e-01 -1.85e-01 ph/cm2/s
90%_error_hi 1.17e-01 8.87e-02 5.98e-02 1.54e-01 1.79e-01 2.27e-01 ph/cm2/s
======================================================================
Image
Pre-slew 15.0-350.0 keV image (Event data)
#   RAcent    DECcent   POSerr    Theta     Phi              Peak Cts       SNR   Name
  206.6255    33.2856   0.0136    27.7291  -137.5581         0.3223930     14.231 TRIG_00610501

Foreground time interval of the image:
  0.264   3.640 (delta_t =   3.376 [sec])
Background time interval of the image:
-571.111 -556.375 (delta_t =  14.736 [sec])
-239.512   0.264 (delta_t = 239.776 [sec])
Light Curves
Note: The mask-weighted lightcurves have units of either count/det or counts/sec/det, where a det is 0.4 x 0.4 = 0.16 sq cm.
Full-time range; 1 s binning
Other quick-look light curves:
- 64 ms binning (zoomed)
- 16 ms binning (zoomed)
- 8 ms binning (zoomed)
- 2 ms binning (zoomed)
- SN=5 or 10 s binning (full-time range)
- Raw light curve
Spectra
- 64 ms binning (zoomed)
- 16 ms binning (zoomed)
- 8 ms binning (zoomed)
- 2 ms binning (zoomed)
- SN=5 or 10 s binning (full-time range)
- Raw light curve
Spectra
Notes:
- 1) The fitting includes the systematic errors.
- 2) When the burst includes telescope slew time periods, the fitting uses an average response file made from multiple 5-s response files through out the slew time plus single time preiod for the non-slew times, and weighted by the total counts in the corresponding time period using addrmf. An average response file is needed becuase a spectral fit using the pre-slew DRM will introduce some errors in both a spectral shape and a normalization if the PHA file contains a lot of the slew/post-slew time interval.
- 3) For fits to more complicated models (e.g. a power-law over a cutoff power-law), the BAT team has decided to require a chi-square improvement of more than 6 for each extra dof.
Time averaged spectrum fit using the average DRM
Power-law model
Time interval is from    0.264 sec. to    3.640 sec.

Spectral model in power-law:
------------------------------------------------------------
Parameters  : value       lower 90%   higher 90%
Photon index: -1.98807     ( -0.213875   0.20368 )
Norm@50keV  : 5.87742E-03    ( -0.000827155   0.000806478 )
------------------------------------------------------------
#Fit statistic : Chi-Squared =          54.22 using 59 PHA bins.
# Reduced chi-squared =         0.9513 for     57 degrees of freedom
# Null hypothesis probability =   5.799863e-01

Photon flux (15-150 keV)    in 3.376 sec: 0.876876 ( -0.093817  0.09383 ) ph/cm2/s
Energy fluence (15-150 keV)             : 1.82904e-07 ( -2.39785e-08  2.45651e-08 ) ergs/cm2
Cutoff power-law model
Time interval is from    0.264 sec. to    3.640 sec.
Spectral model in the cutoff power-law:
------------------------------------------------------------
Parameters  : value       lower 90%   higher 90%
Photon index: -2.03091     ( -0.0728882   1.02074 )
Epeak [keV] : 29.7964      (   )
Norm@50keV  : 5.54222E-03    (     )
------------------------------------------------------------
#Fit statistic : Chi-Squared =          54.21 using 59 PHA bins.
# Reduced chi-squared =         0.9681 for     56 degrees of freedom
# Null hypothesis probability =   5.427893e-01

Photon flux (15-150 keV)    in 3.376 sec: 0.878433 ( -0.24428  0.09387 ) ph/cm2/s
Energy fluence (15-150 keV)             : 1.83947e-07 ( -2.4758e-08  2.24878e-08 ) ergs/cm2
1-s peak spectrum fit
Power-law model
Time interval is from    0.340 sec. to    1.340 sec.

Spectral model in power-law:
------------------------------------------------------------
Parameters  : value       lower 90%   higher 90%
Photon index: -1.86872     ( -0.27423   0.257005 )
Norm@50keV  : 8.26970E-03    ( -0.00150231   0.00146106 )
------------------------------------------------------------
#Fit statistic : Chi-Squared =          57.55 using 59 PHA bins.
# Reduced chi-squared =          1.010 for     57 degrees of freedom
# Null hypothesis probability =   4.547196e-01

Photon flux (15-150 keV)    in 1 sec: 1.17141 ( -0.171589  0.1716 ) ph/cm2/s
Energy fluence (15-150 keV)             : 7.60379e-08 ( -1.34472e-08  1.38415e-08 ) ergs/cm2
Cutoff power-law model

Time interval is from    0.340 sec. to    1.340 sec.
Spectral model in the cutoff power-law:
------------------------------------------------------------
Parameters  : value       lower 90%   higher 90%
Photon index: -0.79085     ( -1.26579   1.77094 )
Epeak [keV] : 45.6451      (   )
Norm@50keV  : 3.54648E-02    (     )
------------------------------------------------------------
#Fit statistic : Chi-Squared =          55.57 using 59 PHA bins.
# Reduced chi-squared =         0.9923 for     56 degrees of freedom
# Null hypothesis probability =   4.910457e-01

Photon flux (15-150 keV)    in 1 sec: 1.12895 ( -0.178258  0.17906 ) ph/cm2/s
Energy fluence (15-150 keV)             : 6.77704e-08 ( -1.43066e-08  1.67633e-08 ) ergs/cm2
Time-resolved spectra
Distribution
T90 vs. Hardness ratio plot
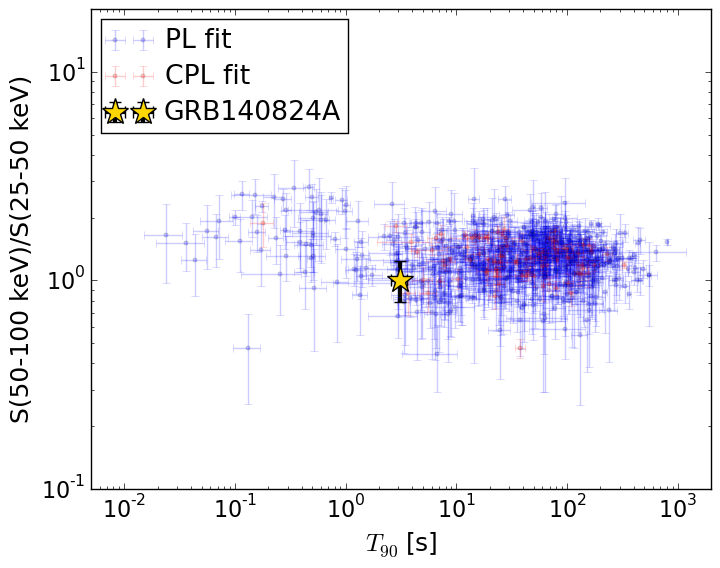
T90                                   = 3.084 sec.
Hardness ratio (energy fluence ratio) = 1.00834655101
S(15-50 keV) vs. S(50-150 keV) plot
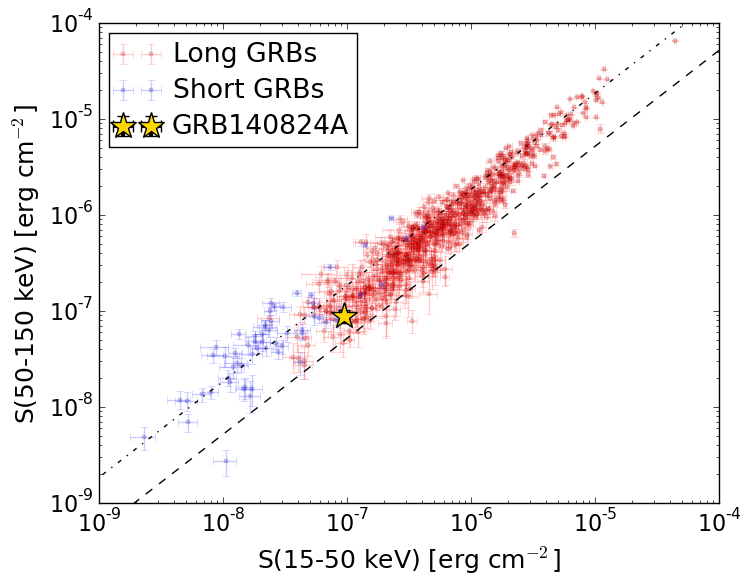
S(15-50 keV)  = 9.501033e-08
S(50-150 keV) = 8.78939e-08
The dash-dotted line and the dashed line traces the fluences calculated from the Band function with Epeak = 15 and 150 keV, respectively. Both lines assume a canonical values of alpha = -1 and beta = -2.5.
Mask shadow pattern
IMX = -3.879169240787561E-01, IMY = 3.547370087916024E-01
Spacecraft aspect plot
Bright source in the pre-burst/pre-slew/post-slew images
Pre-burst image of 15-350 keV band
Time interval of the image:
-571.111390 -556.374900
-239.512000 0.264000

# RAcent  DECcent POSerr Theta    Phi  PeakCts   SNR AngSep     Name
#  [deg]    [deg]    ['] [deg]  [deg]                   [']
254.4164  35.3336    2.1  27.1  129.1   1.4501   5.5    2.1	Her X-1
244.2953   5.3212    2.5  52.4  159.9   4.3873   4.5 ------	UNKNOWN
237.6555  20.5504    3.3  36.3  165.5   0.9953   3.5 ------	UNKNOWN
250.0716  65.8697    3.1  13.8   37.1   0.7472   3.7 ------	UNKNOWN
 41.2806  66.8622    3.5  56.7    2.8   3.4656   3.3 ------	UNKNOWN
235.3429  50.3450    2.9   7.1  144.5   0.7608   4.0 ------	UNKNOWN
192.1409  34.6536    3.0  33.1 -116.0   1.2342   3.9 ------	UNKNOWN
Pre-slew background subtracted image of 15-350 keV band
Time interval of the image:
0.264000 3.640000

# RAcent  DECcent POSerr Theta    Phi  PeakCts   SNR AngSep     Name
#  [deg]    [deg]    ['] [deg]  [deg]                   [']
254.4328  35.2431    6.8  27.2  129.2  -0.0460  -1.7    6.1	Her X-1
264.1628  19.2900    2.6  45.3  129.4   0.3536   4.5 ------	UNKNOWN
242.7857   5.0346    2.7  52.4  161.8   0.3495   4.3 ------	UNKNOWN
206.6255  33.2856    0.8  27.7 -137.6   0.3224  14.2 ------	UNKNOWN
Post-slew image of 15-350 keV band
Time interval of the image:
58.988600 962.549900
1469.488000 1611.692200

# RAcent  DECcent POSerr Theta    Phi  PeakCts   SNR AngSep     Name
#  [deg]    [deg]    ['] [deg]  [deg]                   [']
254.5547  35.3496    4.5  39.2   84.8   7.0078   2.6    4.8	Her X-1
204.5508 -25.6312    2.9  59.0 -166.1  14.0825   4.1 ------	UNKNOWN
133.0755  53.3472    3.8  54.4  -33.1  10.1189   3.0 ------	UNKNOWN