Analysis Summary
Notes:
- 1) No attempt has been made to eliminate the non-significant decimal places.
- 2) This batgrbproduct analysis is done using the HEASARC data.
- 3) This batgrbproduct analysis is using the flight position for the mask-weighting calculation.
======================================================================
BAT GRB EVENT DATA PROCESSING REPORT
Process Script Ver: batgrbproduct v2.46
Process Start Time: Sat Oct 4 20:53:39 EDT 2014
Host Name: batevent1
Current Working Dir: /local/data/batevent/batevent_reproc/trigger610953
======================================================================
Trigger: 00610953 Segment: 000
BAT Trigger Time: 430901666.496 [s; MET]
Trigger Stop: 430901667.52 [s; MET]
UTC: 2014-08-28T06:54:14.043420 [includes UTCF correction]
Where From?: TDRSS position message
BAT
RA: 142.011386710826 Dec: 14.5900409767357 [deg; J2000]
Catalogged Source?: NO
Point Source?: YES
GRB Indicated?: YES [ by BAT flight software ]
Image S/N Ratio: 7.41
Image Trigger?: NO
Rate S/N Ratio: 15.8429795177549 [ if not an image trigger ]
Image S/N Ratio: 7.41
Analysis Position: [ source = BAT ]
RA: 142.011386710826 Dec: 14.5900409767357 [deg; J2000]
Refined Position: [ source = BAT pre-slew burst ]
RA: 142.031859306659 Dec: 14.5707244181277 [deg; J2000]
{ 09h 28m 07.6s , +14d 34' 14.6" }
+/- 1.30925079351341 [arcmin] (estimated 90% radius based on SNR)
+/- 0.456747113227155 [arcmin] (formal 1-sigma fit error)
SNR: 20.6986912271668
Angular difference between the analysis and refined position is 1.660272 arcmin
Partial Coding Fraction: 0.2617188 [ including projection effects ]
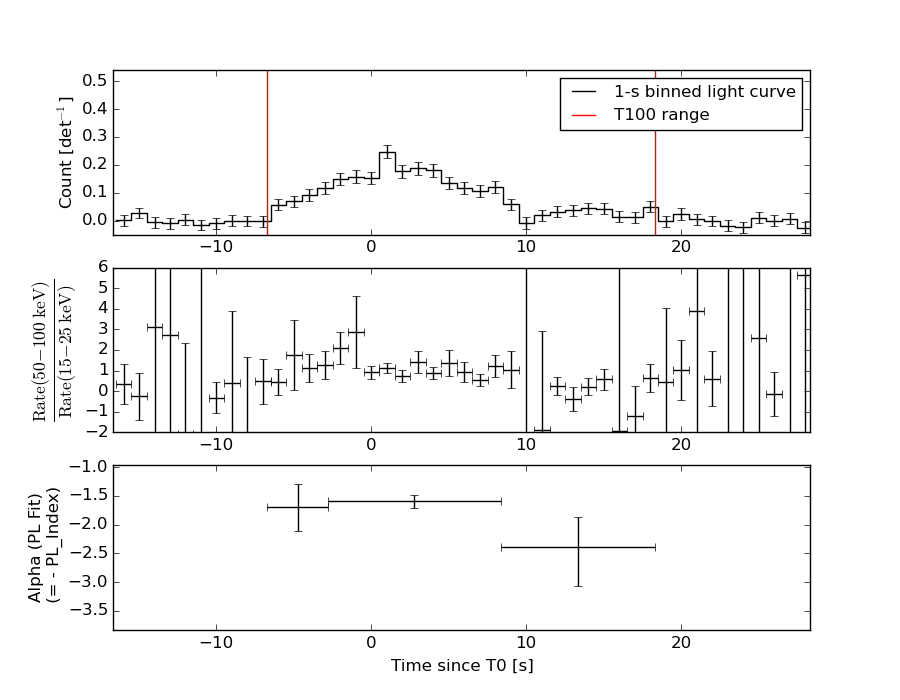
Duration
T90: 19.1480000019073 +/- 4.15046982043008
Measured from: -4.54000002145767
to: 14.6079999804497 [s; relative to TRIGTIME]
T50: 6.97199994325638 +/- 1.23631711278944
Measured from: -0.903999984264374
to: 6.067999958992 [s; relative to TRIGTIME]
Fluence
Peak Flux (peak 1 second)
Measured from: 0.495999991893768
to: 1.49599999189377 [s; relative to TRIGTIME]
Total Fluence
Measured from: -6.70800000429153
to: 18.3159999847412 [s; relative to TRIGTIME]
Band 1 Band 2 Band 3 Band 4
15-25 25-50 50-100 100-350 keV
Total 0.671385 0.942972 0.617877 0.145847
0.054356 0.057814 0.052082 0.046585 [error]
Peak 0.067157 0.104422 0.079420 -0.001374
0.011286 0.012532 0.012194 0.009781 [error]
[ fluence units of on-axis counts / fully illuminated detector ]
======================================================================
====== Table of the duration information =============================
Value tstart tstop
T100 25.024 -6.708 18.316
T90 19.148 -4.540 14.608
T50 6.972 -0.904 6.068
Peak 1.000 0.496 1.496
====== Spectral Analysis Summary =====================================
Model : spectral model: simple power-law (PL) and cutoff power-law (CPL)
Ph_index : photon index: E^{Ph_index}
Ph_90err : 90% error of the photon index
Epeak : Epeak in keV
Epeak_90err: 90% error of Epeak
Norm : normalization at 50 keV in both the PL model and CPL model
Nomr_90err : 90% error of the normalization
chi2 : Chi-Squared
dof : degree of freedo
=== Time-averaged spectral analysis ===
(Best model with acceptable fit: CPL)
Model Ph_index Ph_90err_low Ph_90err_hi Epeak Epeak_90err_low Epeak_90err_hi Norm Nomr_90err_low Norm_90err_hi chi2 dof
PL -1.729 -0.127 0.124 - - - 6.38e-03 -5.02e-04 4.98e-04 65.250 57
CPL -0.795 -0.570 0.654 59.789 -9.443 24.332 2.01e-02 -9.99e-03 2.42e-02 56.840 56
=== 1-s peak spectral analysis ===
(Best model with acceptable fit: PL)
Model Ph_index Ph_90err_low Ph_90err_hi Epeak Epeak_90err_low Epeak_90err_hi Norm Nomr_90err_low Norm_90err_hi chi2 dof
PL -1.715 -0.240 0.228 - - - 1.67e-02 -2.67e-03 2.62e-03 56.090 57
CPL -0.801 -0.864 1.076 60.211 -16.117 154.545 5.27e-02 -5.27e-02 1.52e-01 52.730 56
=== Fluence/Peak Flux Summary ===
Model Band1 Band2 Band3 Band4 Band5 Total
15-25 25-50 50-100 100-350 15-150 15-350 keV
Fluence PL 2.53e-07 4.04e-07 4.88e-07 1.15e-06 1.48e-06 2.30e-06 erg/cm2
90%_error_low -2.79e-08 -2.93e-08 -5.09e-08 -2.29e-07 -1.20e-07 -2.80e-07 erg/cm2
90%_error_hi 2.87e-08 2.93e-08 5.10e-08 2.63e-07 1.21e-07 3.06e-07 erg/cm2
Peak flux PL 8.47e-01 7.50e-01 4.57e-01 4.22e-01 2.23e+00 2.48e+00 ph/cm2/s
90%_error_low -1.71e-01 -1.06e-01 -9.24e-02 -1.44e-01 -3.15e-01 -3.55e-01 ph/cm2/s
90%_error_hi 1.78e-01 1.06e-01 9.26e-02 1.81e-01 3.15e-01 3.58e-01 ph/cm2/s
Fluence CPL 2.23e-07 4.47e-07 4.96e-07 3.29e-07 1.37e-06 1.50e-06 erg/cm2
90%_error_low -3.36e-08 -3.88e-08 -5.85e-08 -1.60e-07 -1.32e-07 -2.08e-07 erg/cm2
90%_error_hi 3.39e-08 3.98e-08 5.79e-08 3.35e-07 1.36e-07 3.48e-07 erg/cm2
Peak flux CPL 7.55e-01 8.36e-01 4.79e-01 1.58e-01 2.18e+00 2.23e+00 ph/cm2/s
90%_error_low -1.95e-01 -1.33e-01 -1.08e-01 -1.58e-01 -3.17e-01 -3.39e-01 ph/cm2/s
90%_error_hi 1.99e-01 1.40e-01 1.08e-01 2.49e-01 3.18e-01 3.69e-01 ph/cm2/s
======================================================================
Image
Pre-slew 15.0-350.0 keV image (Event data)
#   RAcent    DECcent   POSerr    Theta     Phi              Peak Cts       SNR   Name
  142.0319    14.5707   0.0094    38.1020   -60.1641         2.5010720     20.699 TRIG_00610953

Foreground time interval of the image:
 -6.708  18.316 (delta_t =  25.024 [sec])
Background time interval of the image:
-239.496  -6.708 (delta_t = 232.788 [sec])
Light Curves
Note: The mask-weighted lightcurves have units of either count/det or counts/sec/det, where a det is 0.4 x 0.4 = 0.16 sq cm.
Full-time range; 1 s binning
Other quick-look light curves:
- 64 ms binning (zoomed)
- 16 ms binning (zoomed)
- 8 ms binning (zoomed)
- 2 ms binning (zoomed)
- SN=5 or 10 s binning (full-time range)
- Raw light curve
Spectra
- 64 ms binning (zoomed)
- 16 ms binning (zoomed)
- 8 ms binning (zoomed)
- 2 ms binning (zoomed)
- SN=5 or 10 s binning (full-time range)
- Raw light curve
Spectra
Notes:
- 1) The fitting includes the systematic errors.
- 2) When the burst includes telescope slew time periods, the fitting uses an average response file made from multiple 5-s response files through out the slew time plus single time preiod for the non-slew times, and weighted by the total counts in the corresponding time period using addrmf. An average response file is needed becuase a spectral fit using the pre-slew DRM will introduce some errors in both a spectral shape and a normalization if the PHA file contains a lot of the slew/post-slew time interval.
- 3) For fits to more complicated models (e.g. a power-law over a cutoff power-law), the BAT team has decided to require a chi-square improvement of more than 6 for each extra dof.
Time averaged spectrum fit using the average DRM
Power-law model
Time interval is from   -6.708 sec. to   18.316 sec.

Spectral model in power-law:
------------------------------------------------------------
Parameters  : value       lower 90%   higher 90%
Photon index: -1.72921     ( -0.126522   0.123863 )
Norm@50keV  : 6.38423E-03    ( -0.000502301   0.000497927 )
------------------------------------------------------------
#Fit statistic : Chi-Squared =          65.25 using 59 PHA bins.
# Reduced chi-squared =          1.145 for     57 degrees of freedom
# Null hypothesis probability =   2.119278e-01

Photon flux (15-150 keV)    in 25.02 sec: 0.856771 ( -0.062449  0.062508 ) ph/cm2/s
Energy fluence (15-150 keV)             : 1.47604e-06 ( -1.20326e-07  1.21486e-07 ) ergs/cm2
Cutoff power-law model
Time interval is from   -6.708 sec. to   18.316 sec.
Spectral model in the cutoff power-law:
------------------------------------------------------------
Parameters  : value       lower 90%   higher 90%
Photon index: -0.795098     ( -0.570356   0.653584 )
Epeak [keV] : 59.7894      ( -9.44257 24.3325 )
Norm@50keV  : 2.01133E-02    ( -0.00998719   0.0241893 )
------------------------------------------------------------
#Fit statistic : Chi-Squared =          56.84 using 59 PHA bins.
# Reduced chi-squared =          1.015 for     56 degrees of freedom
# Null hypothesis probability =   4.435145e-01

Photon flux (15-150 keV)    in 25.02 sec: 0.823244 ( -0.065624  0.065606 ) ph/cm2/s
Energy fluence (15-150 keV)             : 1.36889e-06 ( -1.32093e-07  1.35666e-07 ) ergs/cm2
1-s peak spectrum fit
Power-law model
Time interval is from    0.496 sec. to    1.496 sec.

Spectral model in power-law:
------------------------------------------------------------
Parameters  : value       lower 90%   higher 90%
Photon index: -1.71495     ( -0.239993   0.228024 )
Norm@50keV  : 1.67282E-02    ( -0.002673   0.00262152 )
------------------------------------------------------------
#Fit statistic : Chi-Squared =          56.09 using 59 PHA bins.
# Reduced chi-squared =         0.9840 for     57 degrees of freedom
# Null hypothesis probability =   5.092634e-01

Photon flux (15-150 keV)    in 1 sec: 2.23352 ( -0.31455  0.31462 ) ph/cm2/s
Energy fluence (15-150 keV)             : 1.54732e-07 ( -2.54703e-08  2.5948e-08 ) ergs/cm2
Cutoff power-law model
Time interval is from    0.496 sec. to    1.496 sec.
Spectral model in the cutoff power-law:
------------------------------------------------------------
Parameters  : value       lower 90%   higher 90%
Photon index: -0.800567     ( -0.864026   1.07626 )
Epeak [keV] : 60.2114      ( -16.1188 154.543 )
Norm@50keV  : 5.27295E-02    ( -0.0527255   0.151759 )
------------------------------------------------------------
#Fit statistic : Chi-Squared =          52.73 using 59 PHA bins.
# Reduced chi-squared =         0.9417 for     56 degrees of freedom
# Null hypothesis probability =   5.992407e-01

Photon flux (15-150 keV)    in 1 sec: 2.18344 ( -0.31736  0.31774 ) ph/cm2/s
Energy fluence (15-150 keV)             : 1.45422e-07 ( -2.65198e-08  2.73805e-08 ) ergs/cm2
Time-resolved spectra
Distribution
T90 vs. Hardness ratio plot
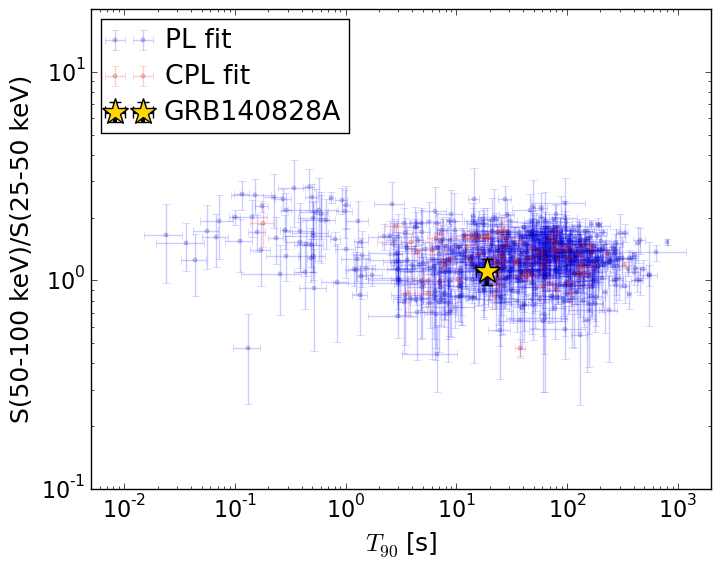
T90                                   = 19.148 sec.
Hardness ratio (energy fluence ratio) = 1.1108105157
S(15-50 keV) vs. S(50-150 keV) plot
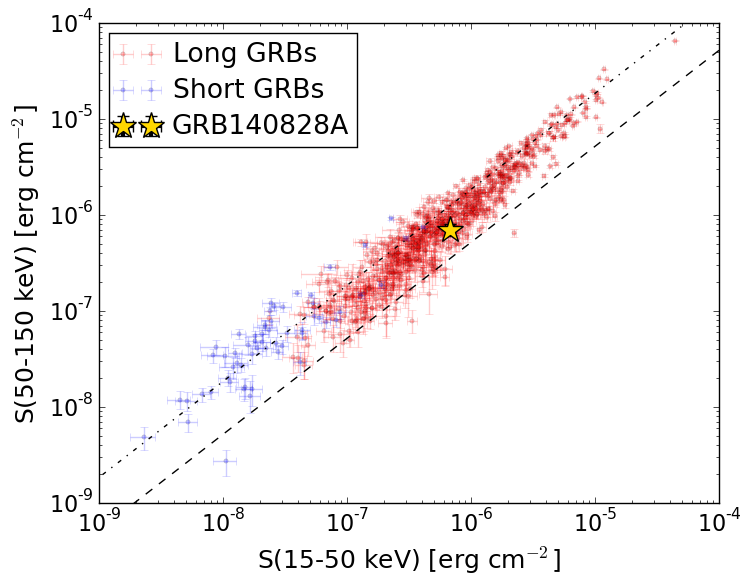
S(15-50 keV)  = 6.698212e-07
S(50-150 keV) = 6.990698e-07
The dash-dotted line and the dashed line traces the fluences calculated from the Band function with Epeak = 15 and 150 keV, respectively. Both lines assume a canonical values of alpha = -1 and beta = -2.5.
Mask shadow pattern
IMX = 3.901322941736836E-01, IMY = 6.802207809030785E-01
Spacecraft aspect plot
Bright source in the pre-burst/pre-slew/post-slew images
Pre-burst image of 15-350 keV band
Time interval of the image:
-239.496000 -6.708000

# RAcent  DECcent POSerr Theta    Phi  PeakCts   SNR AngSep     Name
#  [deg]    [deg]    ['] [deg]  [deg]                   [']
 83.6299  22.0084    0.5  42.7   31.8   9.9746  23.9    0.4	Crab
 92.9809   3.2604    3.1  53.9    8.1   2.9080   3.7 ------	UNKNOWN
223.7665  48.7589    3.1  59.3 -163.3   5.2775   3.7 ------	UNKNOWN
Pre-slew background subtracted image of 15-350 keV band
Time interval of the image:
-6.708000 18.316000

# RAcent  DECcent POSerr Theta    Phi  PeakCts   SNR AngSep     Name
#  [deg]    [deg]    ['] [deg]  [deg]                   [']
 83.4978  22.1172   21.6  42.6   32.0  -0.0649  -0.5    9.7	Crab
 72.2379  26.8873    2.0  46.0   47.5   1.3455   5.7 ------	UNKNOWN
253.1212  74.9958    2.2  50.4  162.8   0.9108   5.2 ------	UNKNOWN
243.8160  80.3096    1.9  45.4  159.4   0.7854   6.1 ------	UNKNOWN
124.7541  29.3537    2.8  20.7  -32.3   0.2211   4.1 ------	UNKNOWN
151.4314  40.8115    2.5  20.7 -106.3   0.3021   4.7 ------	UNKNOWN
114.0465  -8.3612    2.2  59.1  -20.1   1.7338   5.4 ------	UNKNOWN
142.0319  14.5706    0.6  38.1  -60.2   2.5007  20.7 ------	UNKNOWN
Post-slew image of 15-350 keV band
Time interval of the image:
274.204600 815.404610

# RAcent  DECcent POSerr Theta    Phi  PeakCts   SNR AngSep     Name
#  [deg]    [deg]    ['] [deg]  [deg]                   [']
254.3645  35.5112    8.6  44.8   50.6  -2.0026  -1.3   11.1	Her X-1
249.5644  29.3340    3.2  40.1   59.0   3.8592   3.6 ------	UNKNOWN
257.9235  50.6884    4.0  50.9   31.4   5.2275   2.9 ------	UNKNOWN
239.2438  51.9061    2.4  41.2   22.1   2.8450   4.8 ------	UNKNOWN
202.5725 -27.7441    3.0  47.3  176.7   2.4944   3.9 ------	UNKNOWN
206.2435  -5.8254    2.9  25.3  172.8   1.3923   3.9 ------	UNKNOWN
183.4243 -35.2964    2.2  59.0 -166.1  10.5755   5.3 ------	UNKNOWN
175.6977 -29.8293    3.3  57.6 -156.3   8.0730   3.5 ------	UNKNOWN