Analysis Summary
Notes:
- 1) No attempt has been made to eliminate the non-significant decimal places.
- 2) This batgrbproduct analysis is done using the HEASARC data.
- 3) This batgrbproduct analysis is using the flight position for the mask-weighting calculation.
==========================================================================
BAT GROUND-DETECTED GRB DATA PROCESSING REPORT
Process Script Ver: batgrbproduct v2.46
Process Start Time: Mon Oct 5 18:44:23 EDT 2015
Host Name: bat1
Current Working Dir: /local/data/bat1/alien/Swift_3rdBATcatalog/event/ground_detect_bursts/scripts
======================================================================
Trigger: 00611389 Segment: 000
BAT Trigger Time: 431245054.4
UTC: 2014-09-01T06:17:21.931 [includes UTCF correction]
Where From?: Ground analysis (best_duration.txt)
NOTE: BAT trigger time for ground-detected burst is the T100 start time.
Analysis Position: [ source = GCN ]
RA: 112.184 Dec: -29.209 [deg; J2000]
Refined Position: [ source = BAT pre-slew image ]
RA: 112.184 Dec: -29.209 [deg; J2000]
{ 07h 28m 44.2s , -29d -12' -32.4" }
+/- 2.49701658433 [arcmin] (estimated 90% radius based on SNR)
SNR: 8.23057737894
Angular difference between the analysis and refined position is 0.000000 arcmin
Partial Coding Fraction: 0.1855469 [ including projection effects ]
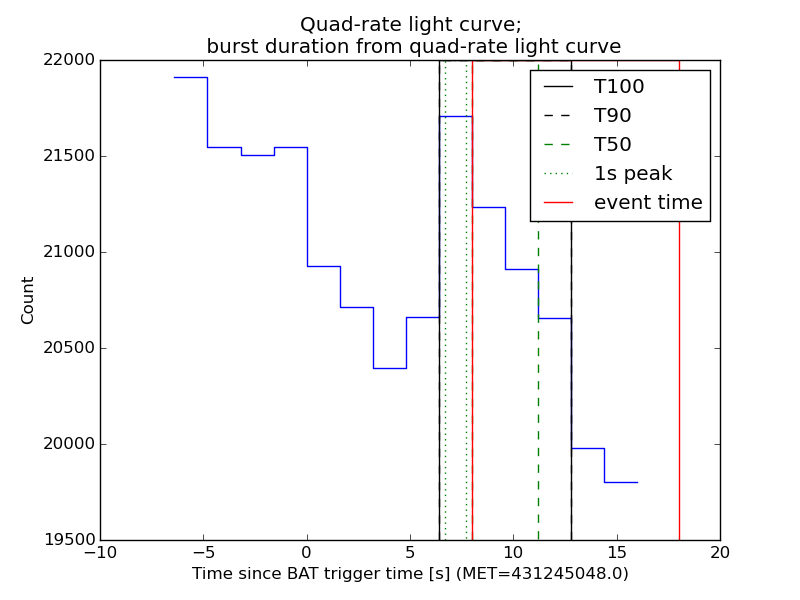
Duration
T90: 6.40000003576279 +/- 1.6
Measured from: 0
to: 6.4 [s; relative to TRIGTIME]
T50: 3.20000004768372 +/- 1.6
Measured from: 1.6
to: 4.8 [s; relative to TRIGTIME]
====== Table of the duration information =============================
Value tstart tstop
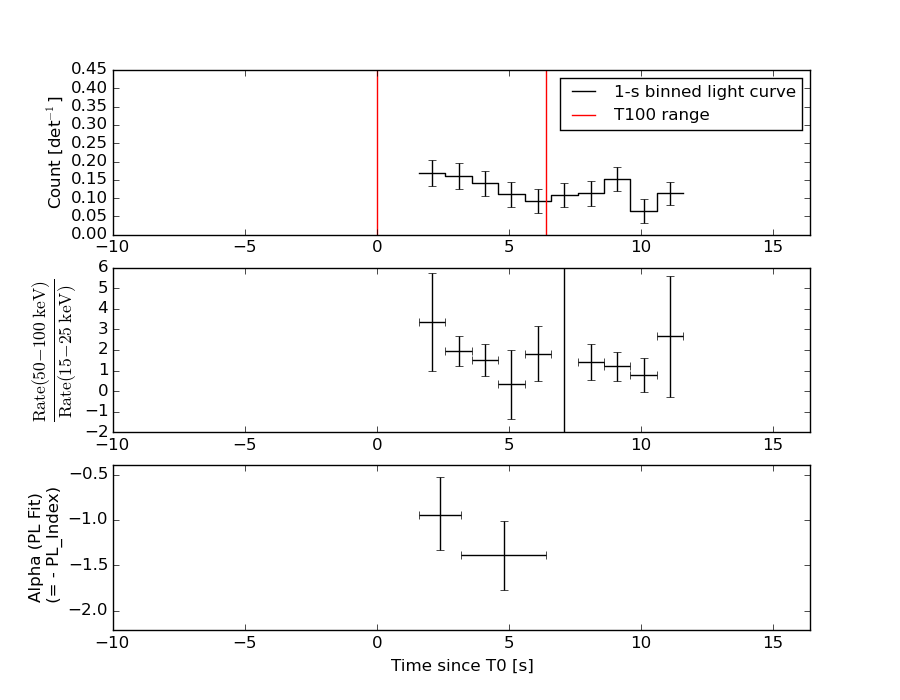
T100 6.400 0.000 6.400
T90 6.400 0.000 6.400
T50 3.200 1.600 4.800
Peak 1.000 0.300 1.300
====== Spectral Analysis Summary =====================================
Model : spectral model: simple power-law (PL) and cutoff power-law (CPL)
Ph_index : photon index: E^{Ph_index}
Ph_90err : 90% error of the photon index
Epeak : Epeak in keV
Epeak_90err: 90% error of Epeak
Norm : normalization at 50 keV in both the PL model and CPL model
Nomr_90err : 90% error of the normalization
chi2 : Chi-Squared
dof : degree of freedo
=== Time-averaged spectral analysis ===
(Best model with acceptable fit: PL)
Model Ph_index Ph_90err_low Ph_90err_hi Epeak Epeak_90err_low Epeak_90err_hi Norm Nomr_90err_low Norm_90err_hi chi2 dof
PL -1.186 -0.275 0.279 - - - 1.09e-02 -1.73e-03 1.73e-03 46.910 57
CPL -0.686 -0.644 1.512 142.328 -142.328 -142.328 1.87e-02 -9.35e-03 7.46e-02 46.390 56
=== 1-s peak spectral analysis ===
(Best model with acceptable fit: N/A)
Model Ph_index Ph_90err_low Ph_90err_hi Epeak Epeak_90err_low Epeak_90err_hi Norm Nomr_90err_low Norm_90err_hi chi2 dof
PL N/A N/A N/A - - - N/A N/A N/A N/A N/A
CPL N/A N/A N/A N/A N/A N/A N/A N/A N/A N/A N/A
=== Fluence/Peak Flux Summary ===
Model Band1 Band2 Band3 Band4 Band5 Total
15-25 25-50 50-100 100-350 15-150 15-350 keV
Fluence PL 4.96e-08 1.11e-07 1.95e-07 8.00e-07 5.31e-07 1.16e-06 erg/cm2
90%_error_low -1.41e-08 -2.02e-08 -3.74e-08 -2.93e-07 -9.41e-08 -3.24e-07 erg/cm2
90%_error_hi 1.54e-08 1.98e-08 3.68e-08 3.91e-07 9.51e-08 4.07e-07 erg/cm2
Peak flux PL N/A N/A N/A N/A N/A N/A ph/cm2/s
Image
15.0-350.0 keV image (Event data)
#RAcent DECcent POSerr Theta  Phi  Peak_Cts  SNR Name
112.184 -29.209 0.000 43.117 -128.593 0.700 8.231 TRIG_00611389

Image time interval: 1.600 to 6.400 [sec]
Light Curves
Note: The mask-weighted lightcurves have units of either count/det or counts/sec/det, where a det is 0.4 x 0.4 = 0.16 sq cm.
Best duration plot
Full-time range; 1 s binning
Other quick-look light curves:
- 64 ms binning (zoomed)
- 16 ms binning (zoomed)
- 8 ms binning (zoomed)
- 2 ms binning (zoomed)
- SN=5 or 10 s binning (full-time range)
- Raw light curve
Spectra
- 64 ms binning (zoomed)
- 16 ms binning (zoomed)
- 8 ms binning (zoomed)
- 2 ms binning (zoomed)
- SN=5 or 10 s binning (full-time range)
- Raw light curve
Spectra
Notes:
- 1) The fitting includes the systematic errors.
- 2) When the burst includes telescope slew time periods, the fitting uses an average response file made from multiple 5-s response files through out the slew time plus single time preiod for the non-slew times, and weighted by the total counts in the corresponding time period using addrmf. An average response file is needed becuase a spectral fit using the pre-slew DRM will introduce some errors in both a spectral shape and a normalization if the PHA file contains a lot of the slew/post-slew time interval.
- 3) For fits to more complicated models (e.g. a power-law over a cutoff power-law), the BAT team has decided to require a chi-square improvement of more than 6 for each extra dof.
Time averaged spectrum fit using the average DRM
Power-law model

Time interval is from    1.600 sec. to    6.400 sec.

Spectral model in power-law:
------------------------------------------------------------
Parameters  : value       lower 90%   higher 90%
Photon index: -1.18563     ( -0.275136   0.278789 )
Norm@50keV  : 1.08655E-02    ( -0.00173135   0.00173131 )
------------------------------------------------------------
#Fit statistic : Chi-Squared =          46.91 using 59 PHA bins.
# Reduced chi-squared =         0.8231 for     57 degrees of freedom
# Null hypothesis probability =   8.272782e-01

Photon flux (15-150 keV)    in 4.8 sec: 1.27287 ( -0.20749  0.20798 ) ph/cm2/s
Energy fluence (15-150 keV)             : 5.31365e-07 ( -9.41333e-08  9.51067e-08 ) ergs/cm2
Cutoff power-law model

Time interval is from    1.600 sec. to    6.400 sec.
Spectral model in the cutoff power-law:
------------------------------------------------------------
Parameters  : value       lower 90%   higher 90%
Photon index: -0.685525     ( -0.644489   1.51216 )
Epeak [keV] : 142.328      ( -142.323 -142.323 )
Norm@50keV  : 1.87304E-02    ( -0.00935111   0.0745978 )
------------------------------------------------------------
#Fit statistic : Chi-Squared =          46.39 using 59 PHA bins.
# Reduced chi-squared =         0.8285 for     56 degrees of freedom
# Null hypothesis probability =   8.163176e-01

Photon flux (15-150 keV)    in 4.8 sec: 1.24814 ( -0.21765  0.21595 ) ph/cm2/s
Energy fluence (15-150 keV)             : 5.16096e-07 ( -1.04396e-07  1.01851e-07 ) ergs/cm2
1-s peak spectrum fit
1-s peak spectrum unavailable, likely because there are no event data in the 1-s peak range.
Time-resolved spectra
Distribution
T90 vs. Hardness ratio plot
T90                                   = N/A sec.
Hardness ratio (energy fluence ratio) = N/A
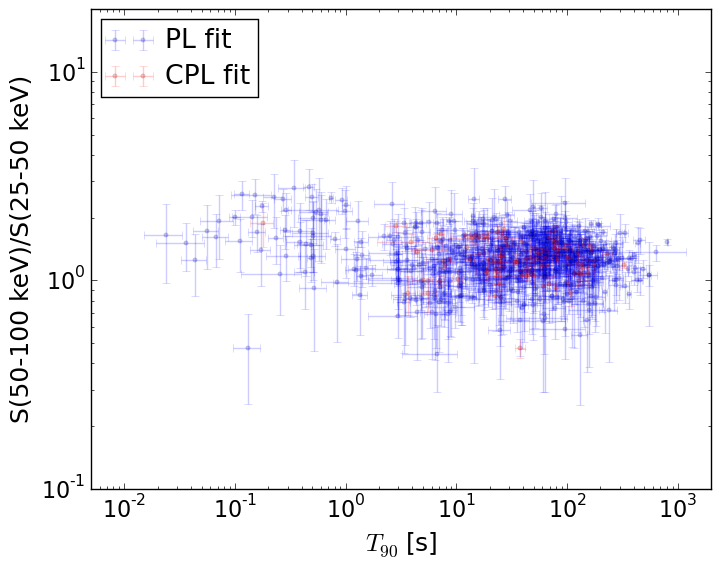
S(15-50 keV) vs. S(50-150 keV) plot
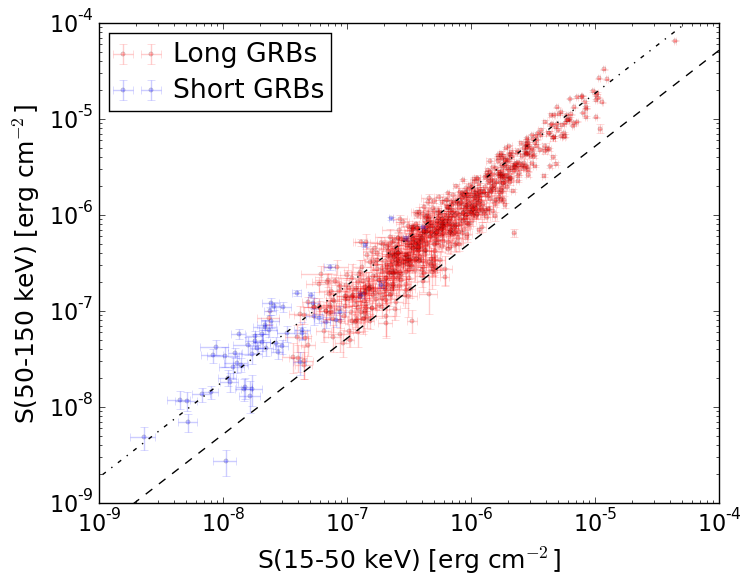
S(15-50 keV)  = N/A
S(50-150 keV) = N/A
The dash-dotted line and the dashed line traces the fluences calculated from the Band function with Epeak = 15 and 150 keV, respectively. Both lines assume a canonical values of alpha = -1 and beta = -2.5.
Mask shadow pattern
IMX = -0.584072525673, IMY = 0.731840705047
Spacecraft aspect plot
Bright source in the event data image
Event data image of 15-350 keV band
Time interval of the image:
1.600000 11.621600

# RAcent  DECcent POSerr Theta    Phi  PeakCts   SNR AngSep     Name
#  [deg]    [deg]    ['] [deg]  [deg]                   [']
135.4016 -40.6121    7.3  38.1  -95.2  -0.2232  -1.6    6.7	Vela X-1
170.5869 -60.6028    4.8  32.9  -44.2   0.1649   2.4    8.1	Cen X-3
186.4934 -62.8334    3.7  35.6  -31.2   0.1887   3.2    5.9	GX 301-2
348.5578 -67.5523    2.2  32.0   64.9   0.4403   5.1 ------	UNKNOWN
112.1954 -29.1992    1.2  43.1 -128.6   1.2211   9.6 ------	UNKNOWN
Webpage updated on:
Tue Nov 24 17:20:30 EST 2015