Analysis Summary
Notes:
- 1) No attempt has been made to eliminate the non-significant decimal places.
- 2) This batgrbproduct analysis is done using the HEASARC data.
- 3) This batgrbproduct analysis is using the flight position for the mask-weighting calculation.
======================================================================
                  BAT GRB EVENT DATA PROCESSING REPORT
    Process Script Ver: batgrbproduct v2.46
    Process Start Time: Sat Oct  4 20:50:06 EDT 2014
             Host Name: batevent1
   Current Working Dir: /local/data/batevent/batevent_reproc/trigger611599
======================================================================

  Trigger: 00611599      Segment: 000

  BAT Trigger Time: 431449242.7   [s; MET]
      Trigger Stop: 431449242.764   [s; MET]
               UTC: 2014-09-03T15:00:30.220440    [includes UTCF correction]
       Where From?: (*SHORT BURST*) TDRSS scaled map message

  BAT
    RA: 238.036254941297   Dec: 27.5784667537245  [deg; J2000]

     Catalogged Source?: NO
     Point Source?:      YES
     GRB Indicated?:     YES    [ by BAT flight software ]
     Image S/N Ratio:    12.57
     Image Trigger?:     NO
     Rate S/N Ratio:     44.4747119158742  [ if not an image trigger ]
     Image S/N Ratio:    12.57

  Analysis Position:   [ source = BAT ]
    RA: 238.036254941297   Dec: 27.5784667537245  [deg; J2000]

  Refined Position:   [ source = BAT pre-slew burst ]
    RA: 238.021220308435   Dec: 27.6075573095436  [deg; J2000]
        { 15h 52m 05.1s , +27d 36' 27.2" }
         +/- 1.0344583871983 [arcmin] (estimated 90% radius based on SNR)
         +/- 0.358108946156831 [arcmin] (formal 1-sigma fit error)
    SNR: 28.980092854165

  Angular difference between the analysis and refined position is 1.919817 arcmin

  Partial Coding Fraction: 0.8359375    [ including projection effects ]

  Duration
     T90: 0.295999944210052 +/- 0.0341760284313824
        Measured from: 0.00400000810623169
                   to: 0.299999952316284     [s; relative to TRIGTIME]
     T50: 0.13999992609024 +/- 0.0178885534162405
        Measured from: 0.0480000376701355
                   to: 0.187999963760376     [s; relative to TRIGTIME]


  Fluence
     Peak Flux  (peak 1 second)
        Measured from: -0.329999983310699
                   to: 0.670000016689301     [s; relative to TRIGTIME]
     Total Fluence
        Measured from: -0.0119999647140503
                   to: 0.34799998998642     [s; relative to TRIGTIME]

             Band 1     Band 2     Band 3     Band 4
              15-25      25-50     50-100    100-350     keV
 Total     0.095249   0.108348   0.054913   0.006811
           0.005642   0.005947   0.004675   0.003230 [error]
 Peak      0.113920   0.116689   0.062991   0.003350
           0.007267   0.007660   0.006110   0.004651 [error]

     [ fluence units of on-axis counts / fully illuminated detector ]

======================================================================


====== Table of the duration information =============================

        Value   tstart    tstop
T100    0.360   -0.012    0.348
T90     0.296    0.004    0.300
T50     0.140    0.048    0.188
Peak    1.000   -0.330    0.670


====== Spectral Analysis Summary =====================================

Model      : spectral model: simple power-law (PL) and cutoff power-law (CPL)
Ph_index   : photon index: E^{Ph_index}
Ph_90err   : 90% error of the photon index
Epeak      : Epeak in keV
Epeak_90err: 90% error of Epeak
Norm       : normalization at 50 keV in both the PL model and CPL model
Nomr_90err : 90% error of the normalization
chi2       : Chi-Squared
dof        : degree of freedo

=== Time-averaged spectral analysis ===
(Best model with acceptable fit: N/A)

Model Ph_index Ph_90err_low Ph_90err_hi  Epeak  Epeak_90err_low  Epeak_90err_hi  Norm       Nomr_90err_low    Norm_90err_hi    chi2    dof
PL      -1.987    -0.122      0.118       -           -               -         4.06e-02     -3.21e-03          3.17e-03      76.070   57
CPL     -1.361    -0.483      0.550       44.169     -12.016        16.195      9.16e-02     -4.20e-02          9.52e-02      71.010   56


=== 1-s peak spectral analysis ===
(Best model with acceptable fit: PL)

Model Ph_index Ph_90err_low Ph_90err_hi  Epeak  Epeak_90err_low  Epeak_90err_hi  Norm       Nomr_90err_low    Norm_90err_hi    chi2    dof
PL      -2.029     -0.144     0.139       -           -               -         1.64e-02     -1.54e-03          1.51e-03      51.790   57
CPL     -1.566     -0.527     0.602       40.250      N/A           N/A         3.00e-02        N/A               N/A         49.550   56


=== Fluence/Peak Flux Summary ===

              Model    Band1     Band2     Band3     Band4     Band5     Total
                       15-25     25-50    50-100    100-350    15-150    15-350    keV
Fluence         PL   2.96e-08  4.04e-08  4.08e-08  7.47e-08  1.35e-07  1.85e-07   erg/cm2
      90%_error_low -2.84e-09 -2.67e-09 -4.34e-09 -1.47e-08 -1.01e-08 -1.97e-08   erg/cm2
      90%_error_hi   2.90e-09  2.67e-09  4.37e-09  1.69e-08  1.02e-08  2.12e-08   erg/cm2
Peak flux       PL   1.12e+00  8.29e-01  4.07e-01  2.83e-01  2.49e+00  2.64e+00   ph/cm2/s
      90%_error_low -1.23e-01 -6.19e-02 -4.99e-02 -6.18e-02 -1.88e-01 -1.98e-01   ph/cm2/s
      90%_error_hi   1.26e-01  6.19e-02  5.03e-02  7.16e-02  1.88e-01  1.98e-01   ph/cm2/s

Fluence        CPL    N/A      N/A      N/A      N/A      N/A      N/A      erg/cm2
      90%_error_low -2.84e-09 -2.67e-09 -4.34e-09 -1.47e-08 -1.01e-08 -1.97e-08   erg/cm2
      90%_error_hi   2.90e-09  2.67e-09  4.37e-09  1.69e-08  1.02e-08  2.12e-08   erg/cm2
Peak flux      CPL   1.07e+00  8.74e-01  4.07e-01  1.54e-01  2.45e+00  2.50e+00   ph/cm2/s
      90%_error_low -1.39e-01 -7.92e-02 -5.43e-02 -7.83e-02 -1.95e-01 -2.16e-01   ph/cm2/s
      90%_error_hi   1.41e-01  8.15e-02  5.39e-02  1.54e-01  1.95e-01  2.39e-01   ph/cm2/s

======================================================================
Image
Pre-slew 15.0-350.0 keV image (Event data)
#   RAcent    DECcent   POSerr    Theta     Phi              Peak Cts       SNR   Name
  238.0212    27.6076   0.0066    16.8108   122.4311         0.2810077     28.980 TRIG_00611599

Foreground time interval of the image:
 -0.012   0.348 (delta_t =   0.360 [sec])
Background time interval of the image:
-153.999  -0.012 (delta_t = 153.987 [sec])
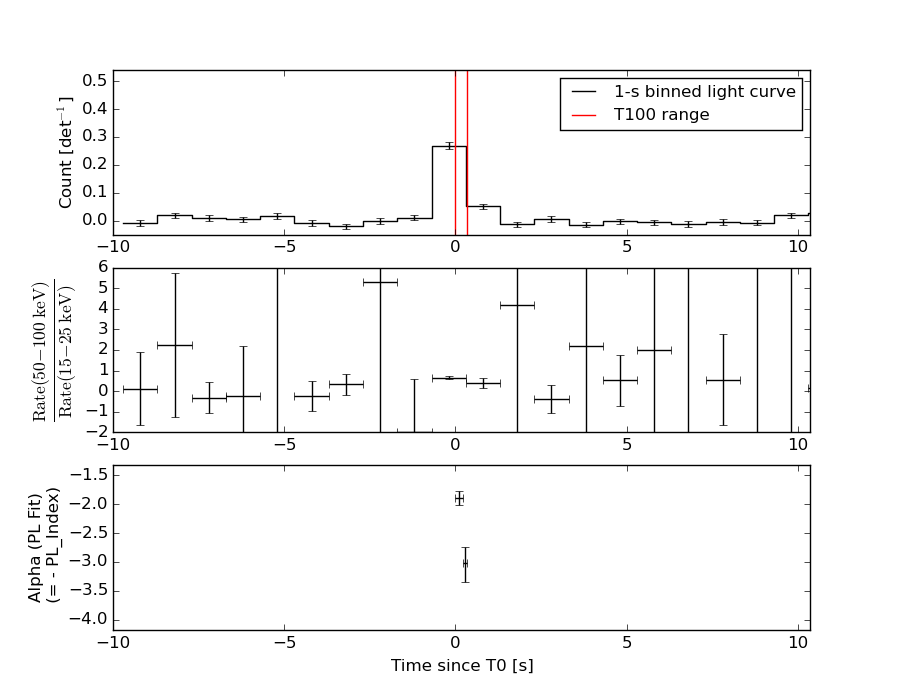
Light Curves
Note: The mask-weighted lightcurves have units of either count/det or counts/sec/det, where a det is 0.4 x 0.4 = 0.16 sq cm.
Full-time range; 1 s binning
Other quick-look light curves:
- 64 ms binning (zoomed)
- 16 ms binning (zoomed)
- 8 ms binning (zoomed)
- 2 ms binning (zoomed)
- SN=5 or 10 s binning (full-time range)
- Raw light curve
Spectra
- 64 ms binning (zoomed)
- 16 ms binning (zoomed)
- 8 ms binning (zoomed)
- 2 ms binning (zoomed)
- SN=5 or 10 s binning (full-time range)
- Raw light curve
Spectra
Notes:
- 1) The fitting includes the systematic errors.
- 2) When the burst includes telescope slew time periods, the fitting uses an average response file made from multiple 5-s response files through out the slew time plus single time preiod for the non-slew times, and weighted by the total counts in the corresponding time period using addrmf. An average response file is needed becuase a spectral fit using the pre-slew DRM will introduce some errors in both a spectral shape and a normalization if the PHA file contains a lot of the slew/post-slew time interval.
- 3) For fits to more complicated models (e.g. a power-law over a cutoff power-law), the BAT team has decided to require a chi-square improvement of more than 6 for each extra dof.
Time averaged spectrum fit using the average DRM
Power-law model
Time interval is from   -0.012 sec. to    0.348 sec.

Spectral model in power-law:
------------------------------------------------------------
Parameters  : value       lower 90%   higher 90%
Photon index: -1.98685     ( -0.121846   0.118378 )
Norm@50keV  : 4.06275E-02    ( -0.00321186   0.0031712 )
------------------------------------------------------------
#Fit statistic : Chi-Squared =          76.07 using 59 PHA bins.
# Reduced chi-squared =          1.335 for     57 degrees of freedom
# Null hypothesis probability =   4.651458e-02

Photon flux (15-150 keV)    in 0.36 sec: 6.05803 ( -0.4074  0.40769 ) ph/cm2/s
Energy fluence (15-150 keV)             : 1.34813e-07 ( -1.0143e-08  1.02384e-08 ) ergs/cm2
Cutoff power-law model
Time interval is from   -0.012 sec. to    0.348 sec.
Spectral model in the cutoff power-law:
------------------------------------------------------------
Parameters  : value       lower 90%   higher 90%
Photon index: -1.36142     ( -0.483178   0.550409 )
Epeak [keV] : 44.1689      ( -12.0154 16.1955 )
Norm@50keV  : 9.15820E-02    ( -0.0419683   0.0952287 )
------------------------------------------------------------
#Fit statistic : Chi-Squared =          71.01 using 59 PHA bins.
# Reduced chi-squared =          1.268 for     56 degrees of freedom
# Null hypothesis probability =   8.538761e-02

Photon flux (15-150 keV)    in 0.36 sec:  (    ) ph/cm2/s
Energy fluence (15-150 keV)             : 0 ( 0  0 ) ergs/cm2
1-s peak spectrum fit
Power-law model
Time interval is from   -0.330 sec. to    0.670 sec.

Spectral model in power-law:
------------------------------------------------------------
Parameters  : value       lower 90%   higher 90%
Photon index: -2.02877     ( -0.144344   0.13888 )
Norm@50keV  : 1.64052E-02    ( -0.00153568   0.00150967 )
------------------------------------------------------------
#Fit statistic : Chi-Squared =          51.79 using 59 PHA bins.
# Reduced chi-squared =         0.9085 for     57 degrees of freedom
# Null hypothesis probability =   6.704179e-01

Photon flux (15-150 keV)    in 1 sec: 2.49411 ( -0.18807  0.18817 ) ph/cm2/s
Energy fluence (15-150 keV)             : 1.51572e-07 ( -1.31771e-08  1.33505e-08 ) ergs/cm2
Cutoff power-law model
Time interval is from   -0.330 sec. to    0.670 sec.
Spectral model in the cutoff power-law:
------------------------------------------------------------
Parameters  : value       lower 90%   higher 90%
Photon index: -1.56553     ( -0.526931   0.602414 )
Epeak [keV] : 40.2502      (   )
Norm@50keV  : 3.00434E-02    (     )
------------------------------------------------------------
#Fit statistic : Chi-Squared =          49.55 using 59 PHA bins.
# Reduced chi-squared =         0.8847 for     56 degrees of freedom
# Null hypothesis probability =   7.161151e-01

Photon flux (15-150 keV)    in 1 sec: 2.44914 ( -0.19454  0.19464 ) ph/cm2/s
Energy fluence (15-150 keV)             : 0 ( 0  0 ) ergs/cm2
Time-resolved spectra
Distribution
T90 vs. Hardness ratio plot
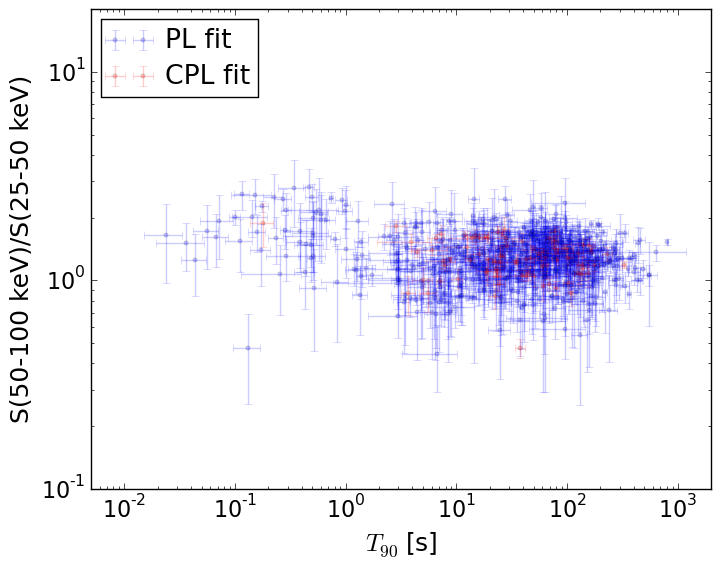
T90                                   = N/A sec.
Hardness ratio (energy fluence ratio) = N/A
S(15-50 keV) vs. S(50-150 keV) plot
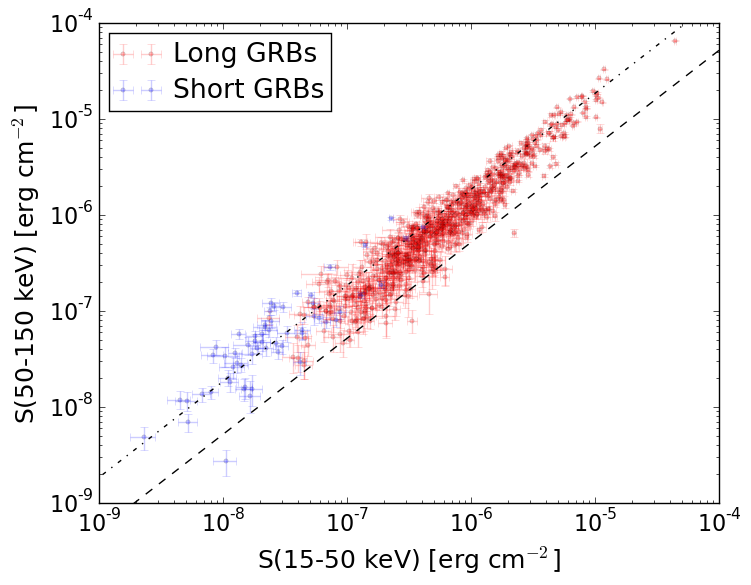
S(15-50 keV)  = N/A
S(50-150 keV) = N/A
The dash-dotted line and the dashed line traces the fluences calculated from the Band function with Epeak = 15 and 150 keV, respectively. Both lines assume a canonical values of alpha = -1 and beta = -2.5.
Mask shadow pattern
IMX = -1.620241102932698E-01, IMY = -2.550032619289736E-01
Spacecraft aspect plot
Bright source in the pre-burst/pre-slew/post-slew images
Pre-burst image of 15-350 keV band
Time interval of the image:
-153.999400 -0.012000

# RAcent  DECcent POSerr Theta    Phi  PeakCts   SNR AngSep     Name
#  [deg]    [deg]    ['] [deg]  [deg]                   [']
254.6661  35.4357    5.2  27.7   89.4  -0.4314  -2.2   11.6	Her X-1
272.9514  43.5229    2.8  40.6   71.6   2.3390   4.1 ------	UNKNOWN
228.3819  19.1458    2.6  17.7  164.4   0.5497   4.4 ------	UNKNOWN
Pre-slew background subtracted image of 15-350 keV band
Time interval of the image:
-0.012000 0.348000

# RAcent  DECcent POSerr Theta    Phi  PeakCts   SNR AngSep     Name
#  [deg]    [deg]    ['] [deg]  [deg]                   [']
254.5994  35.1856    6.8  27.7   90.0  -0.0265  -1.7   11.7	Her X-1
238.0212  27.6076    0.4  16.8  122.4   0.2810  29.0 ------	UNKNOWN
204.6608  19.0780    3.0  21.6 -125.8   0.0370   3.9 ------	UNKNOWN
Post-slew image of 15-350 keV band
Time interval of the image:
47.800600 962.368400

# RAcent  DECcent POSerr Theta    Phi  PeakCts   SNR AngSep     Name
#  [deg]    [deg]    ['] [deg]  [deg]                   [']
244.9742 -15.6414    0.4  43.8  170.5  28.4158  25.9    0.3	Sco X-1
254.3876  35.4999   32.8  16.0   56.5   0.1807   0.4   10.0	Her X-1
268.4907  -1.4930  789.9  41.3  130.0   0.0270   0.0    7.7	SW J1753.5-0127
244.0637 -28.9237    2.5  56.8  173.9  13.5415   4.5 ------	UNKNOWN
248.5759  38.1075    3.4  13.7   37.6   1.9017   3.4 ------	UNKNOWN
184.8288  65.4243    3.6  50.1  -25.5   3.7609   3.2 ------	UNKNOWN
205.5212  19.6617    3.9  30.7  -97.6   2.4357   3.0 ------	UNKNOWN
208.4495   1.6468    3.3  38.4 -127.2   3.3519   3.5 ------	UNKNOWN
202.6122  -6.0754    3.5  48.0 -129.0   9.4978   3.3 ------	UNKNOWN