Analysis Summary
Notes:
- 1) No attempt has been made to eliminate the non-significant decimal places.
- 2) This batgrbproduct analysis is done using the HEASARC data.
- 3) This batgrbproduct analysis is using the flight position for the mask-weighting calculation.
======================================================================
                  BAT GRB EVENT DATA PROCESSING REPORT
    Process Script Ver: batgrbproduct v2.46
    Process Start Time: Mon Oct 13 20:10:13 EDT 2014
             Host Name: bat1
   Current Working Dir: /local/data/bat1/alien/Swift_3rdBATcatalog/event/batevent_reproc/trigger613160
======================================================================

  Trigger: 00613160      Segment: 000

  BAT Trigger Time: 432832528.064   [s; MET]
      Trigger Stop: 432832532.16   [s; MET]
               UTC: 2014-09-19T15:15:15.516440    [includes UTCF correction]
       Where From?: TDRSS position message

  BAT
    RA: 221.555860331452   Dec: -32.1541282696393  [deg; J2000]

     Catalogged Source?: NO
     Point Source?:      YES
     GRB Indicated?:     YES    [ by BAT flight software ]
     Image S/N Ratio:    7.04
     Image Trigger?:     NO
     Rate S/N Ratio:     20.4694894904587  [ if not an image trigger ]
     Image S/N Ratio:    7.04

  Analysis Position:   [ source = BAT ]
    RA: 221.555860331452   Dec: -32.1541282696393  [deg; J2000]

  Refined Position:   [ source = BAT pre-slew burst ]
    RA: 221.541182262144   Dec: -32.1539395605299  [deg; J2000]
        { 14h 46m 09.9s , -32d 09' 14.2" }
         +/- 1.48950594371843 [arcmin] (estimated 90% radius based on SNR)
         +/- 0.63356051943859 [arcmin] (formal 1-sigma fit error)
    SNR: 17.2153231458842

  Angular difference between the analysis and refined position is 0.745691 arcmin

  Partial Coding Fraction: 0.1425781    [ including projection effects ]

  Duration
     T90: 152.304000020027 +/- 21.2798390673805
        Measured from: 3.06400001049042
                   to: 155.368000030518     [s; relative to TRIGTIME]
     T50: 67.6640000343323 +/- 10.0444961564706
        Measured from: 24.472000002861
                   to: 92.1360000371933     [s; relative to TRIGTIME]


  Fluence
     Peak Flux  (peak 1 second)
        Measured from: 38.972000002861
                   to: 39.972000002861     [s; relative to TRIGTIME]
     Total Fluence
        Measured from: -0.744000017642975
                   to: 172.32800000906     [s; relative to TRIGTIME]

             Band 1     Band 2     Band 3     Band 4
              15-25      25-50     50-100    100-350     keV
 Total     2.800911   3.869868   2.795734   0.493909
           0.255922   0.220336   0.189563   0.175312 [error]
 Peak      0.068396   0.115877   0.042527   0.032550
           0.020794   0.019015   0.015401   0.014615 [error]

     [ fluence units of on-axis counts / fully illuminated detector ]

======================================================================


====== Table of the duration information =============================

        Value   tstart    tstop
T100  173.072   -0.744  172.328
T90   152.304    3.064  155.368
T50    67.664   24.472   92.136
Peak    1.000   38.972   39.972


====== Spectral Analysis Summary =====================================

Model      : spectral model: simple power-law (PL) and cutoff power-law (CPL)
Ph_index   : photon index: E^{Ph_index}
Ph_90err   : 90% error of the photon index
Epeak      : Epeak in keV
Epeak_90err: 90% error of Epeak
Norm       : normalization at 50 keV in both the PL model and CPL model
Nomr_90err : 90% error of the normalization
chi2       : Chi-Squared
dof        : degree of freedo

=== Time-averaged spectral analysis ===
(Best model with acceptable fit: PL)

Model Ph_index Ph_90err_low Ph_90err_hi  Epeak  Epeak_90err_low  Epeak_90err_hi  Norm       Nomr_90err_low    Norm_90err_hi    chi2    dof
PL      -1.680    -0.121      0.120       -           -               -         3.85e-03     -2.63e-04          2.62e-04      54.330   57
CPL     -1.252    -0.448      0.510       86.233     -24.087       -86.233      6.34e-03     -2.54e-03          4.97e-03      51.740   56


=== 1-s peak spectral analysis ===
(Best model with acceptable fit: PL)

Model Ph_index Ph_90err_low Ph_90err_hi  Epeak  Epeak_90err_low  Epeak_90err_hi  Norm       Nomr_90err_low    Norm_90err_hi    chi2    dof
PL      -1.978     -0.427     0.394       -           -               -         1.33e-02     -3.69e-03          3.59e-03      69.630   57
CPL      0.657     -2.589     6.480       40.124      N/A           N/A         4.67e-01        N/A               N/A         66.670   56


=== Fluence/Peak Flux Summary ===

              Model    Band1     Band2     Band3     Band4     Band5     Total
                       15-25     25-50    50-100    100-350    15-150    15-350    keV
Fluence         PL   1.01e-06  1.66e-06  2.07e-06  5.14e-06  6.19e-06  9.88e-06   erg/cm2
      90%_error_low -1.15e-07 -1.15e-07 -1.86e-07 -9.29e-07 -4.42e-07 -1.08e-06   erg/cm2
      90%_error_hi   1.19e-07  1.15e-07  1.86e-07  1.06e-06  4.44e-07  1.19e-06   erg/cm2
Peak flux       PL   8.69e-01  6.60e-01  3.35e-01  2.44e-01  1.98e+00  2.11e+00   ph/cm2/s
      90%_error_low -2.93e-01 -1.59e-01 -1.15e-01 -1.30e-01 -4.84e-01 -5.06e-01   ph/cm2/s
      90%_error_hi   3.17e-01  1.59e-01  1.17e-01  1.93e-01  4.86e-01  5.06e-01   ph/cm2/s

Fluence        CPL   9.36e-07  1.73e-06  2.11e-06  2.77e-06  5.97e-06  7.55e-06   erg/cm2
      90%_error_low -1.38e-07 -1.35e-07 -1.99e-07 -1.26e-06 -4.97e-07 -1.36e-06   erg/cm2
      90%_error_hi   1.41e-07  1.38e-07  2.02e-07  2.58e-06  4.98e-07  2.59e-06   erg/cm2
Peak flux      CPL   6.43e-01  8.76e-01  2.66e-01  9.26e-03  1.79e+00  1.80e+00   ph/cm2/s
      90%_error_low -6.43e-01 -2.71e-01 -2.66e-01 -9.26e-03 -5.10e-01 -5.12e-01   ph/cm2/s
      90%_error_hi   3.96e-01  2.71e-01  1.87e-01  2.21e-01  5.30e-01  5.37e-01   ph/cm2/s

======================================================================
Image
Pre-slew 15.0-350.0 keV image (Event data)
#   RAcent    DECcent   POSerr    Theta     Phi              Peak Cts       SNR   Name
  221.5412   -32.1539   0.0111    37.9695   -97.4762        10.3427010     17.215 TRIG_00613160

Foreground time interval of the image:
 -0.744 172.328 (delta_t = 173.072 [sec])
Background time interval of the image:
-239.064  -0.744 (delta_t = 238.320 [sec])
Light Curves
Note: The mask-weighted lightcurves have units of either count/det or counts/sec/det, where a det is 0.4 x 0.4 = 0.16 sq cm.
Full-time range; 1 s binning
Other quick-look light curves:
- 64 ms binning (zoomed)
- 16 ms binning (zoomed)
- 8 ms binning (zoomed)
- 2 ms binning (zoomed)
- SN=5 or 10 s binning (full-time range)
- Raw light curve
Spectra
- 64 ms binning (zoomed)
- 16 ms binning (zoomed)
- 8 ms binning (zoomed)
- 2 ms binning (zoomed)
- SN=5 or 10 s binning (full-time range)
- Raw light curve
Spectra
Notes:
- 1) The fitting includes the systematic errors.
- 2) When the burst includes telescope slew time periods, the fitting uses an average response file made from multiple 5-s response files through out the slew time plus single time preiod for the non-slew times, and weighted by the total counts in the corresponding time period using addrmf. An average response file is needed becuase a spectral fit using the pre-slew DRM will introduce some errors in both a spectral shape and a normalization if the PHA file contains a lot of the slew/post-slew time interval.
- 3) For fits to more complicated models (e.g. a power-law over a cutoff power-law), the BAT team has decided to require a chi-square improvement of more than 6 for each extra dof.
Time averaged spectrum fit using the average DRM
Power-law model
Time interval is from   -0.744 sec. to  172.328 sec.

Spectral model in power-law:
------------------------------------------------------------
Parameters  : value       lower 90%   higher 90%
Photon index: -1.68028     ( -0.121233   0.120246 )
Norm@50keV  : 3.85298E-03    ( -0.000263306   0.000262214 )
------------------------------------------------------------
#Fit statistic : Chi-Squared =          54.33 using 59 PHA bins.
# Reduced chi-squared =         0.9531 for     57 degrees of freedom
# Null hypothesis probability =   5.760370e-01

Photon flux (15-150 keV)    in 173.1 sec: 0.508265 ( -0.035403  0.035528 ) ph/cm2/s
Energy fluence (15-150 keV)             : 6.18625e-06 ( -4.41684e-07  4.44417e-07 ) ergs/cm2
Cutoff power-law model
Time interval is from   -0.744 sec. to  172.328 sec.
Spectral model in the cutoff power-law:
------------------------------------------------------------
Parameters  : value       lower 90%   higher 90%
Photon index: -1.25169     ( -0.448127   0.509858 )
Epeak [keV] : 86.2332      ( -24.0875 -86.2332 )
Norm@50keV  : 6.34368E-03    ( -0.00254416   0.00496884 )
------------------------------------------------------------
#Fit statistic : Chi-Squared =          51.74 using 59 PHA bins.
# Reduced chi-squared =         0.9240 for     56 degrees of freedom
# Null hypothesis probability =   6.365884e-01

Photon flux (15-150 keV)    in 173.1 sec: 0.495435 ( -0.037832  0.037919 ) ph/cm2/s
Energy fluence (15-150 keV)             : 5.97238e-06 ( -4.96842e-07  4.97808e-07 ) ergs/cm2
1-s peak spectrum fit
Power-law model
Time interval is from   38.972 sec. to   39.972 sec.

Spectral model in power-law:
------------------------------------------------------------
Parameters  : value       lower 90%   higher 90%
Photon index: -1.97825     ( -0.427447   0.393283 )
Norm@50keV  : 1.33106E-02    ( -0.00369396   0.00358678 )
------------------------------------------------------------
#Fit statistic : Chi-Squared =          69.63 using 59 PHA bins.
# Reduced chi-squared =          1.222 for     57 degrees of freedom
# Null hypothesis probability =   1.216185e-01

Photon flux (15-150 keV)    in 1 sec: 1.97696 ( -0.4843  0.48629 ) ph/cm2/s
Energy fluence (15-150 keV)             : 1.22651e-07 ( -3.20652e-08  3.28095e-08 ) ergs/cm2
Cutoff power-law model
Time interval is from   38.972 sec. to   39.972 sec.
Spectral model in the cutoff power-law:
------------------------------------------------------------
Parameters  : value       lower 90%   higher 90%
Photon index: 0.656617     ( -2.62956   6.43949 )
Epeak [keV] : 40.1240      (   )
Norm@50keV  : 0.467015    (     )
------------------------------------------------------------
#Fit statistic : Chi-Squared =          66.66 using 59 PHA bins.
# Reduced chi-squared =          1.190 for     56 degrees of freedom
# Null hypothesis probability =   1.557587e-01

Photon flux (15-150 keV)    in 1 sec: 1.79371 ( -0.50953  0.53014 ) ph/cm2/s
Energy fluence (15-150 keV)             : 9.83717e-08 ( -2.864e-08  4.04796e-08 ) ergs/cm2
Time-resolved spectra
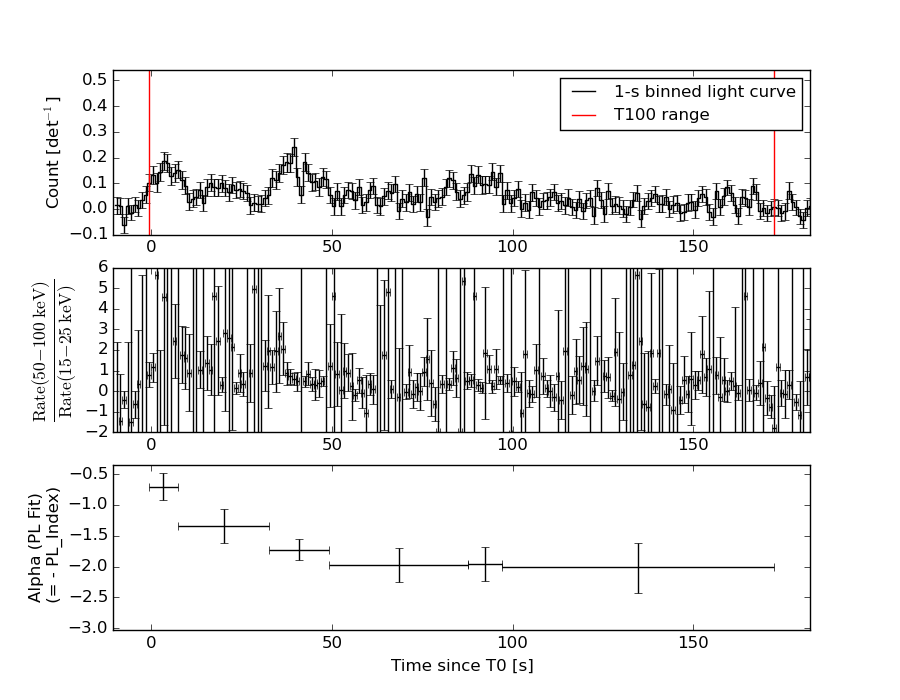
Distribution
T90 vs. Hardness ratio plot
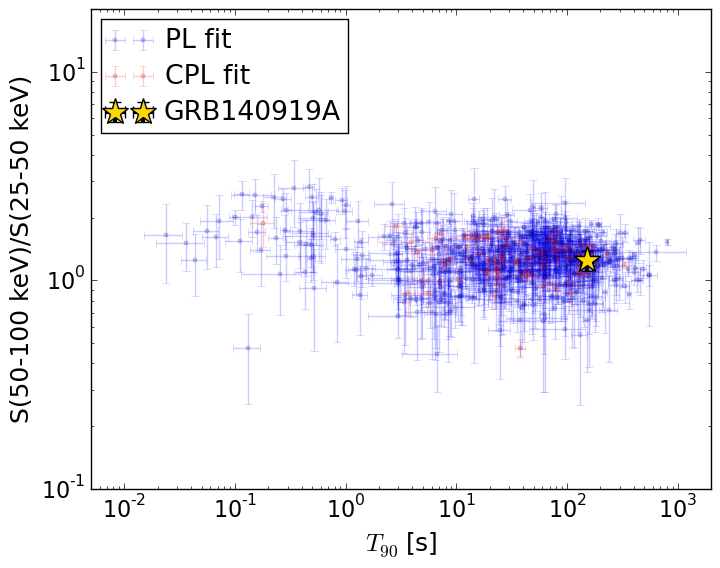
T90                                   = 152.304 sec.
Hardness ratio (energy fluence ratio) = 1.24813005193
S(15-50 keV) vs. S(50-150 keV) plot
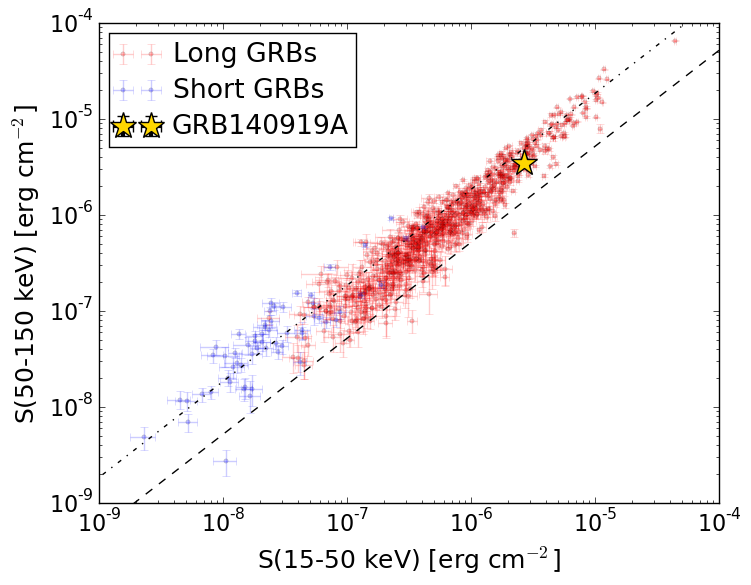
S(15-50 keV)  = 2.669726e-06
S(50-150 keV) = 3.516423e-06
The dash-dotted line and the dashed line traces the fluences calculated from the Band function with Epeak = 15 and 150 keV, respectively. Both lines assume a canonical values of alpha = -1 and beta = -2.5.
Mask shadow pattern
IMX = -1.015444798698714E-01, IMY = 7.737949248350040E-01
Spacecraft aspect plot
Bright source in the pre-burst/pre-slew/post-slew images
Pre-burst image of 15-350 keV band
Time interval of the image:
-239.064000 -0.744000

# RAcent  DECcent POSerr Theta    Phi  PeakCts   SNR AngSep     Name
#  [deg]    [deg]    ['] [deg]  [deg]                   [']
244.9948 -15.6243    0.2  24.4  -50.5  16.4717  53.2    1.3	Sco X-1
256.0506 -37.8094    1.7  11.2 -127.2   1.6279   6.8    3.7	4U 1700-377
256.3597 -36.4694    3.3  10.3 -122.1   0.8487   3.5    4.6	GX 349+2
262.8588 -24.8871   13.5   6.2  -22.3   0.2228   0.9   11.8	GX 1+4
264.9477 -44.4669    6.2  14.2 -169.1   0.4411   1.9    8.8	4U 1735-44
268.2934  -1.3906    7.0  29.0   11.4   0.4940   1.7    5.8	SW J1753.5-0127
270.3688 -25.0722    2.5   6.4   42.9   1.1201   4.5    4.6	GX 5-1
270.3777 -25.7220    5.1   5.9   46.5   0.5758   2.4    4.3	GRS 1758-258
273.9153 -14.1997   23.3  17.6   32.5   0.1330   0.5   11.1	GX 17+2
275.9854 -30.5076   10.3   8.4  100.7   0.2883   1.1    9.0	H1820-303
285.0852 -24.9725    9.6  17.5   83.9   0.3661   1.2    4.1	HT1900.1-2455
288.8662  10.9042    6.1  46.6   38.5   2.1239   1.9    4.7	GRS 1915+105
262.8867 -33.8677    6.3   4.5 -134.9   0.4809   1.8    5.5	GX 354-0
301.0839 -42.4333    2.5  30.3  130.4   1.7590   4.6 ------	UNKNOWN
267.5519  19.3711    3.0  49.7    8.8   2.5935   3.8 ------	UNKNOWN
320.1202 -79.9642    2.9  54.1  177.1   3.8891   3.9 ------	UNKNOWN
266.5968 -32.2274    1.9   1.9  177.7   1.7287   6.1 ------	UNKNOWN
243.2829 -41.2127    2.7  21.5 -119.6   1.1266   4.2 ------	UNKNOWN
Pre-slew background subtracted image of 15-350 keV band
Time interval of the image:
-0.744000 172.328000

# RAcent  DECcent POSerr Theta    Phi  PeakCts   SNR AngSep     Name
#  [deg]    [deg]    ['] [deg]  [deg]                   [']
245.0005 -15.6336    2.5  24.4  -50.5   1.1336   4.6    1.3	Sco X-1
256.1687 -37.6937    0.0  11.1 -127.0  -0.1967  -1.0   12.5	4U 1700-377
256.5214 -36.3409    6.1  10.1 -121.9  -0.3547  -1.9    6.4	GX 349+2
263.1856 -24.8523   10.0   6.1  -19.7  -0.2241  -1.2   11.6	GX 1+4
264.5475 -44.5123    8.0  14.2 -168.0   0.2891   1.4    9.2	4U 1735-44
268.2247  -1.3942    5.2  29.0   11.2  -0.5260  -2.2    9.3	SW J1753.5-0127
270.4581 -25.1163   10.4   6.4   43.7  -0.2142  -1.1    9.7	GX 5-1
270.1594 -25.8547    4.2   5.7   45.7  -0.5151  -2.7   10.2	GRS 1758-258
273.8651 -13.9078    7.3  17.9   32.0  -0.3486  -1.6   11.3	GX 17+2
276.0188 -30.1978    5.5   8.5   98.6   0.4312   2.1   11.3	H1820-303
285.0080 -25.0667   41.6  17.4   84.1  -0.0620  -0.3    8.9	HT1900.1-2455
288.8491  10.9229    6.5  46.7   38.4   1.3447   1.8    3.3	GRS 1915+105
262.8186 -33.9281    9.6   4.6 -134.9   0.2463   1.2   10.2	GX 354-0
294.1361 -56.3558    2.1  32.5  158.3   1.3365   5.5 ------	UNKNOWN
209.5123 -66.9184    2.2  49.4 -147.3   2.8580   5.1 ------	UNKNOWN
221.5412 -32.1540    0.7  38.0  -97.5  10.3433  17.2 ------	UNKNOWN
Post-slew image of 15-350 keV band
Time interval of the image:
647.036610 835.467500
840.936000 900.636000
900.936000 962.973300

# RAcent  DECcent POSerr Theta    Phi  PeakCts   SNR AngSep     Name
#  [deg]    [deg]    ['] [deg]  [deg]                   [']
 83.6343  22.0148    0.6  49.0    2.9  11.7283  20.7    0.1	Crab
310.6046  54.8443    2.6  45.7  165.9   2.1450   4.4 ------	UNKNOWN
 70.5011  37.9648    2.8  31.1   15.3   1.2530   4.2 ------	UNKNOWN
 95.5871  48.4961    2.3  27.5  -27.7   1.1511   5.1 ------	UNKNOWN
120.2231  72.9513    2.7  20.6  -95.3   1.1202   4.2 ------	UNKNOWN
246.0227  60.5716    2.2  51.1 -149.3   3.8368   5.2 ------	UNKNOWN
168.5117  65.1631    3.4  38.4 -104.5   2.3510   3.4 ------	UNKNOWN
212.8192  62.7350    3.6  48.0 -129.0   4.0298   3.2 ------	UNKNOWN