Analysis Summary
Notes:
- 1) No attempt has been made to eliminate the non-significant decimal places.
- 2) This batgrbproduct analysis is done using the HEASARC data.
- 3) This batgrbproduct analysis is using the flight position for the mask-weighting calculation.
======================================================================
                  BAT GRB EVENT DATA PROCESSING REPORT
    Process Script Ver: batgrbproduct v2.46
    Process Start Time: Mon Oct 13 20:14:26 EDT 2014
             Host Name: bat1
   Current Working Dir: /local/data/bat1/alien/Swift_3rdBATcatalog/event/batevent_reproc/trigger613775
======================================================================

  Trigger: 00613775      Segment: 000

  BAT Trigger Time: 433487723.968   [s; MET]
      Trigger Stop: 433487732.16   [s; MET]
               UTC: 2014-09-27T05:15:11.388280    [includes UTCF correction]
       Where From?: TDRSS position message

  BAT
    RA: 291.844604487003   Dec: -65.3875048699422  [deg; J2000]

     Catalogged Source?: NO
     Point Source?:      YES
     GRB Indicated?:     YES    [ by BAT flight software ]
     Image S/N Ratio:    7.16
     Image Trigger?:     NO
     Rate S/N Ratio:     9.1104335791443  [ if not an image trigger ]
     Image S/N Ratio:    7.16

  Analysis Position:   [ source = BAT ]
    RA: 291.844604487003   Dec: -65.3875048699422  [deg; J2000]

  Refined Position:   [ source = BAT pre-slew burst ]
    RA: 291.801712791228   Dec: -65.3995353587662  [deg; J2000]
        { 19h 27m 12.4s , -65d 23' 58.3" }
         +/- 2.16906695627081 [arcmin] (estimated 90% radius based on SNR)
         +/- 1.180336366314 [arcmin] (formal 1-sigma fit error)
    SNR: 10.0630224023881

  Angular difference between the analysis and refined position is 1.292009 arcmin

  Partial Coding Fraction: 0.546875    [ including projection effects ]

  Duration
     T90: 6.25599998235703 +/- 1.42603365502763
        Measured from: 2.17599999904633
                   to: 8.43199998140335     [s; relative to TRIGTIME]
     T50: 3.82799994945526 +/- 1.43990277345572
        Measured from: 3.61599999666214
                   to: 7.4439999461174     [s; relative to TRIGTIME]


  Fluence
     Peak Flux  (peak 1 second)
        Measured from: 7.69599997997284
                   to: 8.69599997997284     [s; relative to TRIGTIME]
     Total Fluence
        Measured from: 0.428000032901764
                   to: 8.69599997997284     [s; relative to TRIGTIME]

             Band 1     Band 2     Band 3     Band 4
              15-25      25-50     50-100    100-350     keV
 Total     0.137630   0.194180   0.102082   0.012838
           0.028746   0.026136   0.020920   0.016805 [error]
 Peak      0.046588   0.037168   0.013841   0.009542
           0.010083   0.009557   0.007475   0.005869 [error]

     [ fluence units of on-axis counts / fully illuminated detector ]

======================================================================


====== Table of the duration information =============================

        Value   tstart    tstop
T100    8.268    0.428    8.696
T90     6.256    2.176    8.432
T50     3.828    3.616    7.444
Peak    1.000    7.696    8.696


====== Spectral Analysis Summary =====================================

Model      : spectral model: simple power-law (PL) and cutoff power-law (CPL)
Ph_index   : photon index: E^{Ph_index}
Ph_90err   : 90% error of the photon index
Epeak      : Epeak in keV
Epeak_90err: 90% error of Epeak
Norm       : normalization at 50 keV in both the PL model and CPL model
Nomr_90err : 90% error of the normalization
chi2       : Chi-Squared
dof        : degree of freedo

=== Time-averaged spectral analysis ===
(Best model with acceptable fit: PL)

Model Ph_index Ph_90err_low Ph_90err_hi  Epeak  Epeak_90err_low  Epeak_90err_hi  Norm       Nomr_90err_low    Norm_90err_hi    chi2    dof
PL      -1.818    -0.302      0.294       -           -               -         3.53e-03     -6.32e-04          6.18e-04      56.640   57
CPL     -1.822    -0.325      0.838     9999.270      N/A           N/A         3.52e-03        N/A               N/A         56.640   56


=== 1-s peak spectral analysis ===
(Best model with acceptable fit: PL)

Model Ph_index Ph_90err_low Ph_90err_hi  Epeak  Epeak_90err_low  Epeak_90err_hi  Norm       Nomr_90err_low    Norm_90err_hi    chi2    dof
PL      -2.268     -0.523     0.462       -           -               -         5.30e-03     -1.91e-03          1.88e-03      68.890   57
CPL      0.596     -2.640    -0.596       28.608      N/A           N/A         4.65e-01        N/A               N/A         66.180   56


=== Fluence/Peak Flux Summary ===

              Model    Band1     Band2     Band3     Band4     Band5     Total
                       15-25     25-50    50-100    100-350    15-150    15-350    keV
Fluence         PL   5.02e-08  7.61e-08  8.63e-08  1.87e-07  2.68e-07  3.99e-07   erg/cm2
      90%_error_low -1.28e-08 -1.25e-08 -2.05e-08 -7.77e-08 -4.80e-08 -1.00e-07   erg/cm2
      90%_error_hi   1.34e-08  1.25e-08  2.05e-08  1.09e-07  4.86e-08  1.23e-07   erg/cm2
Peak flux       PL   4.58e-01  2.94e-01  1.22e-01  6.91e-02  9.09e-01  9.43e-01   ph/cm2/s
      90%_error_low -1.56e-01 -8.05e-02 -5.35e-02 -4.34e-02 -2.44e-01 -2.52e-01   ph/cm2/s
      90%_error_hi   1.63e-01  7.99e-02  5.88e-02  7.55e-02  2.44e-01  2.53e-01   ph/cm2/s

Fluence        CPL    N/A      N/A      N/A      N/A      N/A      N/A      erg/cm2
      90%_error_low -1.28e-08 -1.25e-08 -2.05e-08 -7.77e-08 -4.80e-08 -1.00e-07   erg/cm2
      90%_error_hi   1.34e-08  1.25e-08  2.05e-08  1.09e-07  4.86e-08  1.23e-07   erg/cm2
Peak flux      CPL   4.43e-01  3.78e-01  4.70e-02  3.18e-04  8.68e-01  8.69e-01   ph/cm2/s
      90%_error_low -1.69e-01 -1.13e-01 -4.70e-02 -3.18e-04 -2.36e-01 -2.36e-01   ph/cm2/s
      90%_error_hi   2.10e-01  1.18e-01  1.03e-01  5.13e-02  2.39e-01  2.39e-01   ph/cm2/s

======================================================================
Image
Pre-slew 15.0-350.0 keV image (Event data)
#   RAcent    DECcent   POSerr    Theta     Phi              Peak Cts       SNR   Name
  291.8017   -65.3995   0.0190    36.6060   169.2671         0.4611118     10.063 TRIG_00613775

Foreground time interval of the image:
  0.428   8.696 (delta_t =   8.268 [sec])
Background time interval of the image:
-239.968   0.428 (delta_t = 240.396 [sec])
Light Curves
Note: The mask-weighted lightcurves have units of either count/det or counts/sec/det, where a det is 0.4 x 0.4 = 0.16 sq cm.
Full-time range; 1 s binning
Other quick-look light curves:
- 64 ms binning (zoomed)
- 16 ms binning (zoomed)
- 8 ms binning (zoomed)
- 2 ms binning (zoomed)
- SN=5 or 10 s binning (full-time range)
- Raw light curve
Spectra
- 64 ms binning (zoomed)
- 16 ms binning (zoomed)
- 8 ms binning (zoomed)
- 2 ms binning (zoomed)
- SN=5 or 10 s binning (full-time range)
- Raw light curve
Spectra
Notes:
- 1) The fitting includes the systematic errors.
- 2) When the burst includes telescope slew time periods, the fitting uses an average response file made from multiple 5-s response files through out the slew time plus single time preiod for the non-slew times, and weighted by the total counts in the corresponding time period using addrmf. An average response file is needed becuase a spectral fit using the pre-slew DRM will introduce some errors in both a spectral shape and a normalization if the PHA file contains a lot of the slew/post-slew time interval.
- 3) For fits to more complicated models (e.g. a power-law over a cutoff power-law), the BAT team has decided to require a chi-square improvement of more than 6 for each extra dof.
Time averaged spectrum fit using the average DRM
Power-law model
Time interval is from    0.428 sec. to    8.696 sec.

Spectral model in power-law:
------------------------------------------------------------
Parameters  : value       lower 90%   higher 90%
Photon index: -1.81761     ( -0.302022   0.294043 )
Norm@50keV  : 3.52682E-03    ( -0.000632374   0.000617518 )
------------------------------------------------------------
#Fit statistic : Chi-Squared =          56.64 using 59 PHA bins.
# Reduced chi-squared =         0.9937 for     57 degrees of freedom
# Null hypothesis probability =   4.885215e-01

Photon flux (15-150 keV)    in 8.268 sec: 0.489373 ( -0.081898  0.082231 ) ph/cm2/s
Energy fluence (15-150 keV)             : 2.68337e-07 ( -4.79529e-08  4.86492e-08 ) ergs/cm2
Cutoff power-law model
Time interval is from    0.428 sec. to    8.696 sec.
Spectral model in the cutoff power-law:
------------------------------------------------------------
Parameters  : value       lower 90%   higher 90%
Photon index: -1.82151     ( -0.32543   0.837569 )
Epeak [keV] : 9999.27      (   )
Norm@50keV  : 3.51976E-03    (     )
------------------------------------------------------------
#Fit statistic : Chi-Squared =          56.64 using 59 PHA bins.
# Reduced chi-squared =          1.011 for     56 degrees of freedom
# Null hypothesis probability =   4.508849e-01

Photon flux (15-150 keV)    in 8.268 sec: 0.490657 ( -0.085397  0.0833 ) ph/cm2/s
Energy fluence (15-150 keV)             : 0 ( 0  0 ) ergs/cm2
1-s peak spectrum fit
Power-law model
Time interval is from    7.696 sec. to    8.696 sec.

Spectral model in power-law:
------------------------------------------------------------
Parameters  : value       lower 90%   higher 90%
Photon index: -2.26778     ( -0.52304   0.461914 )
Norm@50keV  : 5.29515E-03    ( -0.00191462   0.00187971 )
------------------------------------------------------------
#Fit statistic : Chi-Squared =          68.89 using 59 PHA bins.
# Reduced chi-squared =          1.209 for     57 degrees of freedom
# Null hypothesis probability =   1.344005e-01

Photon flux (15-150 keV)    in 1 sec: 0.909161 ( -0.24369  0.243829 ) ph/cm2/s
Energy fluence (15-150 keV)             : 5.03292e-08 ( -1.52476e-08  1.60161e-08 ) ergs/cm2
Cutoff power-law model
Time interval is from    7.696 sec. to    8.696 sec.
Spectral model in the cutoff power-law:
------------------------------------------------------------
Parameters  : value       lower 90%   higher 90%
Photon index: 0.595766     ( -2.68184   -0.637635 )
Epeak [keV] : 28.6081      (   )
Norm@50keV  : 0.465293    (     )
------------------------------------------------------------
#Fit statistic : Chi-Squared =          66.18 using 59 PHA bins.
# Reduced chi-squared =          1.182 for     56 degrees of freedom
# Null hypothesis probability =   1.658101e-01

Photon flux (15-150 keV)    in 1 sec: 0.868171 ( -0.235878  0.238869 ) ph/cm2/s
Energy fluence (15-150 keV)             : 0 ( 0  0 ) ergs/cm2
Time-resolved spectra
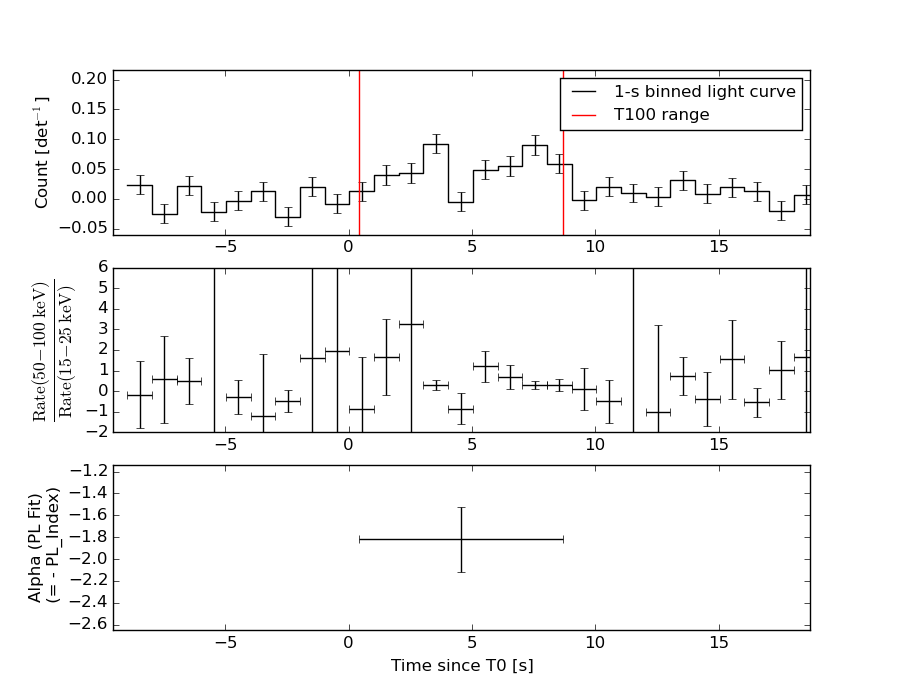
Distribution
T90 vs. Hardness ratio plot
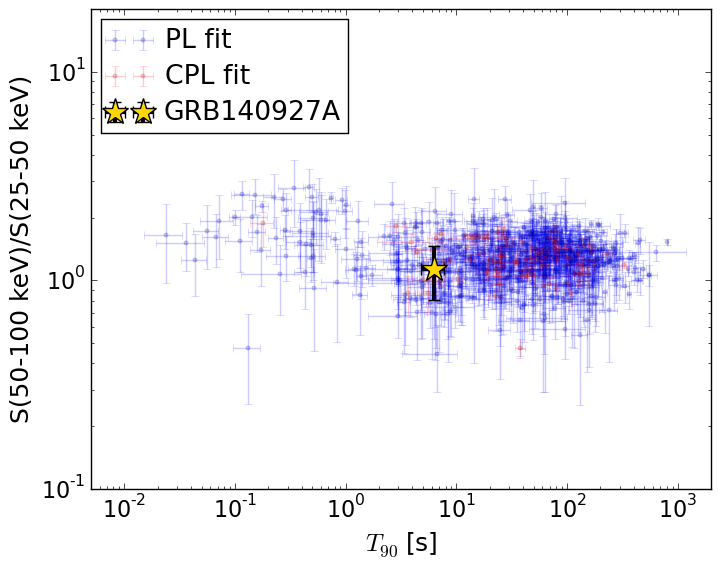
T90                                   = 6.256 sec.
Hardness ratio (energy fluence ratio) = 1.13477612743
S(15-50 keV) vs. S(50-150 keV) plot
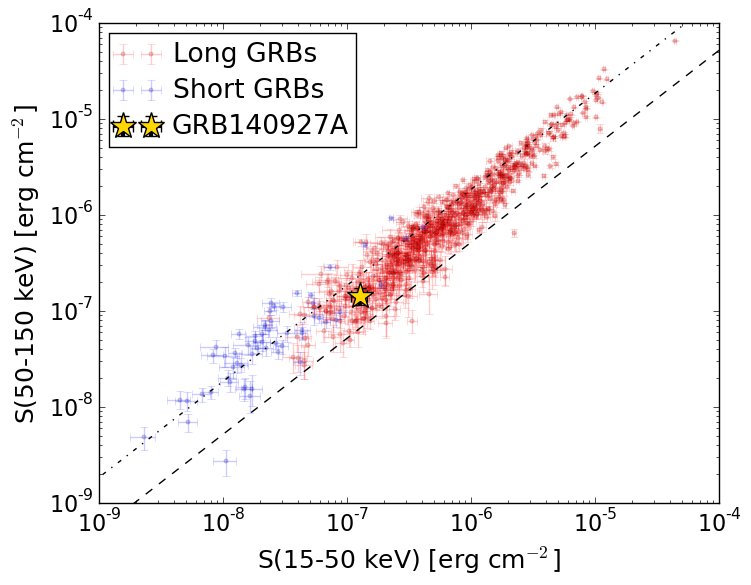
S(15-50 keV)  = 1.2625969e-07
S(50-150 keV) = 1.4207964e-07
The dash-dotted line and the dashed line traces the fluences calculated from the Band function with Epeak = 15 and 150 keV, respectively. Both lines assume a canonical values of alpha = -1 and beta = -2.5.
Mask shadow pattern
IMX = -7.298330504303442E-01, IMY = -1.383374533288296E-01
Spacecraft aspect plot
Bright source in the pre-burst/pre-slew/post-slew images
Pre-burst image of 15-350 keV band
Time interval of the image:
-239.968000 0.428000

# RAcent  DECcent POSerr Theta    Phi  PeakCts   SNR AngSep     Name
#  [deg]    [deg]    ['] [deg]  [deg]                   [']
244.9886 -15.6296    0.3  25.6  -48.2  11.2352  41.8    0.8	Sco X-1
255.9900 -37.8484    0.5  10.3 -119.7   5.6040  25.0    0.3	4U 1700-377
256.3797 -36.4412    1.5   9.4 -113.2   1.6842   7.6    2.9	GX 349+2
263.1750 -24.7642    6.5   8.0  -15.9   0.4126   1.8    9.1	GX 1+4
264.7029 -44.4832    3.4  12.4 -167.3   0.8021   3.4    2.6	4U 1735-44
268.4217  -1.5225    4.5  30.7   10.3   0.6926   2.6    5.3	SW J1753.5-0127
270.4454 -25.0485    7.0   7.9   33.4   0.4038   1.7    9.0	GX 5-1
270.4517 -25.6356    6.0   7.4   35.3   0.5312   2.2   10.3	GRS 1758-258
273.9412 -14.0737    2.5  19.3   28.8   1.1057   4.5    4.4	GX 17+2
275.8878 -30.3605    3.1   8.2   86.3   0.8113   3.8    2.0	H1820-303
285.0115 -25.0454    8.3  17.7   77.6   0.4080   1.4    7.6	HT1900.1-2455
288.8601  10.9132    3.2  48.1   36.7   3.7674   3.6    4.1	GRS 1915+105
262.9227 -33.8069    2.2   3.4 -112.8   1.1870   5.3    3.7	GX 354-0
323.0870 -46.8759    3.3  45.0  132.8   3.5665   3.5 ------	UNKNOWN
287.0729  -7.6587    2.4  31.1   49.0   1.9031   4.8 ------	UNKNOWN
266.5565 -32.2221    1.6   0.1  158.8   1.8419   7.4 ------	UNKNOWN
218.4658 -29.9756    3.5  40.9  -93.5   3.6897   3.3 ------	UNKNOWN
Pre-slew background subtracted image of 15-350 keV band
Time interval of the image:
0.428000 8.696000

# RAcent  DECcent POSerr Theta    Phi  PeakCts   SNR AngSep     Name
#  [deg]    [deg]    ['] [deg]  [deg]                   [']
244.9499 -15.7825    7.8  25.5  -48.6   0.0545   1.5    8.7	Sco X-1
255.8409 -37.9567    5.3  10.5 -119.9   0.0656   2.2    9.7	4U 1700-377
256.6241 -36.5174    3.2   9.3 -114.1   0.1072   3.6   10.7	GX 349+2
262.8594 -24.9079    0.0   7.9  -18.2   0.0133   0.4   12.7	GX 1+4
264.5452 -44.5136    3.4  12.4 -166.8  -0.1072  -3.4    9.3	4U 1735-44
268.4772  -1.3114    6.4  30.9   10.4   0.0711   1.8   10.7	SW J1753.5-0127
270.2637 -24.9307   10.5   7.9   31.9   0.0345   1.1    9.0	GX 5-1
270.1981 -25.9077    3.7   7.0   34.7  -0.0984  -3.1   11.4	GRS 1758-258
274.0395 -14.0634  197.7  19.4   29.1  -0.0020  -0.1    2.5	GX 17+2
275.7867 -30.3815    8.7   8.1   86.3  -0.0431  -1.3    7.2	H1820-303
285.0039 -24.9861    4.1  17.7   77.4  -0.1064  -2.8    4.3	HT1900.1-2455
288.7461  10.8103   28.0  47.9   36.6  -0.0585  -0.4    8.7	GRS 1915+105
262.8237 -33.9959    0.0   3.6 -114.9  -0.0741  -2.3   12.7	GX 354-0
291.8019 -65.3994    1.1  36.6  169.3   0.4612  10.1 ------	UNKNOWN
287.1856 -63.9899    2.3  34.3  170.7   0.2186   5.1 ------	UNKNOWN
288.2671 -84.2429    2.5  52.5 -176.1   0.4137   4.7 ------	UNKNOWN
250.6190 -15.2445    2.4  22.3  -37.6   0.1582   4.8 ------	UNKNOWN
Post-slew image of 15-350 keV band
Time interval of the image:
106.532600 907.032600

# RAcent  DECcent POSerr Theta    Phi  PeakCts   SNR AngSep     Name
#  [deg]    [deg]    ['] [deg]  [deg]                   [']
170.3076 -60.6240   25.6  46.8 -127.5   0.9449   0.5    0.2	Cen X-3
186.6624 -62.7027    6.2  40.7 -119.8   2.7069   1.9    4.1	GX 301-2
256.0467 -37.8483    1.9  34.5  -37.3   3.7856   6.2    2.9	4U 1700-377
256.5804 -36.4940    3.6  35.5  -35.6   1.9595   3.2    8.2	GX 349+2
263.1685 -24.6059    5.6  44.7  -20.9   1.7115   2.1   12.1	GX 1+4
264.6876 -44.5405    3.5  25.6  -31.4   1.5362   3.3    5.9	4U 1735-44
270.1590 -25.0928    3.9  42.6  -12.2   2.0715   3.0    6.9	GX 5-1
270.3238 -25.7260    3.3  41.9  -12.2   2.3030   3.6    1.5	GRS 1758-258
274.0190 -14.0382    4.0  52.7   -4.5   3.8626   2.9    0.8	GX 17+2
275.9545 -30.3795    3.1  36.3   -6.1   2.5329   3.7    1.7	H1820-303
285.0677 -25.0118    2.4  40.6    8.0   3.4140   4.9    5.7	HT1900.1-2455
263.0238 -33.8247    1.8  36.0  -25.6   3.9697   6.5    1.8	GX 354-0
352.2002 -41.9700    3.6  40.4  102.5   8.7184   3.2 ------	UNKNOWN
 50.7755 -56.7895    3.5  49.4  158.3   6.0305   3.3 ------	UNKNOWN
 82.4010 -65.7986    3.6  47.1 -178.5   3.3546   3.2 ------	UNKNOWN
 94.4015 -68.0319    2.8  46.0 -171.5   4.0806   4.0 ------	UNKNOWN
266.5738 -32.2264    1.5  36.5  -19.9   4.5187   7.6 ------	UNKNOWN
261.2762 -11.2843    2.5  58.0  -18.6   9.9115   4.6 ------	UNKNOWN