Analysis Summary
Notes:
- 1) No attempt has been made to eliminate the non-significant decimal places.
- 2) This batgrbproduct analysis is done using the HEASARC data.
- 3) This batgrbproduct analysis is using the flight position for the mask-weighting calculation.
======================================================================
                  BAT GRB EVENT DATA PROCESSING REPORT
    Process Script Ver: batgrbproduct v2.46
    Process Start Time: Sat Nov  1 19:29:01 EDT 2014
             Host Name: bat1
   Current Working Dir: /local/data/bat1/alien/Swift_3rdBATcatalog/event/batevent_reproc/trigger615873
======================================================================

  Trigger: 00615873      Segment: 000

  BAT Trigger Time: 435484131.968   [s; MET]
      Trigger Stop: 435484134.016   [s; MET]
               UTC: 2014-10-20T07:48:39.289560    [includes UTCF correction]
       Where From?: TDRSS position message

  BAT
    RA: 225.009297940176   Dec: 55.3338460383256  [deg; J2000]

     Catalogged Source?: NO
     Point Source?:      YES
     GRB Indicated?:     YES    [ by BAT flight software ]
     Image S/N Ratio:    7.16
     Image Trigger?:     NO
     Rate S/N Ratio:     10.816653826392  [ if not an image trigger ]
     Image S/N Ratio:    7.16

  Analysis Position:   [ source = BAT ]
    RA: 225.009297940176   Dec: 55.3338460383256  [deg; J2000]

  Refined Position:   [ source = BAT pre-slew burst ]
    RA: 225.029513326799   Dec: 55.3204068050379  [deg; J2000]
        { 15h 00m 07.1s , +55d 19' 13.5" }
         +/- 1.61629042131283 [arcmin] (estimated 90% radius based on SNR)
         +/- 0.576263782048008 [arcmin] (formal 1-sigma fit error)
    SNR: 15.3191096253385

  Angular difference between the analysis and refined position is 1.061289 arcmin

  Partial Coding Fraction: 0.671875    [ including projection effects ]

  Duration
     T90: 14.8959999680519 +/- 2.16538681979588
        Measured from: -5.78799998760223
                   to: 9.10799998044968     [s; relative to TRIGTIME]
     T50: 9.01999998092651 +/- 2.11442665943586
        Measured from: -1.68000000715256
                   to: 7.33999997377396     [s; relative to TRIGTIME]


  Fluence
     Peak Flux  (peak 1 second)
        Measured from: -0.199999988079071
                   to: 0.800000011920929     [s; relative to TRIGTIME]
     Total Fluence
        Measured from: -7.64800000190735
                   to: 11.1920000314713     [s; relative to TRIGTIME]

             Band 1     Band 2     Band 3     Band 4
              15-25      25-50     50-100    100-350     keV
 Total     0.284053   0.344516   0.166886   0.057018
           0.029507   0.030715   0.026365   0.022100 [error]
 Peak      0.034396   0.032688   0.022549   0.005792
           0.006771   0.007299   0.006220   0.005262 [error]

     [ fluence units of on-axis counts / fully illuminated detector ]

======================================================================


====== Table of the duration information =============================

        Value   tstart    tstop
T100   18.840   -7.648   11.192
T90    14.896   -5.788    9.108
T50     9.020   -1.680    7.340
Peak    1.000   -0.200    0.800


====== Spectral Analysis Summary =====================================

Model      : spectral model: simple power-law (PL) and cutoff power-law (CPL)
Ph_index   : photon index: E^{Ph_index}
Ph_90err   : 90% error of the photon index
Epeak      : Epeak in keV
Epeak_90err: 90% error of Epeak
Norm       : normalization at 50 keV in both the PL model and CPL model
Nomr_90err : 90% error of the normalization
chi2       : Chi-Squared
dof        : degree of freedo

=== Time-averaged spectral analysis ===
(Best model with acceptable fit: PL)

Model Ph_index Ph_90err_low Ph_90err_hi  Epeak  Epeak_90err_low  Epeak_90err_hi  Norm       Nomr_90err_low    Norm_90err_hi    chi2    dof
PL      -1.809    -0.196      0.188       -           -               -         2.67e-03     -3.36e-04          3.29e-04      68.610   57
CPL     -1.319    -0.764      0.953       59.751      N/A           N/A         5.06e-03        N/A               N/A         67.460   56


=== 1-s peak spectral analysis ===
(Best model with acceptable fit: PL)

Model Ph_index Ph_90err_low Ph_90err_hi  Epeak  Epeak_90err_low  Epeak_90err_hi  Norm       Nomr_90err_low    Norm_90err_hi    chi2    dof
PL      -1.593     -0.419     0.406       -           -               -         5.48e-03     -1.41e-03          1.37e-03      67.320   57
CPL     -1.470     -1.286     1.616      189.385    -189.385      -189.385      6.44e-03     -2.36e-03          4.77e-02      67.360   56


=== Fluence/Peak Flux Summary ===

              Model    Band1     Band2     Band3     Band4     Band5     Total
                       15-25     25-50    50-100    100-350    15-150    15-350    keV
Fluence         PL   8.58e-08  1.31e-07  1.49e-07  3.25e-07  4.63e-07  6.91e-07   erg/cm2
      90%_error_low -1.31e-08 -1.37e-08 -2.53e-08 -9.88e-08 -5.85e-08 -1.27e-07   erg/cm2
      90%_error_hi   1.34e-08  1.37e-08  2.56e-08  1.24e-07  5.96e-08  1.47e-07   erg/cm2
Peak flux       PL   2.47e-01  2.35e-01  1.56e-01  1.61e-01  7.03e-01  7.98e-01   ph/cm2/s
      90%_error_low -8.69e-02 -5.57e-02 -5.07e-02 -8.37e-02 -1.63e-01 -1.90e-01   ph/cm2/s
      90%_error_hi   9.24e-02  5.52e-02  5.05e-02  1.27e-01  1.63e-01  1.93e-01   ph/cm2/s

Fluence        CPL   8.67e-08  1.21e-07  1.25e-07  2.97e-07  4.14e-07  6.30e-07   erg/cm2
      90%_error_low -1.42e-08 -2.21e-08 -2.20e-08 -1.51e-07 -7.34e-08 -9.17e-08   erg/cm2
      90%_error_hi   1.01e-08  1.88e-08  1.87e-08  3.61e-08  6.24e-08  8.48e-08   erg/cm2
Peak flux      CPL   2.47e-01  2.35e-01  1.56e-01  1.62e-01  7.03e-01  8.01e-01   ph/cm2/s
      90%_error_low -9.31e-02 -5.41e-02 -5.06e-02 -1.05e-01 -1.62e-01 -2.41e-01   ph/cm2/s
      90%_error_hi   8.69e-02  5.51e-02  5.27e-02  1.24e-01  1.63e-01  1.81e-01   ph/cm2/s

======================================================================
Image
Pre-slew 15.0-350.0 keV image (Event data)
#   RAcent    DECcent   POSerr    Theta     Phi              Peak Cts       SNR   Name
  225.0295    55.3204   0.0126    20.8134   108.9381         0.8741504     15.319 TRIG_00615873

Foreground time interval of the image:
 -7.648  11.192 (delta_t =  18.840 [sec])
Background time interval of the image:
-428.867 -410.267 (delta_t =  18.600 [sec])
-239.968  -7.648 (delta_t = 232.320 [sec])
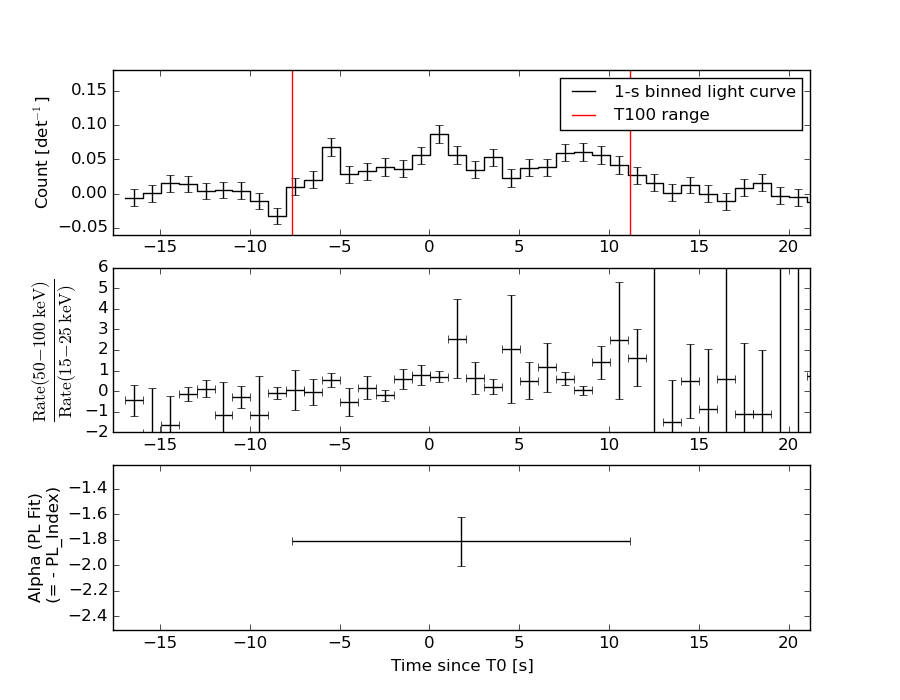
Light Curves
Note: The mask-weighted lightcurves have units of either count/det or counts/sec/det, where a det is 0.4 x 0.4 = 0.16 sq cm.
Full-time range; 1 s binning
Other quick-look light curves:
- 64 ms binning (zoomed)
- 16 ms binning (zoomed)
- 8 ms binning (zoomed)
- 2 ms binning (zoomed)
- SN=5 or 10 s binning (full-time range)
- Raw light curve
Spectra
- 64 ms binning (zoomed)
- 16 ms binning (zoomed)
- 8 ms binning (zoomed)
- 2 ms binning (zoomed)
- SN=5 or 10 s binning (full-time range)
- Raw light curve
Spectra
Notes:
- 1) The fitting includes the systematic errors.
- 2) When the burst includes telescope slew time periods, the fitting uses an average response file made from multiple 5-s response files through out the slew time plus single time preiod for the non-slew times, and weighted by the total counts in the corresponding time period using addrmf. An average response file is needed becuase a spectral fit using the pre-slew DRM will introduce some errors in both a spectral shape and a normalization if the PHA file contains a lot of the slew/post-slew time interval.
- 3) For fits to more complicated models (e.g. a power-law over a cutoff power-law), the BAT team has decided to require a chi-square improvement of more than 6 for each extra dof.
Time averaged spectrum fit using the average DRM
Power-law model
Time interval is from   -7.648 sec. to   11.192 sec.

Spectral model in power-law:
------------------------------------------------------------
Parameters  : value       lower 90%   higher 90%
Photon index: -1.80861     ( -0.196335   0.188407 )
Norm@50keV  : 2.66707E-03    ( -0.000335797   0.000328951 )
------------------------------------------------------------
#Fit statistic : Chi-Squared =          68.61 using 59 PHA bins.
# Reduced chi-squared =          1.204 for     57 degrees of freedom
# Null hypothesis probability =   1.394902e-01

Photon flux (15-150 keV)    in 18.84 sec: 0.368770 ( -0.038851  0.038858 ) ph/cm2/s
Energy fluence (15-150 keV)             : 4.62531e-07 ( -5.85225e-08  5.96493e-08 ) ergs/cm2
Cutoff power-law model
Time interval is from   -7.648 sec. to   11.192 sec.
Spectral model in the cutoff power-law:
------------------------------------------------------------
Parameters  : value       lower 90%   higher 90%
Photon index: -1.31929     ( -0.764424   0.953268 )
Epeak [keV] : 59.7510      (   )
Norm@50keV  : 5.06234E-03    (     )
------------------------------------------------------------
#Fit statistic : Chi-Squared =          67.46 using 59 PHA bins.
# Reduced chi-squared =          1.205 for     56 degrees of freedom
# Null hypothesis probability =   1.404073e-01

Photon flux (15-150 keV)    in 18.84 sec: 0.361927 ( -0.040467  0.04028 ) ph/cm2/s
Energy fluence (15-150 keV)             : 4.13647e-07 ( -7.33952e-08  6.24009e-08 ) ergs/cm2
1-s peak spectrum fit
Power-law model
Time interval is from   -0.200 sec. to    0.800 sec.

Spectral model in power-law:
------------------------------------------------------------
Parameters  : value       lower 90%   higher 90%
Photon index: -1.59278     ( -0.418964   0.405617 )
Norm@50keV  : 5.48363E-03    ( -0.00141116   0.00136552 )
------------------------------------------------------------
#Fit statistic : Chi-Squared =          67.32 using 59 PHA bins.
# Reduced chi-squared =          1.181 for     57 degrees of freedom
# Null hypothesis probability =   1.646765e-01

Photon flux (15-150 keV)    in 1 sec: 0.703128 ( -0.162892  0.16297 ) ph/cm2/s
Energy fluence (15-150 keV)             : 5.13358e-08 ( -1.38954e-08  1.43347e-08 ) ergs/cm2
Cutoff power-law model

Time interval is from   -0.200 sec. to    0.800 sec.
Spectral model in the cutoff power-law:
------------------------------------------------------------
Parameters  : value       lower 90%   higher 90%
Photon index: -1.59092     ( -1.27293   1.62947 )
Epeak [keV] : 9995.43      ( -9997.21 -9997.21 )
Norm@50keV  : 5.49703E-03    ( -0.00142206   0.0486588 )
------------------------------------------------------------
#Fit statistic : Chi-Squared =          67.32 using 59 PHA bins.
# Reduced chi-squared =          1.202 for     56 degrees of freedom
# Null hypothesis probability =   1.429375e-01

Photon flux (15-150 keV)    in 1 sec: 0.703398 ( -0.162229  0.162734 ) ph/cm2/s
Energy fluence (15-150 keV)             : 5.1389e-08 ( -1.6173e-08  1.18478e-08 ) ergs/cm2
Time-resolved spectra
Distribution
T90 vs. Hardness ratio plot
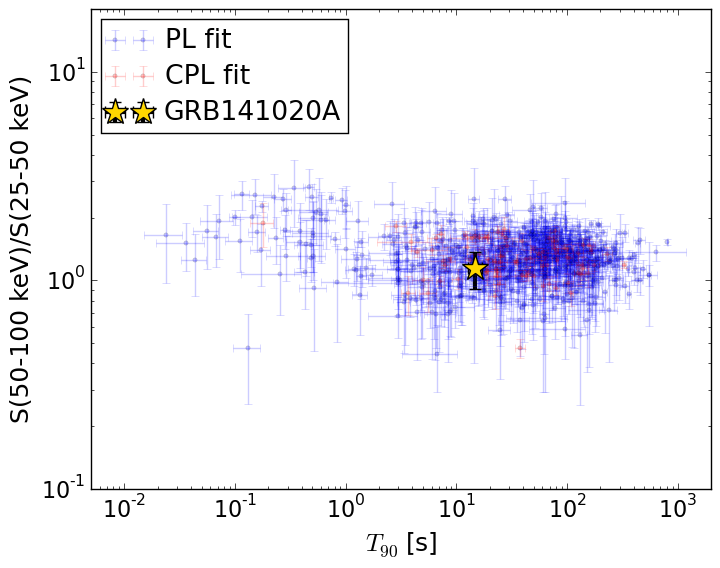
T90                                   = 14.896 sec.
Hardness ratio (energy fluence ratio) = 1.14190542088
S(15-50 keV) vs. S(50-150 keV) plot
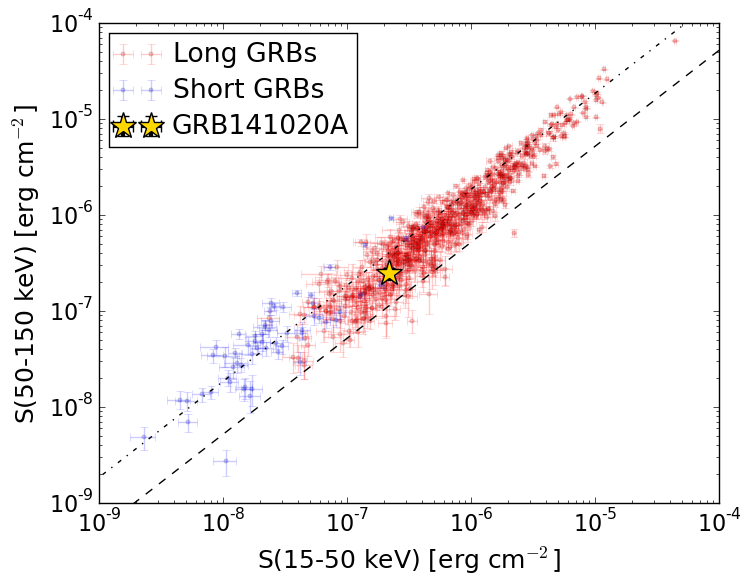
S(15-50 keV)  = 2.1643531e-07
S(50-150 keV) = 2.4608753e-07
The dash-dotted line and the dashed line traces the fluences calculated from the Band function with Epeak = 15 and 150 keV, respectively. Both lines assume a canonical values of alpha = -1 and beta = -2.5.
Mask shadow pattern
IMX = -1.233704190107443E-01, IMY = -3.595547905637893E-01
Spacecraft aspect plot
Bright source in the pre-burst/pre-slew/post-slew images
Pre-burst image of 15-350 keV band
Time interval of the image:
-428.867410 -410.267500
-239.968000 -7.648000

# RAcent  DECcent POSerr Theta    Phi  PeakCts   SNR AngSep     Name
#  [deg]    [deg]    ['] [deg]  [deg]                   [']
254.4978  35.2675   10.2  37.2  160.0   0.3489   1.1    4.9	Her X-1
171.0381  72.3988    2.7  38.9   63.7   2.6722   4.3 ------	UNKNOWN
224.8477  57.3521    2.5  22.3  105.2   1.0324   4.7 ------	UNKNOWN
180.6374  38.5969    2.5  21.2    0.4   0.9078   4.6 ------	UNKNOWN
142.2383  20.9606    2.9  58.3   -6.7   4.3297   4.0 ------	UNKNOWN
Pre-slew background subtracted image of 15-350 keV band
Time interval of the image:
-7.648000 11.192000

# RAcent  DECcent POSerr Theta    Phi  PeakCts   SNR AngSep     Name
#  [deg]    [deg]    ['] [deg]  [deg]                   [']
254.3498  35.2556    9.0  37.1  160.1  -0.0914  -1.3    7.4	Her X-1
222.8981  76.9928    2.4  39.5   85.8   0.9883   4.9 ------	UNKNOWN
225.0295  55.3204    0.8  20.8  108.9   0.8742  15.3 ------	UNKNOWN
190.9869  22.3435    2.1  21.3  -52.4   0.2774   5.6 ------	UNKNOWN
147.7060  16.9357    2.3  56.2  -14.0   0.8769   4.9 ------	UNKNOWN
189.8241  -0.5223    2.2  42.0  -72.2   0.8932   5.2 ------	UNKNOWN
Post-slew image of 15-350 keV band
Time interval of the image:
71.532600 962.122000

# RAcent  DECcent POSerr Theta    Phi  PeakCts   SNR AngSep     Name
#  [deg]    [deg]    ['] [deg]  [deg]                   [']
254.3046  35.4134    8.3  28.3 -168.7   0.7262   1.4    8.6	Her X-1
182.4243  61.2477    3.2  22.7   11.3   1.5925   3.6 ------	UNKNOWN
275.7181  25.4379    2.7  47.3  176.7   4.4354   4.2 ------	UNKNOWN
146.6791  35.5205    2.8  55.1   -7.5   6.9445   4.1 ------	UNKNOWN
218.0693  35.4481    3.8  20.4  -94.9   1.5236   3.0 ------	UNKNOWN
227.5978  22.2324    3.4  33.1 -115.6   2.8388   3.4 ------	UNKNOWN