Analysis Summary
Notes:
- 1) No attempt has been made to eliminate the non-significant decimal places.
- 2) This batgrbproduct analysis is done using the HEASARC data.
- 3) This batgrbproduct analysis is using the flight position for the mask-weighting calculation.
======================================================================
BAT GRB EVENT DATA PROCESSING REPORT
Process Script Ver: batgrbproduct v2.46
Process Start Time: Wed Nov 19 23:10:42 EST 2014
Host Name: bat1
Current Working Dir: /local/data/bat1/alien/Swift_3rdBATcatalog/event/batevent_reproc/trigger617110
======================================================================
Trigger: 00617110 Segment: 000
BAT Trigger Time: 436432719.424 [s; MET]
Trigger Stop: 436432721.472 [s; MET]
UTC: 2014-10-31T07:18:26.698680 [includes UTCF correction]
Where From?: TDRSS position message
BAT
RA: 128.599081849205 Dec: -59.1379265592003 [deg; J2000]
Catalogged Source?: NO
Point Source?: YES
GRB Indicated?: YES [ by BAT flight software ]
Image S/N Ratio: 8.53
Image Trigger?: NO
Rate S/N Ratio: 16.062378404209 [ if not an image trigger ]
Image S/N Ratio: 8.53
Analysis Position: [ source = BAT ]
RA: 128.599081849205 Dec: -59.1379265592003 [deg; J2000]
Refined Position: [ source = BAT pre-slew burst ]
RA: 128.632848314306 Dec: -59.1609031061606 [deg; J2000]
{ 08h 34m 31.9s , -59d 09' 39.3" }
+/- 1.43236668345039 [arcmin] (estimated 90% radius based on SNR)
+/- 0.504160713690341 [arcmin] (formal 1-sigma fit error)
SNR: 18.2047111740119
Angular difference between the analysis and refined position is 1.726236 arcmin
Partial Coding Fraction: 0.3203125 [ including projection effects ]
Duration
T90: 464 +/- 472.271108580654
Measured from: -18.4240000247955
to: 445.575999975204 [s; relative to TRIGTIME]
T50: 448 +/- 930.892045298487
Measured from: -18.4240000247955
to: 429.575999975204 [s; relative to TRIGTIME]
Fluence
Peak Flux (peak 1 second)
Measured from: 5.07599997520447
to: 6.07599997520447 [s; relative to TRIGTIME]
Total Fluence
Measured from: -18.4240000247955
to: 893.575999975204 [s; relative to TRIGTIME]
Band 1 Band 2 Band 3 Band 4
15-25 25-50 50-100 100-350 keV
Total 1.386964 1.763288 1.611650 0.438204
0.183519 0.186530 0.158137 0.134666 [error]
Peak 0.029756 0.015967 0.016462 0.016233
0.010248 0.010855 0.009647 0.007344 [error]
[ fluence units of on-axis counts / fully illuminated detector ]
======================================================================
====== Table of the duration information =============================
Value tstart tstop
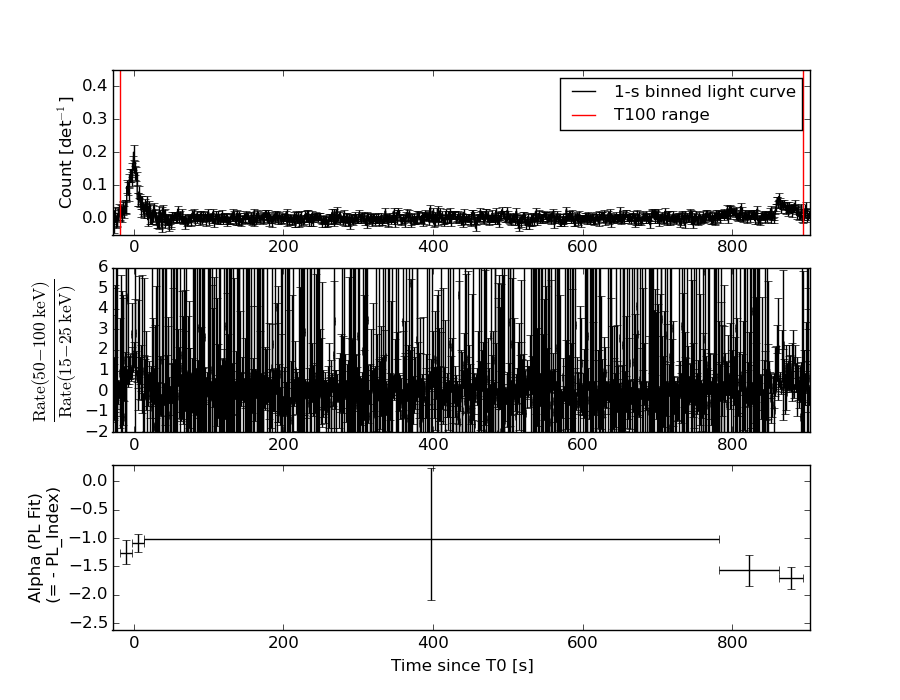
T100 912.000 -18.424 893.576
T90 464.000 -18.424 445.576
T50 448.000 -18.424 429.576
Peak 1.000 5.076 6.076
====== Spectral Analysis Summary =====================================
Model : spectral model: simple power-law (PL) and cutoff power-law (CPL)
Ph_index : photon index: E^{Ph_index}
Ph_90err : 90% error of the photon index
Epeak : Epeak in keV
Epeak_90err: 90% error of Epeak
Norm : normalization at 50 keV in both the PL model and CPL model
Nomr_90err : 90% error of the normalization
chi2 : Chi-Squared
dof : degree of freedo
=== Time-averaged spectral analysis ===
(Best model with acceptable fit: PL)
Model Ph_index Ph_90err_low Ph_90err_hi Epeak Epeak_90err_low Epeak_90err_hi Norm Nomr_90err_low Norm_90err_hi chi2 dof
PL -1.296 -0.181 0.184 - - - 3.83e-04 -3.84e-05 3.84e-05 56.400 57
CPL -1.252 -0.224 0.554 939.147 -939.147 -939.147 4.01e-04 -5.57e-05 2.15e-05 56.470 56
=== 1-s peak spectral analysis ===
(Best model with acceptable fit: PL)
Model Ph_index Ph_90err_low Ph_90err_hi Epeak Epeak_90err_low Epeak_90err_hi Norm Nomr_90err_low Norm_90err_hi chi2 dof
PL -1.394 -0.807 0.847 - - - 5.03e-03 -2.03e-03 2.01e-03 57.880 57
CPL -1.421 1.421 0.100 9999.360 N/A N/A 4.99e-03 N/A N/A 57.890 56
=== Fluence/Peak Flux Summary ===
Model Band1 Band2 Band3 Band4 Band5 Total
15-25 25-50 50-100 100-350 15-150 15-350 keV
Fluence PL 3.68e-07 7.65e-07 1.25e-06 4.57e-06 3.45e-06 6.95e-06 erg/cm2
90%_error_low -7.02e-08 -8.94e-08 -1.53e-07 -1.14e-06 -3.79e-07 -1.25e-06 erg/cm2
90%_error_hi 7.42e-08 8.78e-08 1.51e-07 1.40e-06 3.81e-07 1.46e-06 erg/cm2
Peak flux PL 1.87e-01 2.00e-01 1.53e-01 1.89e-01 6.12e-01 7.29e-01 ph/cm2/s
90%_error_low -1.29e-01 -1.01e-01 -7.71e-02 -1.41e-01 -2.57e-01 -2.93e-01 ph/cm2/s
90%_error_hi 1.59e-01 9.08e-02 7.09e-02 2.81e-01 2.59e-01 2.96e-01 ph/cm2/s
Fluence CPL 3.67e-07 7.66e-07 1.25e-06 4.55e-06 3.47e-06 7.50e-06 erg/cm2
90%_error_low N/A N/A N/A N/A N/A -3.06e-06 erg/cm2
90%_error_hi N/A N/A N/A N/A N/A 1.41e-07 erg/cm2
Peak flux CPL 1.57e-01 1.15e-01 5.87e-02 5.11e-02 3.52e-01 3.82e-01 ph/cm2/s
90%_error_low N/A -1.15e-01 -5.87e-02 -5.11e-02 N/A -3.82e-01 ph/cm2/s
90%_error_hi N/A 1.36e-01 5.22e-02 5.44e-02 N/A 4.40e-01 ph/cm2/s
======================================================================
Image
Pre-slew 15.0-350.0 keV image (Event data)
#   RAcent    DECcent   POSerr    Theta     Phi              Peak Cts       SNR   Name
  128.6328   -59.1609   0.0106    34.4690   -71.9309         2.7005786     18.205 TRIG_00617110

Foreground time interval of the image:
-18.424  28.277 (delta_t =  46.701 [sec])
Background time interval of the image:
-524.123 -507.849 (delta_t =  16.275 [sec])
-239.424 -18.424 (delta_t = 221.000 [sec])
Light Curves
Note: The mask-weighted lightcurves have units of either count/det or counts/sec/det, where a det is 0.4 x 0.4 = 0.16 sq cm.
Full-time range; 1 s binning
Other quick-look light curves:
- 64 ms binning (zoomed)
- 16 ms binning (zoomed)
- 8 ms binning (zoomed)
- 2 ms binning (zoomed)
- SN=5 or 10 s binning (full-time range)
- Raw light curve
Spectra
- 64 ms binning (zoomed)
- 16 ms binning (zoomed)
- 8 ms binning (zoomed)
- 2 ms binning (zoomed)
- SN=5 or 10 s binning (full-time range)
- Raw light curve
Spectra
Notes:
- 1) The fitting includes the systematic errors.
- 2) When the burst includes telescope slew time periods, the fitting uses an average response file made from multiple 5-s response files through out the slew time plus single time preiod for the non-slew times, and weighted by the total counts in the corresponding time period using addrmf. An average response file is needed becuase a spectral fit using the pre-slew DRM will introduce some errors in both a spectral shape and a normalization if the PHA file contains a lot of the slew/post-slew time interval.
- 3) For fits to more complicated models (e.g. a power-law over a cutoff power-law), the BAT team has decided to require a chi-square improvement of more than 6 for each extra dof.
Time averaged spectrum fit using the average DRM
Power-law model

Multiple GTIs in the spectrum
tstart tstop
-18.424000 839.295900
840.576000 893.576000

Spectral model in power-law:
------------------------------------------------------------
Parameters  : value       lower 90%   higher 90%
Photon index: -1.29583     ( -0.181508   0.184339 )
Norm@50keV  : 3.82611E-04    ( -3.84356e-05   3.84352e-05 )
------------------------------------------------------------
#Fit statistic : Chi-Squared =          56.40 using 59 PHA bins.
# Reduced chi-squared =         0.9894 for     57 degrees of freedom
# Null hypothesis probability =   4.975976e-01

Photon flux (15-150 keV)    in 910.7 sec: 4.56121E-02 ( -0.0048081  0.0048263 ) ph/cm2/s
Energy fluence (15-150 keV)             : 3.44719e-06 ( -3.78767e-07  3.81016e-07 ) ergs/cm2
Cutoff power-law model
Multiple GTIs in the spectrum
tstart tstop
-18.424000 839.295900
840.576000 893.576000
Spectral model in the cutoff power-law:
------------------------------------------------------------
Parameters  : value       lower 90%   higher 90%
Photon index: -1.29202     ( -0.222555   0.554723 )
Epeak [keV] : 1.00000E+04      ( -10000 -10000 )
Norm@50keV  : 3.84226E-04    ( -3.86023e-05   3.85971e-05 )
------------------------------------------------------------
#Fit statistic : Chi-Squared =          56.40 using 59 PHA bins.
# Reduced chi-squared =          1.007 for     56 degrees of freedom
# Null hypothesis probability =   4.597508e-01

Photon flux (15-150 keV)    in 910.7 sec: 4.58106E-02 ( -0.005862  0.0054087 ) ph/cm2/s
Energy fluence (15-150 keV)             : 3.46917e-06 ( 0  0 ) ergs/cm2
1-s peak spectrum fit
Power-law model
Time interval is from    5.076 sec. to    6.076 sec.

Spectral model in power-law:
------------------------------------------------------------
Parameters  : value       lower 90%   higher 90%
Photon index: -1.39403     ( -0.80681   0.847313 )
Norm@50keV  : 5.02837E-03    ( -0.00203113   0.00201007 )
------------------------------------------------------------
#Fit statistic : Chi-Squared =          57.88 using 59 PHA bins.
# Reduced chi-squared =          1.016 for     57 degrees of freedom
# Null hypothesis probability =   4.424453e-01

Photon flux (15-150 keV)    in 1 sec: 0.611537 ( -0.256783  0.259261 ) ph/cm2/s
Energy fluence (15-150 keV)             : 4.86542e-08 ( -2.11075e-08  2.12479e-08 ) ergs/cm2
Cutoff power-law model
Time interval is from    5.076 sec. to    6.076 sec.
Spectral model in the cutoff power-law:
------------------------------------------------------------
Parameters  : value       lower 90%   higher 90%
Photon index: -3.39964     ( 3.36682   2.04638 )
Epeak [keV] : 368.367      (   )
Norm@50keV  : 5.13116E-04    (     )
------------------------------------------------------------
#Fit statistic : Chi-Squared =          57.73 using 59 PHA bins.
# Reduced chi-squared =          1.031 for     56 degrees of freedom
# Null hypothesis probability =   4.112073e-01

Photon flux (15-150 keV)    in 1 sec: 0.352314 (    ) ph/cm2/s
Energy fluence (15-150 keV)             : 4.83281e-08 ( -2.0796e-08  2.15514e-08 ) ergs/cm2
Time-resolved spectra
Distribution
T90 vs. Hardness ratio plot
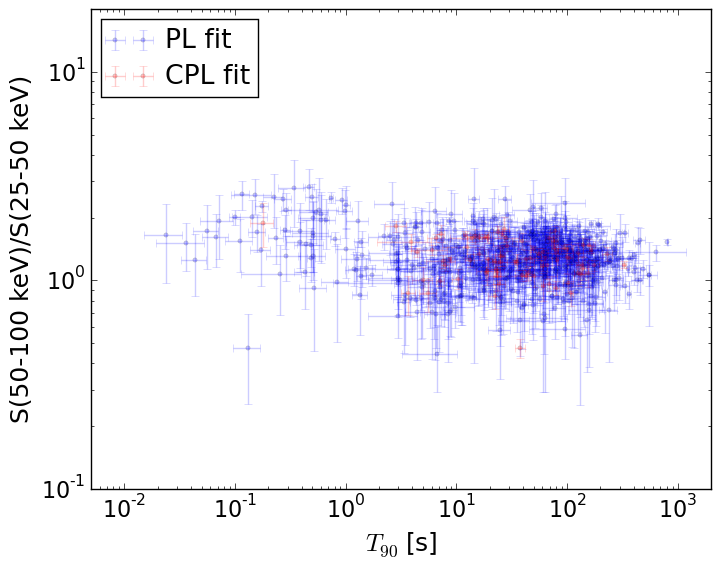
T90                                   = N/A sec.
Hardness ratio (energy fluence ratio) = N/A
S(15-50 keV) vs. S(50-150 keV) plot
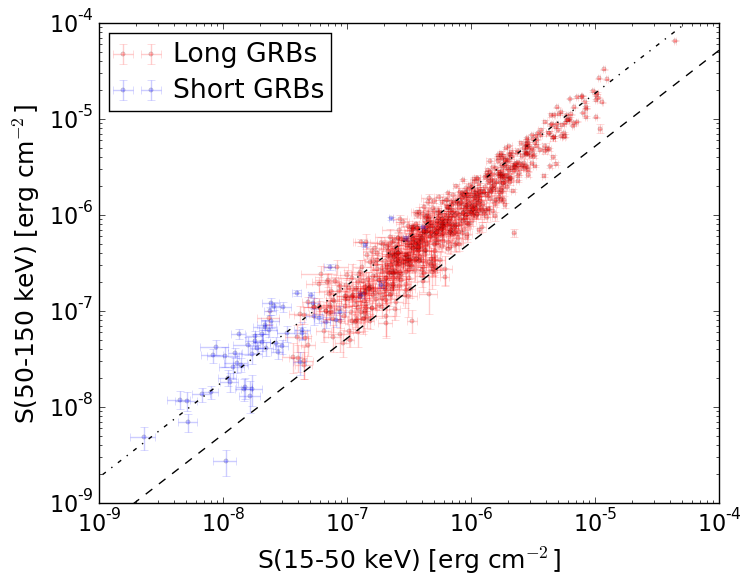
S(15-50 keV)  = N/A
S(50-150 keV) = N/A
The dash-dotted line and the dashed line traces the fluences calculated from the Band function with Epeak = 15 and 150 keV, respectively. Both lines assume a canonical values of alpha = -1 and beta = -2.5.
Mask shadow pattern
IMX = 2.129235424054261E-01, IMY = 6.526302976132271E-01
Spacecraft aspect plot
Bright source in the pre-burst/pre-slew/post-slew images
Pre-burst image of 15-350 keV band
Time interval of the image:
-524.123400 -507.848900
-239.424000 -18.424000

# RAcent  DECcent POSerr Theta    Phi  PeakCts   SNR AngSep     Name
#  [deg]    [deg]    ['] [deg]  [deg]                   [']
135.5239 -40.5250    1.1  34.4 -106.1   4.2251  10.3    1.8	Vela X-1
 45.7091 -27.4563    2.6  40.4   46.6   2.2915   4.5 ------	UNKNOWN
 73.8752 -83.8073    2.8  50.1  -37.1   2.7248   4.2 ------	UNKNOWN
Pre-slew background subtracted image of 15-350 keV band
Time interval of the image:
-18.424000 28.276600

# RAcent  DECcent POSerr Theta    Phi  PeakCts   SNR AngSep     Name
#  [deg]    [deg]    ['] [deg]  [deg]                   [']
135.5921 -40.6061    7.1  34.5 -106.0  -0.2518  -1.6    4.2	Vela X-1
104.9149  -6.5209    2.8  29.9  165.6   0.3759   4.1 ------	UNKNOWN
 83.5872 -60.5731    2.8  27.1  -30.0   0.3408   4.1 ------	UNKNOWN
128.3690  -8.7312    2.0  41.5 -158.9   0.7241   5.9 ------	UNKNOWN
128.6329 -59.1609    0.6  34.5  -71.9   2.7000  18.2 ------	UNKNOWN
Post-slew image of 15-350 keV band
Time interval of the image:
83.076600 839.295900
840.576000 962.640700

# RAcent  DECcent POSerr Theta    Phi  PeakCts   SNR AngSep     Name
#  [deg]    [deg]    ['] [deg]  [deg]                   [']
135.5187 -40.5633    0.8  19.1 -168.2   7.7641  14.6    0.7	Vela X-1
170.6162 -60.6953    4.9  20.8  -72.1   1.5219   2.4    9.8	Cen X-3
186.6597 -62.7691    2.9  27.5  -61.9   2.8753   3.9    0.1	GX 301-2
 12.8548 -59.6065    4.4  51.1   31.3  11.4035   2.6 ------	UNKNOWN
 62.0745 -77.2277    2.5  28.0   21.0   2.7397   4.7 ------	UNKNOWN
126.8293 -34.1001    2.7  25.1  172.1   2.7057   4.3 ------	UNKNOWN
131.8687  -3.3778    3.3  55.8  179.5   9.5852   3.5 ------	UNKNOWN
128.6262 -59.1466    2.1   0.0 -109.4   2.6948   5.4 ------	UNKNOWN
133.7369 -27.1629    2.4  32.2 -175.9   2.8833   4.8 ------	UNKNOWN
152.4910 -58.2937    0.9  12.4  -88.2   6.5312  12.3 ------	UNKNOWN