Analysis Summary
Notes:
- 1) No attempt has been made to eliminate the non-significant decimal places.
- 2) This batgrbproduct analysis is done using the HEASARC data.
- 3) This batgrbproduct analysis is using the flight position for the mask-weighting calculation.
======================================================================
BAT GRB EVENT DATA PROCESSING REPORT
Process Script Ver: batgrbproduct v2.46
Process Start Time: Sun Nov 23 17:40:00 EST 2014
Host Name: bat1
Current Working Dir: /local/data/bat1/alien/Swift_3rdBATcatalog/event/batevent_reproc/trigger618024
======================================================================
Trigger: 00618024 Segment: 000
BAT Trigger Time: 437205008 [s; MET]
Trigger Stop: 437205072 [s; MET]
UTC: 2014-11-09T05:49:55.236180 [includes UTCF correction]
Where From?: TDRSS position message
BAT
RA: 144.507384595436 Dec: -0.601526628868278 [deg; J2000]
Catalogged Source?: NO
Point Source?: YES
GRB Indicated?: YES [ by BAT flight software ]
Image S/N Ratio: 7.73
Image Trigger?: YES
Rate S/N Ratio: 0 [ if not an image trigger ]
Image S/N Ratio: 7.73
Analysis Position: [ source = BAT ]
RA: 144.507384595436 Dec: -0.601526628868278 [deg; J2000]
Refined Position: [ source = BAT pre-slew burst ]
RA: 144.507 Dec: -0.601526 [deg; J2000]
{ 09h 38m 01.7s , 00d -36' -5.5" }
+/- 2.55123760927 [arcmin] (estimated 90% radius based on SNR)
SNR: 7.98182995415
Angular difference between the analysis and refined position is 0.023074 arcmin
Partial Coding Fraction: 0.6015625 [ including projection effects ]
Duration
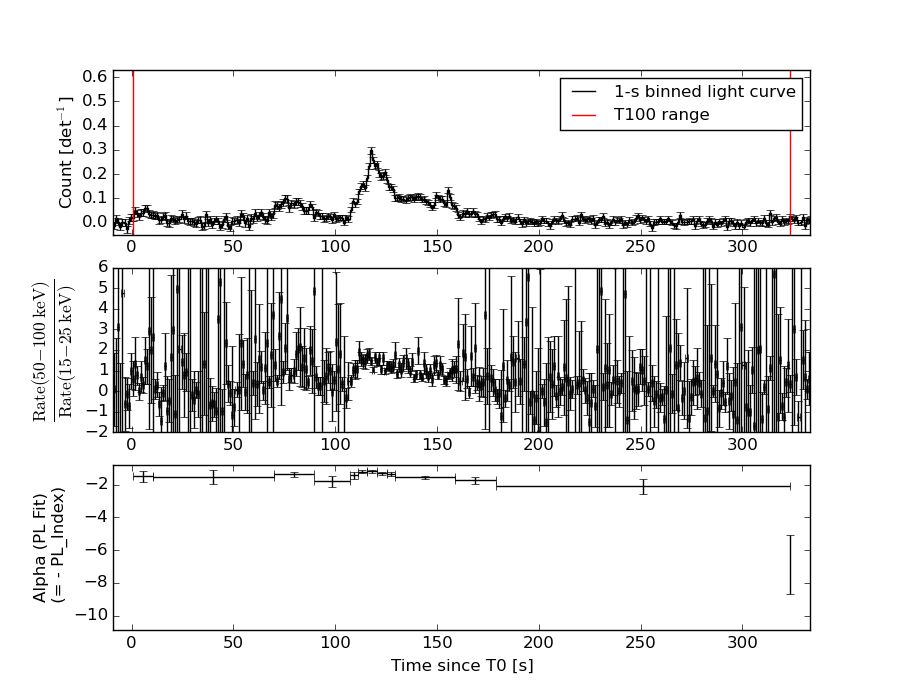
T90: 200.187999904156 +/- 48.1482022400133
Measured from: 16.9200000166893
to: 217.107999920845 [s; relative to TRIGTIME]
T50: 48.3439999818802 +/- 11.3944779637891
Measured from: 96.2879999876022
to: 144.631999969482 [s; relative to TRIGTIME]
Fluence
Peak Flux (peak 1 second)
Measured from: 117.39200001955
to: 118.39200001955 [s; relative to TRIGTIME]
Total Fluence
Measured from: 0.596000015735626
to: 323.152000010014 [s; relative to TRIGTIME]
Band 1 Band 2 Band 3 Band 4
15-25 25-50 50-100 100-350 keV
Total 2.980070 4.141428 3.178942 0.764430
0.114221 0.118789 0.103520 0.091623 [error]
Peak 0.071700 0.111624 0.101028 0.036412
0.006945 0.007944 0.007228 0.005974 [error]
[ fluence units of on-axis counts / fully illuminated detector ]
======================================================================
====== Table of the duration information =============================
Value tstart tstop
T100 322.556 0.596 323.152
T90 200.188 16.920 217.108
T50 48.344 96.288 144.632
Peak 1.000 117.392 118.392
====== Spectral Analysis Summary =====================================
Model : spectral model: simple power-law (PL) and cutoff power-law (CPL)
Ph_index : photon index: E^{Ph_index}
Ph_90err : 90% error of the photon index
Epeak : Epeak in keV
Epeak_90err: 90% error of Epeak
Norm : normalization at 50 keV in both the PL model and CPL model
Nomr_90err : 90% error of the normalization
chi2 : Chi-Squared
dof : degree of freedo
=== Time-averaged spectral analysis ===
(Best model with acceptable fit: PL)
Model Ph_index Ph_90err_low Ph_90err_hi Epeak Epeak_90err_low Epeak_90err_hi Norm Nomr_90err_low Norm_90err_hi chi2 dof
PL -1.510 -0.066 0.066 - - - 2.18e-03 -7.53e-05 7.52e-05 51.900 57
CPL -1.456 -0.085 0.246 512.002 -512.002 -512.002 2.31e-03 -3.60e-04 6.98e-04 51.760 56
=== 1-s peak spectral analysis ===
(Best model with acceptable fit: PL)
Model Ph_index Ph_90err_low Ph_90err_hi Epeak Epeak_90err_low Epeak_90err_hi Norm Nomr_90err_low Norm_90err_hi chi2 dof
PL -1.181 -0.129 0.130 - - - 2.06e-02 -1.49e-03 1.49e-03 51.180 57
CPL -1.134 -0.179 0.285 969.537 -969.537 -969.537 2.17e-02 -2.52e-03 6.86e-03 51.500 56
=== Fluence/Peak Flux Summary ===
Model Band1 Band2 Band3 Band4 Band5 Total
15-25 25-50 50-100 100-350 15-150 15-350 keV
Fluence PL 9.06e-07 1.66e-06 2.33e-06 6.85e-06 6.66e-06 1.17e-05 erg/cm2
90%_error_low -5.92e-08 -6.29e-08 -1.04e-07 -6.72e-07 -2.49e-07 -7.39e-07 erg/cm2
90%_error_hi 6.06e-08 6.27e-08 1.04e-07 7.23e-07 2.50e-07 7.80e-07 erg/cm2
Peak flux PL 6.25e-01 7.60e-01 6.71e-01 1.02e+00 2.41e+00 3.07e+00 ph/cm2/s
90%_error_low -8.60e-02 -6.45e-02 -5.78e-02 -1.77e-01 -1.78e-01 -2.40e-01 ph/cm2/s
90%_error_hi 8.95e-02 6.36e-02 5.73e-02 2.00e-01 1.78e-01 2.44e-01 ph/cm2/s
Fluence CPL 8.96e-07 1.66e-06 2.33e-06 6.31e-06 6.63e-06 1.12e-05 erg/cm2
90%_error_low -7.31e-08 -6.51e-08 -1.07e-07 -1.89e-06 -2.82e-07 -1.90e-06 erg/cm2
90%_error_hi 6.12e-08 6.96e-08 1.11e-07 1.58e-06 2.57e-07 7.87e-07 erg/cm2
Peak flux CPL 6.31e-01 7.56e-01 6.65e-01 1.16e+00 2.42e+00 3.22e+00 ph/cm2/s
90%_error_low N/A -7.46e-02 N/A N/A -1.93e-01 -5.07e-01 ph/cm2/s
90%_error_hi N/A 8.25e-02 N/A N/A 1.63e-01 7.20e-02 ph/cm2/s
======================================================================
Image
Pre-slew 15.0-50.0 keV image (Event data)
#RAcent DECcent POSerr Theta  Phi  Peak_Cts  SNR Name
144.507 -0.602 0.000 22.337 70.049 0.663 7.982 TRIG_00618024

Image time interval: 0.000 to 64.000 [sec]
Light Curves
Note: The mask-weighted lightcurves have units of either count/det or counts/sec/det, where a det is 0.4 x 0.4 = 0.16 sq cm.
Full-time range; 1 s binning
Other quick-look light curves:
- 64 ms binning (zoomed)
- 16 ms binning (zoomed)
- 8 ms binning (zoomed)
- 2 ms binning (zoomed)
- SN=5 or 10 s binning (full-time range)
- Raw light curve
Spectra
- 64 ms binning (zoomed)
- 16 ms binning (zoomed)
- 8 ms binning (zoomed)
- 2 ms binning (zoomed)
- SN=5 or 10 s binning (full-time range)
- Raw light curve
Spectra
Notes:
- 1) The fitting includes the systematic errors.
- 2) When the burst includes telescope slew time periods, the fitting uses an average response file made from multiple 5-s response files through out the slew time plus single time preiod for the non-slew times, and weighted by the total counts in the corresponding time period using addrmf. An average response file is needed becuase a spectral fit using the pre-slew DRM will introduce some errors in both a spectral shape and a normalization if the PHA file contains a lot of the slew/post-slew time interval.
- 3) For fits to more complicated models (e.g. a power-law over a cutoff power-law), the BAT team has decided to require a chi-square improvement of more than 6 for each extra dof.
Time averaged spectrum fit using the average DRM
Power-law model
Time interval is from    0.596 sec. to  323.152 sec.

Spectral model in power-law:
------------------------------------------------------------
Parameters  : value       lower 90%   higher 90%
Photon index: -1.50969     ( -0.0657611   0.0656952 )
Norm@50keV  : 2.18047E-03    ( -7.52901e-05   7.51969e-05 )
------------------------------------------------------------
#Fit statistic : Chi-Squared =          51.90 using 59 PHA bins.
# Reduced chi-squared =         0.9104 for     57 degrees of freedom
# Null hypothesis probability =   6.664733e-01

Photon flux (15-150 keV)    in 322.6 sec: 0.272931 ( -0.009954  0.009988 ) ph/cm2/s
Energy fluence (15-150 keV)             : 6.66337e-06 ( -2.4914e-07  2.50075e-07 ) ergs/cm2
Cutoff power-law model
Time interval is from    0.596 sec. to  323.152 sec.
Spectral model in the cutoff power-law:
------------------------------------------------------------
Parameters  : value       lower 90%   higher 90%
Photon index: -1.45625     ( -0.0844678   0.246558 )
Epeak [keV] : 512.002      ( -536.195 -536.195 )
Norm@50keV  : 2.31342E-03    ( -0.000359072   0.000699257 )
------------------------------------------------------------
#Fit statistic : Chi-Squared =          51.76 using 59 PHA bins.
# Reduced chi-squared =         0.9243 for     56 degrees of freedom
# Null hypothesis probability =   6.358710e-01

Photon flux (15-150 keV)    in 322.6 sec: 0.271927 ( -0.010861  0.010305 ) ph/cm2/s
Energy fluence (15-150 keV)             : 6.63382e-06 ( -2.81614e-07  2.56899e-07 ) ergs/cm2
1-s peak spectrum fit
Power-law model

Time interval is from  117.392 sec. to  118.392 sec.

Spectral model in power-law:
------------------------------------------------------------
Parameters  : value       lower 90%   higher 90%
Photon index: -1.18091     ( -0.128912   0.130296 )
Norm@50keV  : 2.05871E-02    ( -0.00148821   0.00148795 )
------------------------------------------------------------
#Fit statistic : Chi-Squared =          51.18 using 59 PHA bins.
# Reduced chi-squared =         0.8979 for     57 degrees of freedom
# Null hypothesis probability =   6.920649e-01

Photon flux (15-150 keV)    in 1 sec: 2.41023 ( -0.17755  0.17779 ) ph/cm2/s
Energy fluence (15-150 keV)             : 2.10029e-07 ( -1.72454e-08  1.7376e-08 ) ergs/cm2
Cutoff power-law model
Time interval is from  117.392 sec. to  118.392 sec.
Spectral model in the cutoff power-law:
------------------------------------------------------------
Parameters  : value       lower 90%   higher 90%
Photon index: -1.17668     ( -0.179116   0.285183 )
Epeak [keV] : 9999.33      ( -9999.34 -9999.34 )
Norm@50keV  : 2.06883E-02    ( -0.00149473   0.00788347 )
------------------------------------------------------------
#Fit statistic : Chi-Squared =          51.21 using 59 PHA bins.
# Reduced chi-squared =         0.9144 for     56 degrees of freedom
# Null hypothesis probability =   6.564857e-01

Photon flux (15-150 keV)    in 1 sec: 2.42476 ( -0.19256  0.16277 ) ph/cm2/s
Energy fluence (15-150 keV)             : 2.09952e-07 ( -1.72705e-08  1.7364e-08 ) ergs/cm2
Time-resolved spectra
Distribution
T90 vs. Hardness ratio plot
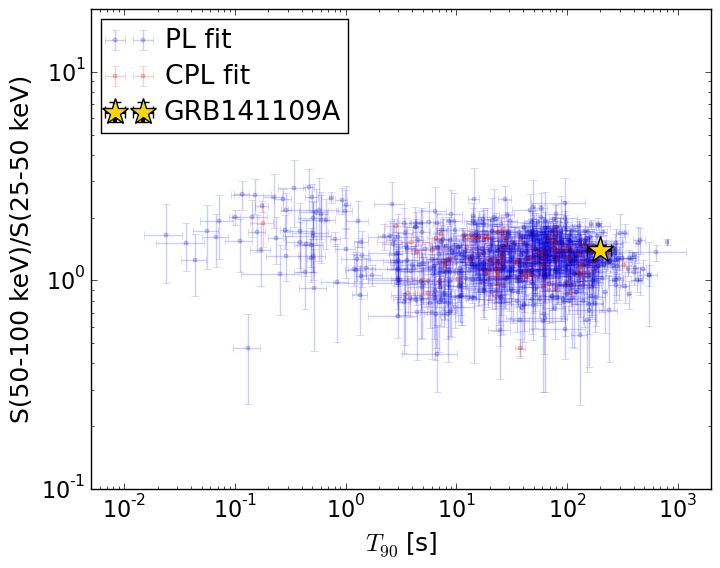
T90                                   = 200.188 sec.
Hardness ratio (energy fluence ratio) = 1.40478586226
S(15-50 keV) vs. S(50-150 keV) plot
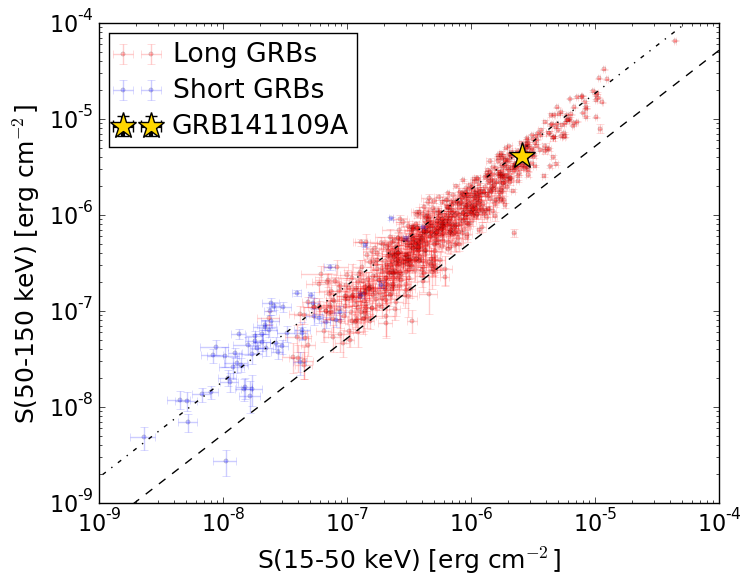
S(15-50 keV)  = 2.5620986e-06
S(50-150 keV) = 4.101351e-06
The dash-dotted line and the dashed line traces the fluences calculated from the Band function with Epeak = 15 and 150 keV, respectively. Both lines assume a canonical values of alpha = -1 and beta = -2.5.
Mask shadow pattern
IMX = 0.140201622092, IMY = -0.38623325455
Spacecraft aspect plot
Bright source in the pre-burst/pre-slew/post-slew images
Pre-burst image of 15-350 keV band
Time interval of the image:
-17.499410 0.596000

# RAcent  DECcent POSerr Theta    Phi  PeakCts   SNR AngSep     Name
#  [deg]    [deg]    ['] [deg]  [deg]                   [']
135.6902 -40.4569    8.0  51.8   18.8   0.2976   1.5    9.4	Vela X-1
127.8659  15.3657    2.5  40.1   99.5   0.9227   4.6 ------	UNKNOWN
149.2154  53.4782    2.8  52.5  156.1   1.0301   4.2 ------	UNKNOWN
200.7789  46.4804    2.2  52.7 -161.9   0.6374   5.2 ------	UNKNOWN
Pre-slew background subtracted image of 15-350 keV band
Time interval of the image:
0.596000 73.900600

# RAcent  DECcent POSerr Theta    Phi  PeakCts   SNR AngSep     Name
#  [deg]    [deg]    ['] [deg]  [deg]                   [']
135.4689 -40.4681    5.8  51.9   18.9   1.8138   2.0    5.9	Vela X-1
144.5581  -0.5858    1.8  22.3   70.1   1.7040   6.4 ------	UNKNOWN
181.7213  55.5027    3.0  53.9  179.6   2.7169   3.9 ------	UNKNOWN
213.8152  35.4277    2.5  54.4 -143.6   4.9608   4.6 ------	UNKNOWN
Post-slew image of 15-350 keV band
Time interval of the image:
118.300590 520.800680

# RAcent  DECcent POSerr Theta    Phi  PeakCts   SNR AngSep     Name
#  [deg]    [deg]    ['] [deg]  [deg]                   [']
135.5309 -40.5491    0.6  40.8   -6.3   9.7194  19.9    0.4	Vela X-1
144.5246  -0.6068    0.6   0.0  173.9   6.8833  20.0 ------	UNKNOWN
184.3653  47.0385    3.9  59.0 -166.2   6.9393   3.0 ------	UNKNOWN
167.8610  -6.9441    2.6  24.1  -91.0   1.8100   4.5 ------	UNKNOWN
184.7662  21.3466    2.8  45.0 -138.5   3.1592   4.1 ------	UNKNOWN
174.1213 -34.0324    2.8  43.4  -53.4   4.3099   4.1 ------	UNKNOWN