Analysis Summary
Notes:
- 1) No attempt has been made to eliminate the non-significant decimal places.
- 2) This batgrbproduct analysis is done using the HEASARC data.
- 3) This batgrbproduct analysis is using the flight position for the mask-weighting calculation.
==========================================================================
BAT GROUND-DETECTED GRB DATA PROCESSING REPORT
Process Script: hand-made scripts that follow steps in batgrbproduct
but without using TDRSS info
Process Start Time: Wed Apr 1 14:16:16 EDT 2015
Host Name: bat1
Current Working Dir: /local/data/bat1/alien/Swift_3rdBATcatalog/event/ground_detect_bursts/scripts
==========================================================================
BAT Trigger Time: 439459530.048
UTC: 2014-12-05T08:05:17.172 [includes UTCF correction]
Where From?: Ground analysis (best_duration.txt)
NOTE: BAT trigger time for ground-detected burst is the T100 start time.
Analysis Position: [ source = GCN ]
RA: 92.859 Dec: 37.876 [deg; J2000]
Refined Position: [ source = BAT pre-slew image ]
RA: 92.859 Dec: 37.876 [deg; J2000]
{ 06h 11m 26.2s , +37d 52' 33.6" }
+/- 2.52437807907 [arcmin] (estimated 90% radius based on SNR)
SNR: 8.10343049848
Angular difference between the analysis and refined position is 0.000000 arcmin
Partial Coding Fraction: 4.179688e-01 [ including projection effects ]
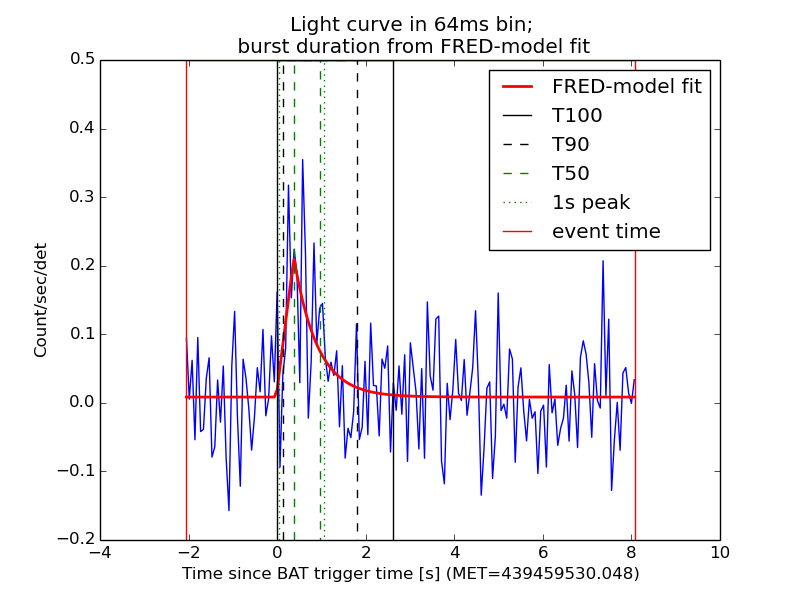
Duration (found by FRED-model fit)
T90: 1.664 +/- N/A
Measured from: 0.128
to: 1.792 [s; relative to TRIGTIME]
T50: 0.576 +/- N/A
Measured from: 0.384
to: 0.96
====== Table of the duration information =============================
Value tstart tstop
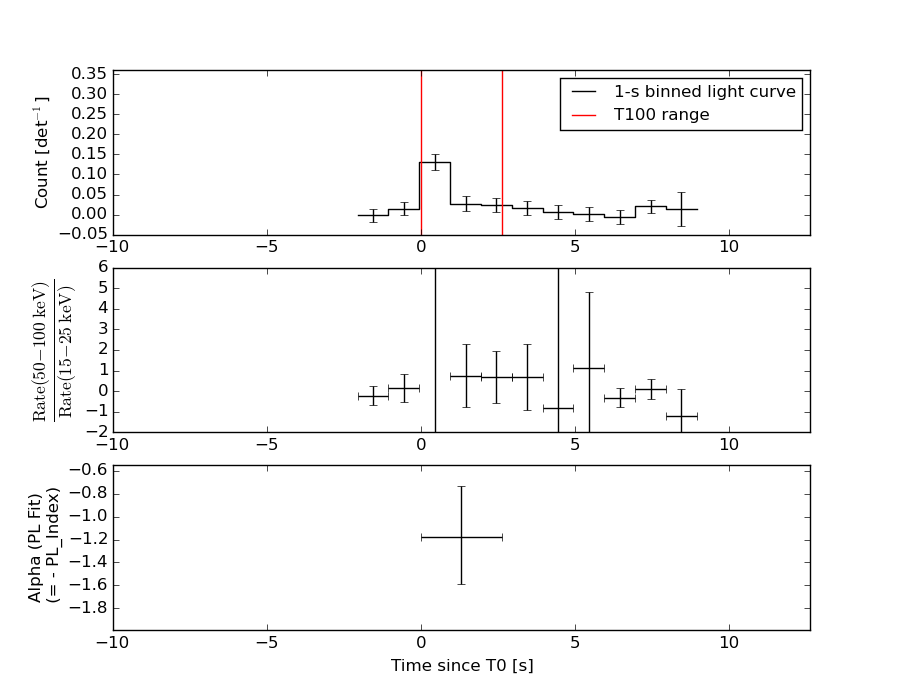
T100 2.624 0.000 2.624
T90 1.664 0.128 1.792
T50 0.576 0.384 0.960
Peak 1.000 -0.124 0.876
====== Spectral Analysis Summary =====================================
Model : spectral model: simple power-law (PL) and cutoff power-law (CPL)
Ph_index : photon index: E^{Ph_index}
Ph_90err : 90% error of the photon index
Epeak : Epeak in keV
Epeak_90err: 90% error of Epeak
Norm : normalization at 50 keV in both the PL model and CPL model
Nomr_90err : 90% error of the normalization
chi2 : Chi-Squared
dof : degree of freedo
=== Time-averaged spectral analysis ===
(Best model with acceptable fit: N/A)
Model Ph_index Ph_90err_low Ph_90err_hi Epeak Epeak_90err_low Epeak_90err_hi Norm Nomr_90err_low Norm_90err_hi chi2 dof
PL -1.178 -0.415 0.445 - - - 4.56e-03 -1.27e-03 1.26e-03 80.360 57
CPL 3.312 -1.357 -3.312 54.173 -11.343 4.477 9.71e-01 -9.71e-01 3.43e+03 71.610 56
=== 1-s peak spectral analysis ===
(Best model with acceptable fit: N/A)
Model Ph_index Ph_90err_low Ph_90err_hi Epeak Epeak_90err_low Epeak_90err_hi Norm Nomr_90err_low Norm_90err_hi chi2 dof
PL -0.769 -0.397 0.453 - - - 9.03e-03 -2.33e-03 2.25e-03 74.420 57
CPL 0.582 -1.530 7.599 102.085 -36.253 -102.085 3.94e-02 -3.94e-02 1.07e+02 73.360 56
=== Fluence/Peak Flux Summary ===
Model Band1 Band2 Band3 Band4 Band5 Total
15-25 25-50 50-100 100-350 15-150 15-350 keV
Fluence PL 1.13e-08 2.53e-08 4.48e-08 1.86e-07 1.22e-07 2.67e-07 erg/cm2
90%_error_low -5.05e-09 -7.94e-09 -1.40e-08 -9.62e-08 -3.60e-08 -1.10e-07 erg/cm2
90%_error_hi 5.81e-09 7.83e-09 1.40e-08 1.52e-07 3.68e-08 1.58e-07 erg/cm2
Peak flux PL 1.86e-01 2.89e-01 3.40e-01 7.70e-01 1.04e+00 1.58e+00 ph/cm2/s
90%_error_low -8.89e-02 -9.64e-02 -8.12e-02 -3.31e-01 -2.53e-01 -4.05e-01 ph/cm2/s
90%_error_hi 1.09e-01 9.48e-02 8.08e-02 4.91e-01 2.56e-01 4.61e-01 ph/cm2/s
Fluence CPL 4.07e-09 5.74e-09 5.73e-09 1.43e-08 1.89e-08 3.34e-08 erg/cm2
90%_error_low N/A N/A N/A N/A N/A N/A erg/cm2
90%_error_hi N/A N/A N/A N/A N/A N/A erg/cm2
Peak flux CPL 1.38e-01 3.20e-01 3.81e-01 2.22e-01 9.87e-01 1.06e+00 ph/cm2/s
90%_error_low -1.04e-01 -1.14e-01 -1.05e-01 -2.22e-01 -3.07e-01 -3.82e-01 ph/cm2/s
90%_error_hi 1.31e-01 1.45e-01 1.05e-01 5.76e-01 2.73e-01 7.39e-01 ph/cm2/s
======================================================================
Image
15.0-350.0 keV image (Event data)
#RAcent DECcent POSerr Theta  Phi  Peak_Cts  SNR Name
92.859 37.876 0.000 30.003 126.458 0.218 6.816 TRIG_00620534

Image time interval: 0.000 to 2.624 [sec]
Light Curves
Note: The mask-weighted lightcurves have units of either count/det or counts/sec/det, where a det is 0.4 x 0.4 = 0.16 sq cm.
Best duration plot
Full-time range; 1 s binning
Other quick-look light curves:
- 64 ms binning (zoomed)
- 16 ms binning (zoomed)
- 8 ms binning (zoomed)
- 2 ms binning (zoomed)
- SN=5 or 10 s binning (full-time range)
- Raw light curve
Spectra
- 64 ms binning (zoomed)
- 16 ms binning (zoomed)
- 8 ms binning (zoomed)
- 2 ms binning (zoomed)
- SN=5 or 10 s binning (full-time range)
- Raw light curve
Spectra
Notes:
- 1) The fitting includes the systematic errors.
- 2) When the burst includes telescope slew time periods, the fitting uses an average response file made from multiple 5-s response files through out the slew time plus single time preiod for the non-slew times, and weighted by the total counts in the corresponding time period using addrmf. An average response file is needed becuase a spectral fit using the pre-slew DRM will introduce some errors in both a spectral shape and a normalization if the PHA file contains a lot of the slew/post-slew time interval.
- 3) For fits to more complicated models (e.g. a power-law over a cutoff power-law), the BAT team has decided to require a chi-square improvement of more than 6 for each extra dof.
Time averaged spectrum fit using the average DRM
Power-law model
Time interval is from    0.000 sec. to    2.624 sec.

Spectral model in power-law:
------------------------------------------------------------
Parameters  : value       lower 90%   higher 90%
Photon index: -1.1784     ( -0.417943   0.442369 )
Norm@50keV  : 4.56437E-03    ( -0.00126555   0.00126488 )
------------------------------------------------------------
#Fit statistic : Chi-Squared =          80.36 using 59 PHA bins.
# Reduced chi-squared =          1.410 for     57 degrees of freedom
# Null hypothesis probability =   2.243748e-02

Photon flux (15-150 keV)    in 2.624 sec: 0.534039 ( -0.151215  0.152374 ) ph/cm2/s
Energy fluence (15-150 keV)             : 1.22336e-07 ( -3.60472e-08  3.68205e-08 ) ergs/cm2
Cutoff power-law model
Time interval is from    0.000 sec. to    2.624 sec.
Spectral model in the cutoff power-law:
------------------------------------------------------------
Parameters  : value       lower 90%   higher 90%
Photon index: 7.31695     ( -5.33921   -7.29344 )
Epeak [keV] : 49.1694      ( -6.3671 9.45293 )
Norm@50keV  : 119.105    ( -112.605   3315.6 )
------------------------------------------------------------
#Fit statistic : Chi-Squared =          69.95 using 59 PHA bins.
# Reduced chi-squared =          1.249 for     56 degrees of freedom
# Null hypothesis probability =   9.950245e-02

Photon flux (15-150 keV)    in 2.624 sec: 0.430749 ( -0.119712  0.142814 ) ph/cm2/s
Energy fluence (15-150 keV)             : 1.88701e-08 ( 0  0 ) ergs/cm2
1-s peak spectrum fit
Power-law model
Time interval is from   -0.124 sec. to    0.876 sec.

Spectral model in power-law:
------------------------------------------------------------
Parameters  : value       lower 90%   higher 90%
Photon index: -0.76937     ( -0.39664   0.453131 )
Norm@50keV  : 9.03386E-03    ( -0.00232574   0.00225487 )
------------------------------------------------------------
#Fit statistic : Chi-Squared =          74.42 using 59 PHA bins.
# Reduced chi-squared =          1.306 for     57 degrees of freedom
# Null hypothesis probability =   6.047521e-02

Photon flux (15-150 keV)    in 1 sec: 1.03960 ( -0.253276  0.25601 ) ph/cm2/s
Energy fluence (15-150 keV)             : 1.06962e-07 ( -2.6218e-08  2.64792e-08 ) ergs/cm2
Cutoff power-law model
Time interval is from   -0.124 sec. to    0.876 sec.
Spectral model in the cutoff power-law:
------------------------------------------------------------
Parameters  : value       lower 90%   higher 90%
Photon index: 0.581714     ( -1.5321   7.59687 )
Epeak [keV] : 102.085      ( -36.0124 -101.844 )
Norm@50keV  : 3.93504E-02    ( -0.0396569   107.46 )
------------------------------------------------------------
#Fit statistic : Chi-Squared =          73.36 using 59 PHA bins.
# Reduced chi-squared =          1.310 for     56 degrees of freedom
# Null hypothesis probability =   5.964644e-02

Photon flux (15-150 keV)    in 1 sec: 0.986669 ( -0.306801  0.272741 ) ph/cm2/s
Energy fluence (15-150 keV)             : 9.54817e-08 ( -4.24897e-08  3.30263e-08 ) ergs/cm2
Time-resolved spectra
Distribution
T90 vs. Hardness ratio plot
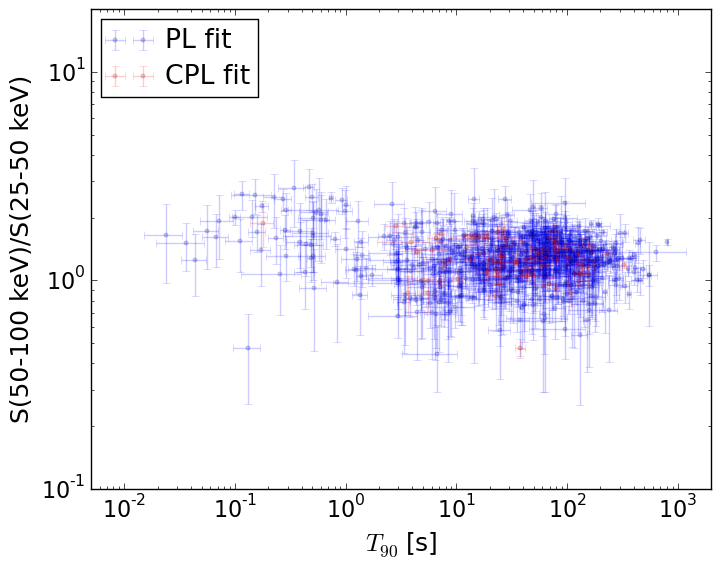
T90                                   = N/A sec.
Hardness ratio (energy fluence ratio) = N/A
S(15-50 keV) vs. S(50-150 keV) plot
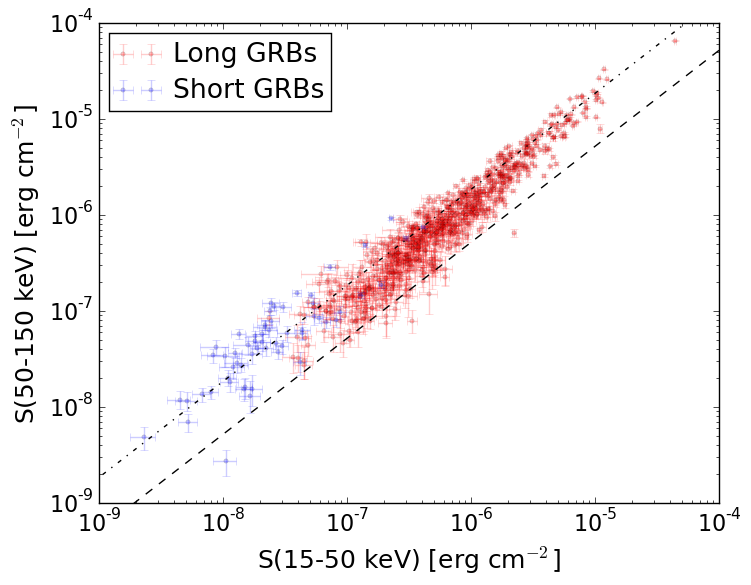
S(15-50 keV)  = N/A
S(50-150 keV) = N/A
The dash-dotted line and the dashed line traces the fluences calculated from the Band function with Epeak = 15 and 150 keV, respectively. Both lines assume a canonical values of alpha = -1 and beta = -2.5.
Mask shadow pattern
IMX = -0.343120299395, IMY = -0.464419669678
Spacecraft aspect plot

Bright source in the event data image
Event data image of 15-350 keV band
Time interval of the image:
-2.048000 8.091300

# RAcent  DECcent POSerr Theta    Phi  PeakCts   SNR AngSep     Name
#  [deg]    [deg]    ['] [deg]  [deg]                   [']
 83.6388  22.0422    2.5  36.1   95.5   0.4947   4.6    1.7	Crab
 81.0339  15.4092    2.1  39.9   85.8   0.9388   5.5 ------	UNKNOWN
103.3690 -10.5357    2.2  37.8   30.1   0.3238   5.1 ------	UNKNOWN
 97.0665  45.6226    2.3  31.4  142.7   0.2717   5.2 ------	UNKNOWN
Webpage updated on:
Tue Nov 24 13:00:32 EST 2015