Analysis Summary
Notes:
- 1) No attempt has been made to eliminate the non-significant decimal places.
- 2) This batgrbproduct analysis is done using the HEASARC data.
- 3) This batgrbproduct analysis is using the flight position for the mask-weighting calculation.
======================================================================
BAT GRB EVENT DATA PROCESSING REPORT
Process Script Ver: batgrbproduct v2.46
Process Start Time: Sun Jan 4 09:35:36 EST 2015
Host Name: bat1
Current Working Dir: /local/data/bat1/alien/Swift_3rdBATcatalog/event/batevent_reproc/trigger621234
======================================================================
Trigger: 00621234 Segment: 000
BAT Trigger Time: 440083441.152 [s; MET]
Trigger Stop: 440083442.176 [s; MET]
UTC: 2014-12-12T13:23:48.244720 [includes UTCF correction]
Where From?: TDRSS position message
BAT
RA: 250.868604999012 Dec: 31.7493121278424 [deg; J2000]
Catalogged Source?: NO
Point Source?: YES
GRB Indicated?: YES [ by BAT flight software ]
Image S/N Ratio: 7.17
Image Trigger?: NO
Rate S/N Ratio: 11.7473401244707 [ if not an image trigger ]
Image S/N Ratio: 7.17
Analysis Position: [ source = BAT ]
RA: 250.868604999012 Dec: 31.7493121278424 [deg; J2000]
Refined Position: [ source = BAT pre-slew burst ]
RA: 250.865793907996 Dec: 31.7510698624626 [deg; J2000]
{ 16h 43m 27.8s , +31d 45' 03.9" }
+/- 1.00452161809235 [arcmin] (estimated 90% radius based on SNR)
+/- 0.376291693377804 [arcmin] (formal 1-sigma fit error)
SNR: 30.2217353233513
Angular difference between the analysis and refined position is 0.178026 arcmin
Partial Coding Fraction: 0.7734375 [ including projection effects ]
Duration
T90: 10.5079999566078 +/- 0.685623802051872
Measured from: 0.759999990463257
to: 11.2679999470711 [s; relative to TRIGTIME]
T50: 2.24799996614456 +/- 0.599212802618918
Measured from: 4.10799998044968
to: 6.35599994659424 [s; relative to TRIGTIME]
Fluence
Peak Flux (peak 1 second)
Measured from: 4.09999996423721
to: 5.09999996423721 [s; relative to TRIGTIME]
Total Fluence
Measured from: -0.0600000023841858
to: 12.1359999775887 [s; relative to TRIGTIME]
Band 1 Band 2 Band 3 Band 4
15-25 25-50 50-100 100-350 keV
Total 0.447133 0.700886 0.544585 0.110974
0.029715 0.031316 0.028076 0.022399 [error]
Peak 0.086392 0.183245 0.176457 0.050354
0.009470 0.010949 0.010714 0.007643 [error]
[ fluence units of on-axis counts / fully illuminated detector ]
======================================================================
====== Table of the duration information =============================
Value tstart tstop
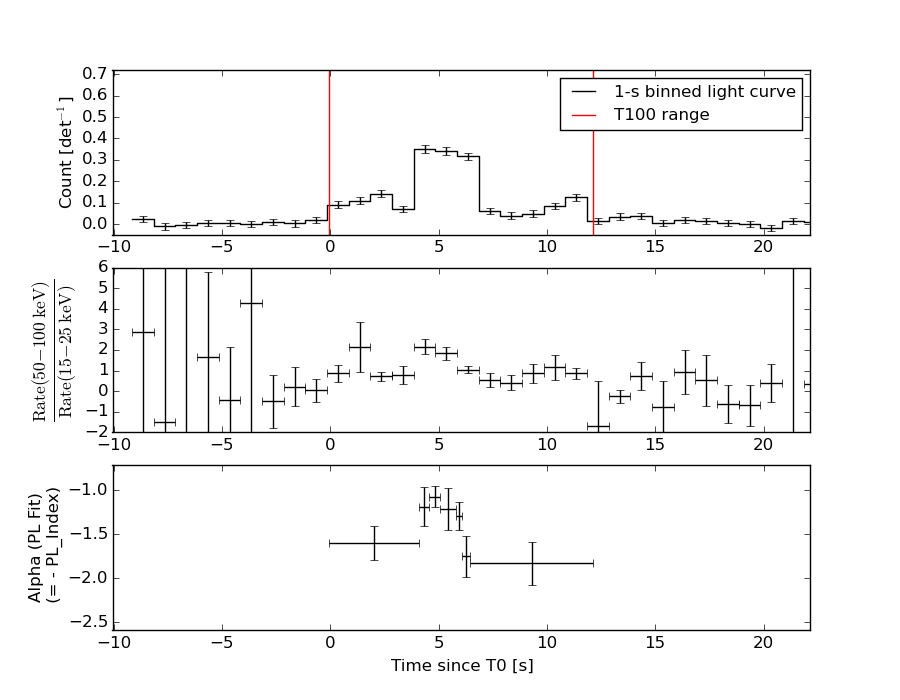
T100 12.196 -0.060 12.136
T90 10.508 0.760 11.268
T50 2.248 4.108 6.356
Peak 1.000 4.100 5.100
====== Spectral Analysis Summary =====================================
Model : spectral model: simple power-law (PL) and cutoff power-law (CPL)
Ph_index : photon index: E^{Ph_index}
Ph_90err : 90% error of the photon index
Epeak : Epeak in keV
Epeak_90err: 90% error of Epeak
Norm : normalization at 50 keV in both the PL model and CPL model
Nomr_90err : 90% error of the normalization
chi2 : Chi-Squared
dof : degree of freedo
=== Time-averaged spectral analysis ===
(Best model with acceptable fit: PL)
Model Ph_index Ph_90err_low Ph_90err_hi Epeak Epeak_90err_low Epeak_90err_hi Norm Nomr_90err_low Norm_90err_hi chi2 dof
PL -1.460 -0.089 0.089 - - - 1.02e-02 -5.22e-04 5.21e-04 47.710 57
CPL -1.065 -0.339 0.368 121.704 -35.901 338.300 1.59e-02 -4.97e-03 7.99e-03 43.670 56
=== 1-s peak spectral analysis ===
(Best model with acceptable fit: CPL)
Model Ph_index Ph_90err_low Ph_90err_hi Epeak Epeak_90err_low Epeak_90err_hi Norm Nomr_90err_low Norm_90err_hi chi2 dof
PL -1.114 -0.106 0.107 - - - 3.37e-02 -2.20e-03 2.20e-03 60.170 57
CPL -0.381 -0.443 0.496 120.862 -28.672 97.113 7.45e-02 -2.78e-02 5.04e-02 51.670 56
=== Fluence/Peak Flux Summary ===
Model Band1 Band2 Band3 Band4 Band5 Total
15-25 25-50 50-100 100-350 15-150 15-350 keV
Fluence PL 1.53e-07 2.87e-07 4.18e-07 1.29e-06 1.19e-06 2.15e-06 erg/cm2
90%_error_low -1.37e-08 -1.58e-08 -2.71e-08 -1.73e-07 -6.61e-08 -1.94e-07 erg/cm2
90%_error_hi 1.41e-08 1.58e-08 2.70e-08 1.90e-07 6.64e-08 2.08e-07 erg/cm2
Peak flux PL 9.59e-01 1.22e+00 1.12e+00 1.82e+00 3.91e+00 5.12e+00 ph/cm2/s
90%_error_low -1.16e-01 -9.42e-02 -8.19e-02 -2.59e-01 -2.62e-01 -3.56e-01 ph/cm2/s
90%_error_hi 1.21e-01 9.35e-02 8.15e-02 2.84e-01 2.62e-01 3.60e-01 ph/cm2/s
Fluence CPL 1.42e-07 2.98e-07 4.30e-07 7.40e-07 1.15e-06 1.61e-06 erg/cm2
90%_error_low -1.63e-08 -1.85e-08 -2.96e-08 -2.65e-07 -7.23e-08 -2.72e-07 erg/cm2
90%_error_hi 1.66e-08 1.88e-08 3.00e-08 4.49e-07 7.22e-08 4.46e-07 erg/cm2
Peak flux CPL 8.15e-01 1.29e+00 1.22e+00 9.15e-01 3.83e+00 4.24e+00 ph/cm2/s
90%_error_low -1.40e-01 -1.08e-01 -1.01e-01 -2.92e-01 -2.67e-01 -3.97e-01 ph/cm2/s
90%_error_hi 1.45e-01 1.10e-01 1.03e-01 4.50e-01 2.67e-01 4.95e-01 ph/cm2/s
======================================================================
Image
Pre-slew 15.0-350.0 keV image (Event data)
#   RAcent    DECcent   POSerr    Theta     Phi              Peak Cts       SNR   Name
  250.8658    31.7511   0.0064    30.1980     0.5788         1.7227268     30.222 TRIG_00621234

Foreground time interval of the image:
 -0.060  10.949 (delta_t =  11.009 [sec])
Background time interval of the image:
-239.152  -0.060 (delta_t = 239.092 [sec])
Light Curves
Note: The mask-weighted lightcurves have units of either count/det or counts/sec/det, where a det is 0.4 x 0.4 = 0.16 sq cm.
Full-time range; 1 s binning
Other quick-look light curves:
Spectra
Notes:
- 1) The fitting includes the systematic errors.
- 2) When the burst includes telescope slew time periods, the fitting uses an average response file made from multiple 5-s response files through out the slew time plus single time preiod for the non-slew times, and weighted by the total counts in the corresponding time period using addrmf. An average response file is needed becuase a spectral fit using the pre-slew DRM will introduce some errors in both a spectral shape and a normalization if the PHA file contains a lot of the slew/post-slew time interval.
- 3) For fits to more complicated models (e.g. a power-law over a cutoff power-law), the BAT team has decided to require a chi-square improvement of more than 6 for each extra dof.
Time averaged spectrum fit using the average DRM
Power-law model
Time interval is from   -0.060 sec. to   12.136 sec.

Spectral model in power-law:
------------------------------------------------------------
Parameters  : value       lower 90%   higher 90%
Photon index: -1.46017     ( -0.088904   0.0887968 )
Norm@50keV  : 1.01740E-02    ( -0.000521646   0.000521084 )
------------------------------------------------------------
#Fit statistic : Chi-Squared =          47.71 using 59 PHA bins.
# Reduced chi-squared =         0.8370 for     57 degrees of freedom
# Null hypothesis probability =   8.048811e-01

Photon flux (15-150 keV)    in 12.2 sec: 1.25703 ( -0.0663  0.06639 ) ph/cm2/s
Energy fluence (15-150 keV)             : 1.18571e-06 ( -6.60952e-08  6.63892e-08 ) ergs/cm2
Cutoff power-law model
Time interval is from   -0.060 sec. to   12.136 sec.
Spectral model in the cutoff power-law:
------------------------------------------------------------
Parameters  : value       lower 90%   higher 90%
Photon index: -1.0645     ( -0.339258   0.367801 )
Epeak [keV] : 121.704      ( -35.901 338.3 )
Norm@50keV  : 1.59367E-02    ( -0.00497421   0.0079873 )
------------------------------------------------------------
#Fit statistic : Chi-Squared =          43.67 using 59 PHA bins.
# Reduced chi-squared =         0.7799 for     56 degrees of freedom
# Null hypothesis probability =   8.846982e-01

Photon flux (15-150 keV)    in 12.2 sec: 1.23303 ( -0.06931  0.06934 ) ph/cm2/s
Energy fluence (15-150 keV)             : 1.15319e-06 ( -7.23009e-08  7.21624e-08 ) ergs/cm2
1-s peak spectrum fit
Power-law model
Time interval is from    4.100 sec. to    5.100 sec.

Spectral model in power-law:
------------------------------------------------------------
Parameters  : value       lower 90%   higher 90%
Photon index: -1.11354     ( -0.105636   0.106849 )
Norm@50keV  : 3.37020E-02    ( -0.00220365   0.00220299 )
------------------------------------------------------------
#Fit statistic : Chi-Squared =          60.17 using 59 PHA bins.
# Reduced chi-squared =          1.056 for     57 degrees of freedom
# Null hypothesis probability =   3.618685e-01

Photon flux (15-150 keV)    in 1 sec: 3.91449 ( -0.26194  0.2622 ) ph/cm2/s
Energy fluence (15-150 keV)             : 3.50889e-07 ( -2.50073e-08  2.51215e-08 ) ergs/cm2
Cutoff power-law model
Time interval is from    4.100 sec. to    5.100 sec.
Spectral model in the cutoff power-law:
------------------------------------------------------------
Parameters  : value       lower 90%   higher 90%
Photon index: -0.38113     ( -0.443405   0.495822 )
Epeak [keV] : 120.862      ( -28.672 97.1128 )
Norm@50keV  : 7.45241E-02    ( -0.0278329   0.050427 )
------------------------------------------------------------
#Fit statistic : Chi-Squared =          51.67 using 59 PHA bins.
# Reduced chi-squared =         0.9227 for     56 degrees of freedom
# Null hypothesis probability =   6.392181e-01

Photon flux (15-150 keV)    in 1 sec: 3.83017 ( -0.26749  0.26745 ) ph/cm2/s
Energy fluence (15-150 keV)             : 3.38626e-07 ( -2.68519e-08  2.67247e-08 ) ergs/cm2
Time-resolved spectra
Distribution
T90 vs. Hardness ratio plot
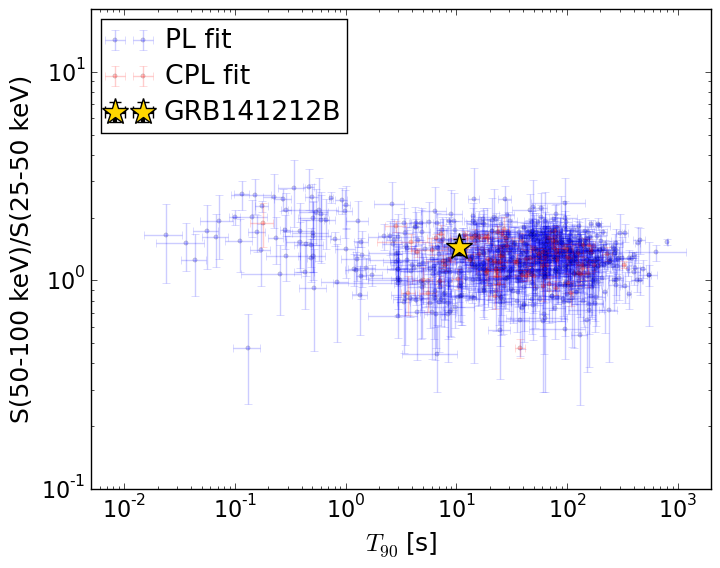
T90                                   = 10.508 sec.
Hardness ratio (energy fluence ratio) = 1.45381788178
S(15-50 keV) vs. S(50-150 keV) plot
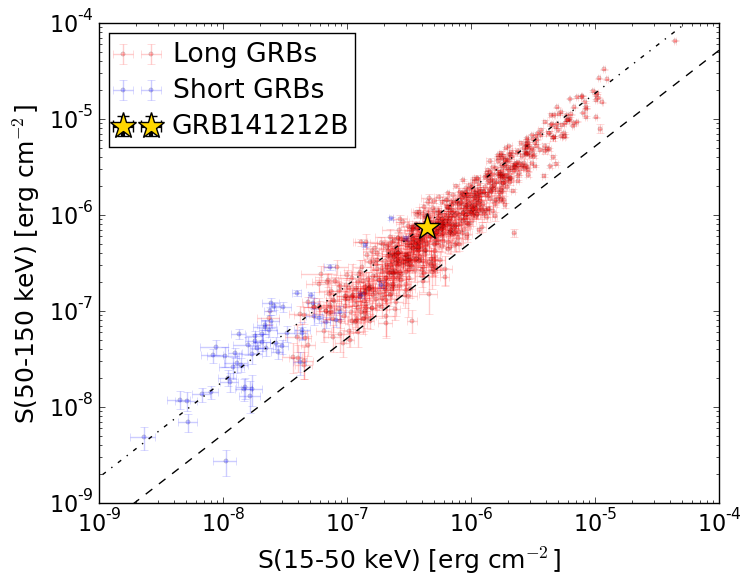
S(15-50 keV)  = 4.401676e-07
S(50-150 keV) = 7.455501e-07
The dash-dotted line and the dashed line traces the fluences calculated from the Band function with Epeak = 15 and 150 keV, respectively. Both lines assume a canonical values of alpha = -1 and beta = -2.5.
Mask shadow pattern
IMX = 5.819381555698157E-01, IMY = -5.878992609027462E-03
Spacecraft aspect plot
Bright source in the pre-burst/pre-slew/post-slew images
Pre-burst image of 15-350 keV band
Time interval of the image:
-239.152000 -0.060000

# RAcent  DECcent POSerr Theta    Phi  PeakCts   SNR AngSep     Name
#  [deg]    [deg]    ['] [deg]  [deg]                   [']
254.6307  35.2927    8.0  28.5    9.6   0.4237   1.4    9.0	Her X-1
268.3209  -1.2611    7.7  25.2  -84.8   0.4625   1.5   11.8	SW J1753.5-0127
273.8621 -14.0258   28.1  35.0 -104.7   0.2551   0.4    8.4	GX 17+2
284.9583 -24.9897   11.5  45.1 -122.3   1.1020   1.0    5.9	HT1900.1-2455
288.7778  10.9414    0.7  11.2 -155.1   3.8527  16.2    1.2	GRS 1915+105
299.5942  35.2109    0.8  21.7  103.5   4.7932  15.1    0.6	Cyg X-1
308.1302  40.9800    3.9  30.5  102.4   1.3397   3.0    1.9	Cyg X-3
320.6448 -22.9007    2.8  57.2 -161.7   5.3887   4.1 ------	UNKNOWN
237.7604   7.6466    3.6  44.5  -38.3   1.6369   3.2 ------	UNKNOWN
226.9698   8.0451    2.6  54.5  -33.0   5.9790   4.4 ------	UNKNOWN
Pre-slew background subtracted image of 15-350 keV band
Time interval of the image:
-0.060000 10.948600

# RAcent  DECcent POSerr Theta    Phi  PeakCts   SNR AngSep     Name
#  [deg]    [deg]    ['] [deg]  [deg]                   [']
254.4243  35.4855   10.5  28.7    9.8  -0.0628  -1.1    8.7	Her X-1
268.1818  -1.5267    0.0  25.5  -84.8  -0.0272  -0.4   12.0	SW J1753.5-0127
273.9609 -14.1399    4.0  35.1 -104.9   0.2644   2.9    6.7	GX 17+2
284.8068 -24.9918  832.8  45.1 -122.1   0.0029   0.0   13.2	HT1900.1-2455
288.9787  10.9610  295.1  11.3 -156.0   0.0019   0.0   10.7	GRS 1915+105
299.4616  35.0940    4.5  21.5  103.5   0.1540   2.5    9.0	Cyg X-1
308.1136  41.1569    0.0  30.6  102.1  -0.0966  -1.0   12.3	Cyg X-3
250.8658  31.7511    0.4  30.2    0.6   1.7226  30.2 ------	UNKNOWN
304.5310  -1.9226    2.2  31.2 -166.2   0.3025   5.3 ------	UNKNOWN
233.8197  10.8775    2.2  47.2  -32.2   0.5467   5.2 ------	UNKNOWN
Post-slew image of 15-350 keV band
Time interval of the image:
68.948600 530.148600

# RAcent  DECcent POSerr Theta    Phi  PeakCts   SNR AngSep     Name
#  [deg]    [deg]    ['] [deg]  [deg]                   [']
254.2896  35.2427    4.9   4.5  138.2  -0.9142  -2.3   10.2	Her X-1
268.3563  -1.5193    7.8  37.2 -109.9   1.4031   1.5    4.1	SW J1753.5-0127
288.8056  10.9361    0.8  40.7 -147.9   9.0200  13.8    0.7	GRS 1915+105
299.5989  35.2045    0.9  40.4  171.3   8.9259  12.5    0.5	Cyg X-1
308.2103  40.8442    5.4  46.3  161.7   2.5666   2.2    7.9	Cyg X-3
205.5587  43.1477    4.7  37.2   40.9   2.0298   2.5 ------	UNKNOWN
193.1677  13.9313    3.6  55.4    5.2   7.6909   3.3 ------	UNKNOWN
244.6453  12.3018    2.8  20.3  -62.3   1.9184   4.2 ------	UNKNOWN
304.0283   7.3293    3.2  55.1 -155.7   5.5845   3.6 ------	UNKNOWN
259.2174  -8.3368    3.8  40.9  -92.8   6.7266   3.1 ------	UNKNOWN